www.ijiset.com
221
The Effect of Different Concentrations of CuO on Solar
Cell Performance
P
1
P
Khadija Mohamed Fadol Mokhtar, P
2
P
Mubarak Dirar Abdallah & P
3
P
Sawsan Ahmed Elhouri Ahmed
P
1
P
Shaqra University-Aldawadmi College of Sciences and Humanities (KSA)
P
2
P
International University of Africa- College of Science-Department of Physics & Sudan University of Science& Technology-College of Science-Department of Physics-Khartoum-Sudan
P
3
P
University of Bahri- College of Applied & Industrial Sciences- Department of Physics - Khartoum- Sudan
Abstract:
CuO solar cells fabricated from polymer, with different CuO concentrations ranged from (0.3 to 0.25) mg/mL were prepared. It was found that increasing CuO concentration increases efficiency. This can be explained on the basis of the relation between current and concentration of CuO. In this work it is found that there is a sudden increase in the efficiency of the cell at concentrations of (0.28 and 0.25) this is explained by the same mechanism of Mott Insulator of super conductivity. It assumes the existence of narrow energy band in the energy gap; thus the shift of Fermi Level affects the efficiency.
Key words: solar cell, copper oxide, efficiency, concentration, energy gap
1. Introduction
Energy problem is one of the challenging problems facing modern civilization, petroleum energy was found to cause severe pollution, with limited abundance
[1].This forces scientists to search for better sustainable permanent, pollution free source. The most popular one, which satisfy these needs are the solar energy .Solar energy, can be converted to heat or electric energy [2]. Electric conversion is preferable, as for as electric energy is widely used.
222 temperature annealing method .cuR2Ro/Zno thin film solar cells have also been studied and reported however, the solar cells with CuO/ZnO structure have not widely fabricated and studied. Copper oxide (CuO) is metal oxide material that has been substantially explored for furious fields of applications. As a p-type semiconductor having narrow band gab of (1.35eV), CuO has great potential as a field emitter, catalyst and as a gas sensing medium. The physiochemical properties of CuO such as the photoconductivity and photochemistry can be tolerated for fabricating optical switches and solar. The CuR2Ro is of low cost, non toxic, available. The efficiency is about 9-1190, it has band gap of 2 eV , which is suitable for solar energy 1-2 eV .conversion which needs band gap in this range[5].Due to these features of CuO, this wane is concerned with studying the performance of CuO solar cell having different concentrations. This is done in section (2) which describes materials and methods. Sections (3) and (4) are devoted for discussion and conclusion.
2. Materials and methods
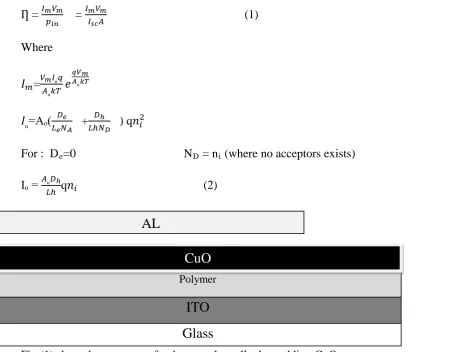
The materials used in fabricating solar cell consists of ITO glass which act as a substrate on which was Deposited (MEH-PPV) polymer with concentration of 0.2 mg/mL another layer from copper oxide with concentration of 0.3 mg/mL was deposited on the polymer , aluminium was putted on copper oxide to represent the anode while ITO cathode , six cell with different concentrations (0.3,0.29,0.28,0.27,0.26 and 0.25) mg/mL of copper oxide was fabricated by adding certain value of ethanol ,also for doping the polymer was added the chloroform. The devices were characterized by ultra violet visible spectroscopy. Also our apparatus include voltmeter, ammeter, rheostat and light source lamp. Cell was offered to light and the different readings of voltmeter and ammeter were taken by using rheostat.
The efficiency of the solar cell is given by
Ƞ = 𝐼𝑚𝑉𝑚
𝑝𝑖𝑛 =
𝐼𝑚𝑉𝑚
𝐼𝑠𝑐𝐴 (1)
Where
𝐼𝑚=𝑉𝐴𝑚ₒ𝑘𝑇𝐼ₒ𝑞𝑒
𝑞𝑉𝑚 𝐴ₒ𝑘𝑇
𝐼ₒ=Aₒ(𝐿𝑒𝐷𝑁𝑒𝐴 +𝐿ℎ𝑁𝐷ℎ𝐷 ) q𝑛𝑖2
For : DReR=0 NRDR = nRiR (where no acceptors exists)
Iₒ = 𝐴ₒ𝐷ℎ
𝐿ℎ q𝑛𝑖 (2)
Fig (1) show the structure of polymer solar cell when adding CuO
Glass
ITO
Polymer
www.ijiset.com
223 3. Results
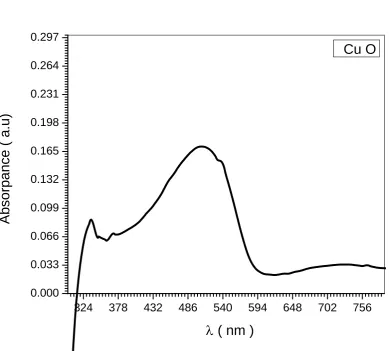
Fig (2) UV-visible absorption spectra of thin films
324 378 432 486 540 594 648 702 756
0.000 0.033 0.066 0.099 0.132 0.165 0.198 0.231 0.264 0.297
A
bs
orpanc
e ( a.
u)
λ
( nm )
224 Fig (3) Transmittance spectrum of CuO
Fig (4) is plot, which shows (αhν)P
2
Pversus hν for the CuO.
312 351 390 429 468 507 546 585 624
0.0 8.9 17.8 26.7 35.6 44.5 53.4 62.3 71.2
Tr
ans
m
it
tanc
e (
a.
u )
λ ( nm )
CuO
0.00 0.28 0.56 0.84 1.12 1.40 1.68 1.96 2.24 0.00
5.60x10¹³ 1.12x10¹⁴ 1.68x10¹⁴ 2.24x10¹⁴ 2.80x10¹⁴ 3.36x10¹⁴ 3.92x10¹⁴ 4.48x10¹⁴
(
α
h
υ
)
2 (
eV
cm
-1 )
2
hυ ( eV )
CuO
www.ijiset.com
225 Fig (5) the relation between voltage and current for copper oxide cell with concentration of
0.3 mg/mL
Fig (6) the relation between voltage and current for copper oxide cell with concentration of 0.29 mg/mL
0.585 0.598 0.611 0.624 0.637 0.650 0.663 0.676 0.689 0.00
1.20x10⁻³
2.40x10⁻³
3.60x10⁻³ 4.80x10⁻³ 6.00x10⁻³
7.20x10⁻³ 8.40x10⁻³ 9.60x10⁻³
1.08x10⁻²
C
u
rr
e
n
t (
A
)
Voltage ( v )
Cell 7
Isc = 9.76 x10⁻³
A
Imax =8.2 x10⁻³ A
Vmax = 0.679 V
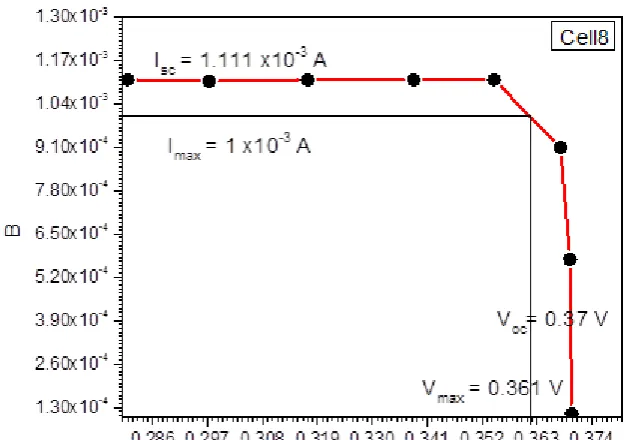
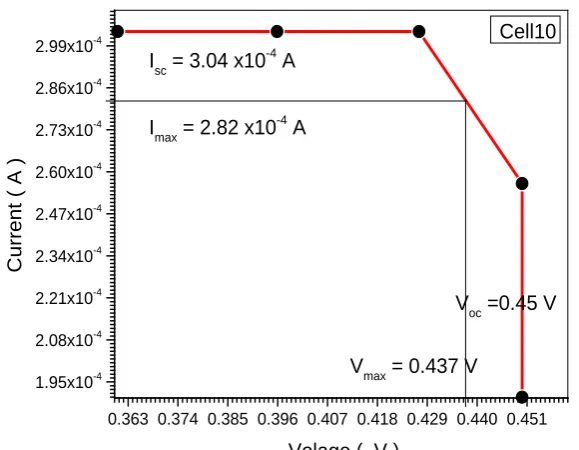
226 Fig(7) the relation between voltage and current for copper oxide cell with concentration of
0.28 mg/mL
Fig (8) the relation between voltage and current for copper oxide cell with concentration of 0.27 mg/mL
0.48 0.50 0.52 0.54 0.56 0.58 0.60 0.62 0.64 1.30x10⁻⁴
2.60x10⁻⁴ 3.90x10⁻⁴ 5.20x10⁻⁴ 6.50x10⁻⁴ 7.80x10⁻⁴ 9.10x10⁻⁴ 1.04x10⁻³ 1.17x10⁻³ 1.30x10⁻³
C
u
rr
e
n
t (
A
)
Voltage ( V )
Cell 9
Isc = 1.2x10⁻³ A
Imax = 9.7 x10⁻⁴ A
Voc = 064 V
Vmax = 0.62 V
0.363 0.374 0.385 0.396 0.407 0.418 0.429 0.440 0.451 1.95x10⁻⁴
2.08x10⁻⁴
2.21x10⁻⁴ 2.34x10⁻⁴
2.47x10⁻⁴ 2.60x10⁻⁴
2.73x10⁻⁴ 2.86x10⁻⁴
2.99x10⁻⁴
C
u
rr
e
n
t (
A
)
Volage ( V )
Cell10 Isc = 3.04 x10⁻⁴ A
Imax = 2.82 x10⁻⁴ A
Voc =0.45 V
www.ijiset.com
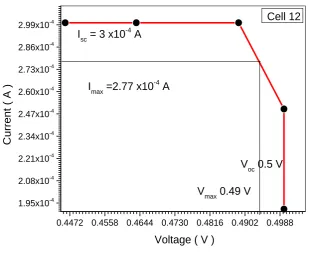
227 Fig (9) the relation between voltage and current for copper oxide cell with concentration of
0.26 mg/mL
Fig(10) the relation between voltage and current for copper oxide cell with concentration of 0.25 mg/mL
0.4472 0.4558 0.4644 0.4730 0.4816 0.4902 0.4988 1.95x10⁻⁴
2.08x10⁻⁴ 2.21x10⁻⁴
2.34x10⁻⁴ 2.47x10⁻⁴
2.60x10⁻⁴ 2.73x10⁻⁴ 2.86x10⁻⁴ 2.99x10⁻⁴
C
u
rr
e
n
t (
A
)
Voltage ( V )
Cell 12
Isc = 3 x10⁻⁴ A
Imax =2.77 x10⁻⁴ A
Voc 0.5 V
228 Table (1) show the voltmeter and ammeter readings (CuO) cell with concentration of
0.3 mg/mL
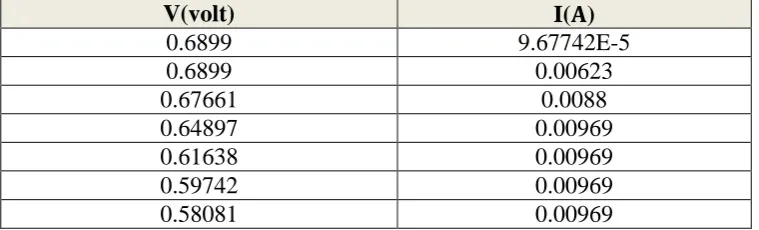
Table (2) show the voltmeter and ammeter readings (CuO) cell with concentration of 0.29 mg/mL
V(volt) I(𝐀)
0.6899 9.67742E-5
0.6899 0.00623
0.67661 0.0088
0.64897 0.00969
0.61638 0.00969
0.59742 0.00969
0.58081 0.00969
Table (3) show the voltmeter and ammeter readings (CuO) cell with concentration of 0.28 mg/mL
V(volt) I(𝐀)
0.63983 1.18651E-4
0.63983 6.21525E-4
0.62685 0.00104
0.58843 0.0012
0.53655 0.0012
0.50111 0.0012
0.4732 0.0012
Table (4) show the voltmeter and ammeter readings (CuO) cell with concentration of 0.27mg/mL
V(volt) I(𝐀)
0.44993 1.90246E-4
0.44993 2.5637E-4
0.42719 3.03419E-4
0.39587 3.03419E-4
0.36067 3.03419E-4
V(volt) I(𝐀)
0.36993 1.10557E-4
0.36964 5.72962E-4
0.36769 9.09736E-4
0.3544 0.00111
0.33832 0.00111
0.31697 0.00111
0.29728 0.00111
www.ijiset.com
229 Table (5) show the voltmeter and ammeter readings (CuO) cell with concentration of
0.26mg/mL
V(volt) I(𝐀)
0.32091 2.93284E-4
14.9363 2.94094E-4
31.91526 2.94094E-4
38.50361 2.60029E-4
38.50361 1.91443E-4
Table (6) show the voltmeter and ammeter readings (CuO) cell with concentration of 0.25mg/mL
V(volt) I(𝐀)
0.49978 1.91443E-4
0.49978 2.49859E-4
0.48864 3.00182E-4
0.46352 3.00182E-4
0.44607 3.00182E-4
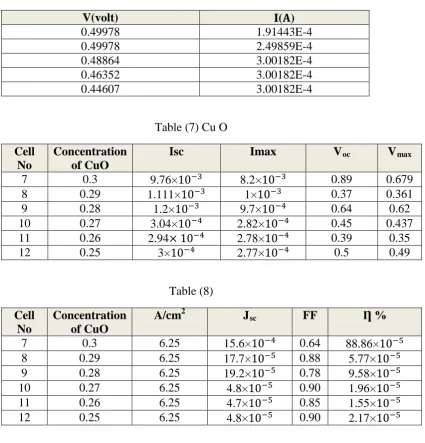
Table (7) Cu O
Cell No
Concentration of CuO
Isc Imax VRoc VRmax
7 0.3 9.76×10⁻³ 8.2×10⁻³ 0.89 0.679
8 0.29 1.111×10⁻³ 1×10⁻³ 0.37 0.361
9 0.28 1.2×10⁻³ 9.7×10⁻⁴ 0.64 0.62
10 0.27 3.04×10⁻⁴ 2.82×10⁻⁴ 0.45 0.437
11 0.26 2.94× 10⁻⁴ 2.78×10⁻⁴ 0.39 0.35
12 0.25 3×10⁻⁴ 2.77×10⁻⁴ 0.5 0.49
Table (8)
Cell No
Concentration of CuO
A/cmP
2
JRsc FF Ƞ %
7 0.3 6.25 15.6×10⁻⁴ 0.64 88.86×10⁻⁵
8 0.29 6.25 17.7×10⁻⁵ 0.88 5.77×10⁻⁵
9 0.28 6.25 19.2×10⁻⁵ 0.78 9.58×10⁻⁵
10 0.27 6.25 4.8×10⁻⁵ 0.90 1.96×10⁻⁵
11 0.26 6.25 4.7×10⁻⁵ 0.85 1.55×10⁻⁵
230 4. Discussion
According to fig (2) the absorption is m at wave length 515.5 nm which corresponds to the energy gap 2.4 eV This value conforms with the energy gap value obtained directly from the intercept of curve tangent with the energy axis , where ERgR=2.1 eV . This value agrees with the range of CuO energy gap values (1.3-2 eV).When Fermi level exists in the band gap between donor and upper band the efficiencies of CuO solar cells decrease as concentrations decrease, where the efficiencies assumes the values , 8.886×10P
-4
P
,5.77×10P
-5
P
,1.96×10P
-5
P
, 1.55 ×10P
-5
P
for concentrations , 0.3, 0.29, 0.27, 0.26 respectively. This agree with the theoretical relations (1) and (2) where the decrease of concentration n decreases free carriers concentration thus decreasing the efficiency .However for the concentrations 0.28 and 0.25 the efficiencies 9.58×10⁻⁵ and 2.17×10⁻⁵show abrupt increase. This can be explained by a mechanism similar to that used to explain the mechanism by which Mott insulator is converted to a super conductor. Here we assume the existence of narrow energy band inside the energy gap. upon decreasing CuO concentration Fermi level, which separates conduction band and valence band moves down ward till it enters the sub band which splited into
conduction band and valence band with no energy gap thus increases suddenly the value at 0.28 to be 9.58×10P
-5
P
, upon decreasing n to become 0.27 and 0.26 the Femi level leave the sub band to the lower energy gap thus decreases to 1.96 ×10P
-5
P
, 1.55 ×10P
-5
P
again. when n is
decreased to 0.25 the Fermi level move down again to enter the main valence (lower ) band , where it split it to conduction band and valence band , with no band gap which leads to sudden increase of current and thus efficiency.
5. Conclusion
The efficiency of CuO solar cell can be increased by changing concentration of CuO. One can also change the efficiency by controlling the Fermi level position also.
References
1. The effect of hydrostatic pressure on the ambient temperature structure of CuO, Forsyth J.B., Hull S., J. Phys.: Condens. Matter 3 (1991) 5257-5261 ,
doi:10.1088/0953-8984/3/28/001. Crystallographic point group: 2/m or CR2hR. Space group: C2/c. Lattice parameters: a = 4.6837(5), b = 3.4226(5), c = 5.1288(6), α = 90°, β = 99.54(1)°, γ = 90°.
2. "NIOSH Pocket Guide to Chemical Hazards #0150". National Institute for Occupational Safety and Health (NIOSH).
3. H. Wayne Richardson "Copper Compounds in Ullmann's Encyclopedia of Industrial Chemistry 2002, Wiley-VCH, Weinheim. doi:10.1002/14356007.a07_567