Joint Activities of Market Basket Analysis and
Product Facing for Business Intelligence oriented
on Global Distribution Market: examples of data
mining applications
Alessandro Massaro#1, Angelo Galiano#2, Donato Barbuzzi#3, Leonardo Pellicani#4, Giuseppe Birardi#5, Davide Donato Romagno#6, Luisa Frulli*1
#
Dyrecta Lab, Research Institute
Via V. Simplicio 45, 70014 Conversano (BA) - Italy
*
Fruman Rappresentanze srl Via Demetrio Marin 35, 70125 Bari - Italy
Abstract— In this paper are planned business intelligence
activities for global distribution market (GDO). More specifically, market basket analysis and product facing are performed respect to a short, medium and long period. The joint analysis has been performed by data mining algorithms on the RapidMiner platform. The goal of this work is to define predictive analysis in order to activate market strategies taking into account of: promotions, warehouse management, product correlation and product displacement both in the shelves and in the whole store. For the business analysis different algorithms in the machine learning have been performed, such as neural network, k-means, association rules, and correlation matrix. The algorithms have been applied respect to the short, medium and long period. Finally, standard procedures will be applied for the purpose of this work in GDO applications.
Keywords— Market Basket Analysis, Product Facing, Data
Mining, GDO, RapidMiner.
I. INTRODUCTION
In the Global Distribution Market, variables and parameters are very important for the predictive analysis. In particular, according to many studies [1] [2] [3], eye-level location was the most desirable location, i.e. highest sale location. Moreover, other important aspects for sale prediction are: customer behavior [4] [5], the evaluation of Market Basket indicators [5] [6] [7] [8] [9], the Visual Merchandising [10], the design of the store layout [11] and the promotion activities [12]. These aspects could be considered together for a complete analysis of market basket correlated with shelf allocation theory.
Different data mining tools can be applied in order to support the analysis [13] [14]. In particular, object oriented workflow (Graphical User Interfaces - GUI) could be implemented in order to simplify the analysis [15]. A tool which can be used for implementation of data mining workflows is RapidMiner Studio [16]. This tool will be applied for the simulation of the proposed paper.
II. ANALYSES AND BUSINESS INTELLIGENCE APPROACHES, EXAMPLE OF SHELF ALLOCATION AND
DISCUSSION
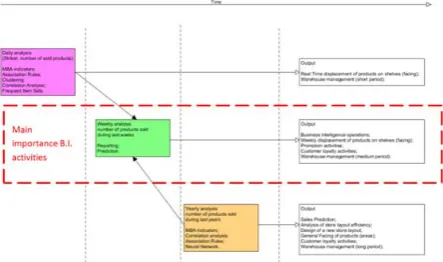
Three different types of analysis can be performed both for the prediction and for the sales optimization of: food, no-food and beverage. Fig. 1 shows a sketch of time scheduling of Business Intelligence (B.I.) operations.
Fig. 1. Time scheduling of business intelligence operations and outputs.
adopted are related to MBA indicators, correlation matrix, association rules and neural networks. Fig. 2 reports an example of analysis, providing motivations of product displacement (on the left of the figure there is the initial configuration, besides on the right, marked by dashed line, there is the new configuration).
Fig. 2. Product facing (weekly analysis): shelf space allocation. The red line indicates the most important allocation.
Now, we lists the potential motivations that have generated such movements. The product O has been moved from the second shelf to third shelf (center shelf). This displacement may be due to:
a sales analysis of the last week;
a sales analysis of several weeks (if the sales were low, you will apply a promotion for that product); the need to "dispose of stocks" (warehouse
management);
an analysis of the daily sales, in which the sale prediction is rather low (by the neural networks output) or because the product is found to be totally "uncorrelated" to the product N and more closely correlated to the product L (analysis by means of the correlation matrix, indicators MBA or products clustering);
an annual evaluation, that the product is little sold for a specific layout used (for this purpose could be useful also change the layout of the shelves) or because low sales are predicted;
a commercial strategy which takes into account activated contracts.
In the same graph can be observed other displacements for the following products:
product P: moved from the first shelf to the fifth shelf (central shelf) for the same motivation described for the product O;
product H: moved from fifth shelf (central shelf) to the first shelf. This displacement may be due to the fact that the sales forecasts for this product are efficient, or because for the product is activated the promotion (there is no need to place it in the center of the shelf), or because it is "associated" with the sale of the adjacent product (product C); product F: moved from the sixth shelf to third shelf
(center) for reasons similar to those described for the product O;
displacement of the product M from third shelf (center shelf) to the second shelf (see reasons listed for the product H);
displacement of product Q from third shelf (central shelf) the sixth shelf (see reason listed for the product H).
Furthermore are observed further displacements:
product I is also added in the fifth shelf. It always remains in good visibility, but it is also associated with the product P;
the fourth shelf (central shelf) remains unchanged for the sales policies or because the allocation of the products I, G and R are defined by a contract; The seventh and sixth shelves remain almost
unchanged, since the sales of these products satisfy the strategies and the products are closely correlated.
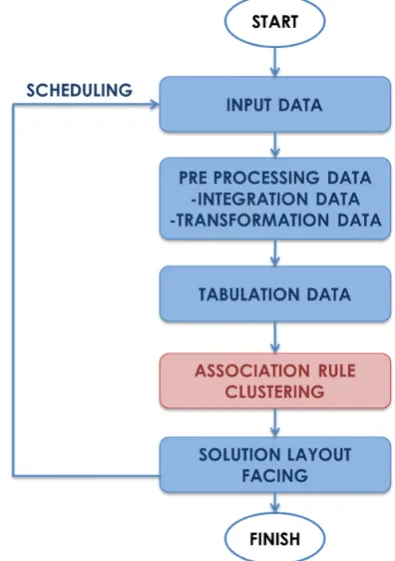
The above mentioned example is related to daily and weekly analysis. Other factors, such as open data and yearly analysis could influence the allocation choice of the product (see Fig. 1). Anyway association rules and clustering represent important tools for a preliminary sales prediction. More specifically, the Fig. 3 shows the flow chart referred to the long term analysis.
Fig. 3. Flow chart for the facing planning.
The scheduled analysis is performed after: 1. input data reading;
3. tabulation data (creation of a single dataset with useful attributes);
4. algorithms execution: association rule and clustering;
5. facing layout planning.
In the next session, more details and examples about the analysis in the short, medium and long periods are discussed.
III.RAPIDMINER TOOL
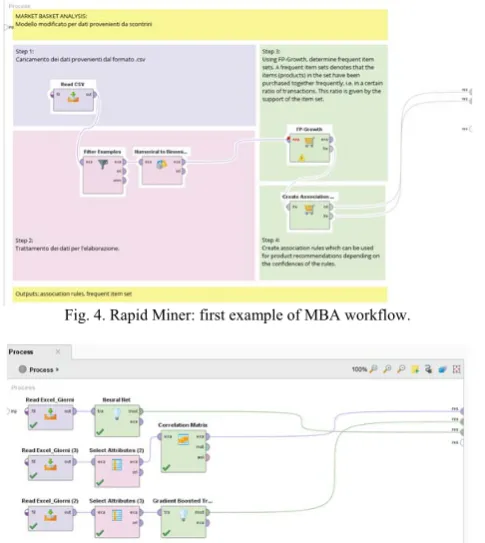
In this section we will give a short overview about the concepts of traditional Data Mining (DM). The open source RapidMiner is one of the best DM tools [17]. One can say that Knowledge Discovery in Databases (KDD) is the whole field of research of extracting new and interesting knowledge out of (masses of) information, which in addition might be much unstructured. The term KDD is often used equivalently in one context with the term of DM, which describes the techniques used to extract that knowledge. Because the amount of information is often huge, the techniques must be scalable to work efficiently. Traditionally this extraction was done on databases containing related entities. These relations are decomposed and put into a flat form in order just to have one table to learn from. As it is the same convention in RapidMiner from now on this table is called exampleset, and this exampleset, again, contains examples. In addition, examples consist of attributes. The special label attribute is the one to predict from unlabeled new examples. Fig. 4 and Fig. 5 show the workflows, used for the analysis, in RapidMiner platform.
Fig. 4. Rapid Miner: first example of MBA workflow.
Fig. 5. Rapid Miner: second example of Neural Net, Clustering (gradient boosted tree) and Correlation Matrix workflows.
IV.B.I. IN SHORT PERIOD
An overview of the short period outputs are illustrated in Fig. 6, where it is shown how business intelligence activities of the short period can be activated by means of different analyses. The main activity is related to the clustering task.
Fig. 6. Data mining outputs: daily outputs.
Clustering is useful in order to allocate in the same space (or shelf) products belonging to the same group. The clustering output can be achieved by RapidMiner, for example using the workflow block related to the k-means algorithm. More specifically, k indicates the cluster number. As reported, Pie 3D plot can be used for the clustering results (see Fig. 7). Association rules are also important to define the associations between the products such as promotion, central position and sold products quantity. A quick approach to read the associations is the circle plot of Fig. 7. This plot provides graphic associations and, at the same time, MBA parameters such as: support, confidence, lift, gain, conviction, Laplace, p-s.
Fig. 7. Rapid Miner: (left) 3D Pie plot, (right) circle plot.
More specifically:
The support of a condition is equal to the number of records in the dataset for which evaluates to true, and this value is denoted as
The confidence of a rule is the probability with which the consequent evaluates to true given that the antecedent evaluates to true in the input dataset, computed as:
→ sup →
sup
Lift, a well-known statistical measure that can be used to rank rules in IBM’s Intelligent Miner [18], can also be framed as a function of confidence [19]
→ | |conf →
sup
Where | | represents the number of data in the dataset. Lift is obviously monotone in confidence and unaffected by rule support when confidence is held fixed.
The gain function of Fukeda et al. [20] has defined as:
→ sup → ∗
Where is a fractional constant between 0 and 1.
the Conviction has considered as a function of confidence:
→ | | sup →
| | 1 conf →
Conviction is obviously monotone in confidence since confidence appears in a subtractive term within the denominator. It is also unaffected by variations in rule support if confidence is held constant, which implies monotonicity.
The Laplace function is commonly used to rank rules for classification purpose. Its equation is:
→ sup → 1
sup
The constant is an integer greater than 1 (usually set to the number of classes when building a classification model).
Another interestingness metric that is identical to gain for a fixed value of sup /| | was introduced by Piatetsky-Shapiro [21]:
→ sup → sup sup
| |
In Fig. 8 we illustrate an output example (simulation results) of MBA, using the Association Rules. More specifically, the outputs have been obtained respect to the promises and
conclusions of the rule as: quantity of product sold (under a defined threshold), promotion, and central shelf.
Fig. 8. MBA output (Association Rules).
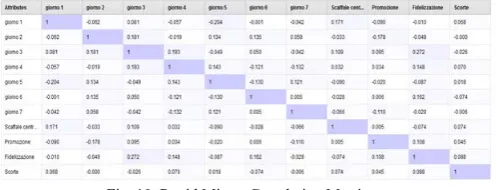
The analysis of the MBA indicators is useful for the comparison with the correlation results obtained by the correlation Matrix. In the daily simulation the correlation is found between the following instances (see Fig. 9):
giorno1, giorno2,…, giorno7 show the number of sold products in a day, during the week; Promozione shows if the promotion condition is
activated (1) for a specific product, otherwise will be assigned the value 0 ;
Fidelizzazione shows the purchased products from loyal customers (corresponding to the binary value 1/0);
Scorte (warehouse stocks) represents a binary value. Over a threshold can be assigned the value 1, otherwise will be assigned the value 0.
Fig. 9. Rapid Miner: Dataset
In Fig. 10 is illustrated the correlation matrix, using the dataset shown in Fig. 9.
Figure 4 and Figure 5 shown two different examples of Rapid Miner workflow, concerning the daily outputs. Another useful algorithm which can be used for real time product allocation is the sale prediction by means of artificial neural networks (ANN). In particular, ANN provides the weights for the sales prediction, in each product and each cluster.
V. B.I. IN MEDIUM PERIOD
In the medium period, the business intelligence is very important because it offers weekly promotions. So, in order to plan the BI activities, the shelves are monitored. More specifically, photos of the shelves, sales in last weeks and sales forecast are analyzed. In this latter case, it’s important to define two different thresholds (as lower and upper limit) for promotion condition and product facing. Figure 11 shows a weekly analysis.
Fig. 11. Data mining outputs: daily outputs.
Figure 12 shows an example of B.I. interpretation. In particular, on the x-axis are indicated the code of the product and on the y-axis are reported the number of sales of the week. Thresholds are fixed to 5 and to 20 (see dark horizontal lines),
1. It is necessary, under the first threshold (5), to activate promotional activities for those products; 2. It is necessary, for sales including between 5 and
20, to allocate products in the central shelf; 3. It is important, for sales of more than 20 units, to
control stocks and the availability products in the warehouse.
Fig. 12. Business Intelligence: output analysis.
VI.B.I. IN LONG PERIOD
In long periods, the B.I. activities can be applied in order to define the best store layout for a macro-analysis. In this way the attention will be focused on the store respect to the single shelf. For this purpose different algorithms can be considered (see Fig. 13).
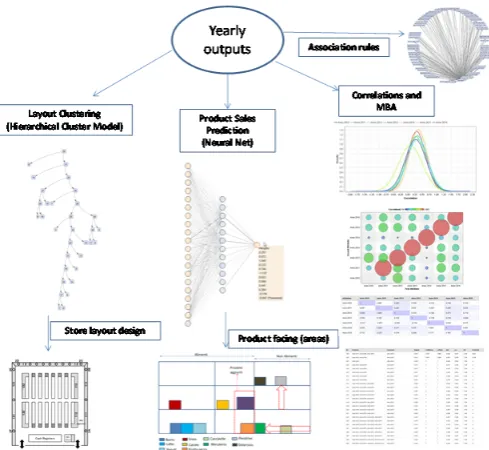
Fig. 13. Data mining outputs: yearly outputs.
The Hierarchical Cluster Model provides different clusters of the store layout respect to the last years. This algorithm could help to find the correlations between improved layouts in each year. By layouts group of best sales, will be possible to evaluate the shelf best configuration in the whole store. Moreovere, Artificial Neural Network (ANN) could be applied in order to plan the best products placement, according to the shelf best allocation found in a particular year characterized by a lot of sales. In this last case, the attributes can be the products, and other attributes such as the shelf allocation. By applying Neural Network algorithm will be possible to predict the associations of products that will be sold.
It is important to compare the hierarchical clustering results with other algorithms such as Correlation Matrix (see Fig. 14). This comparison will increase the success of the layout prediction. Another important aspect is to find anomalous store layout. This is possible applying the density distribution plot: in the example shown in Fig. 14 it is clear how the anomalous years was the 2014. This can be interpreted as a store layout completely different from the other ones (there is no significant correlation with the store layouts of the other years).
Finally association rules could provide information about MBA indicators, associated to the store layouts of the whole years. The MBA indicators will complete the yearly analysis. In Fig. 15 is illustrated an example of RapidMiner workflow suitable for the yearly analysis. The simulations have been performed respect to the last store layouts associated to the last seven years.
Fig. 15. A workflow example for yearly analysis.
VII. CONCLUSION
The goal of this paper was to describe different approaches for planning activities of shelves allocation. The methods are suitable for product of massive distribution and provides key interpretations for data mining algorithms. Different algorithms were described. The algorithms were applied to different phases of the analysis such as short, medium and long period. The paper was structured in order to define the different outputs of the Rapid Miner GUI workflows, combining: clustering, prediction and market basket indicators.
ACKNOWLEDGMENT
The work has been developed in the frameworks of the Italian projects: “Sistema Intelligente Integrato di Market Basket Analysis e Facing di Prodotti [Integrated Intelligent System of Market basket Analysis and Shelf Product Placement]”. Authors gratefully thanks: Custodero Vito, Fanelli Giacomo, Legrottaglie Mattia, Leogrande Angelo, Maffei Laura, Malfettone Nunzia, Patruno Lorenzalda, Vitti Valeria and Valenzano Elisabetta for their support in the realization of this work.
REFERENCES
[1] Davor Dujak, Marina Kresoja, Jelena Franjković, “Space management in category management - a comparative analysis of retailers in the subcategory of pickled and preserved vegetables,” Proceeding of 21th International Scientific Conference SM2016 Strategic Management and Decision Support Systems in Strategic Management, 2016, pp. 410-424.
[2] Chung, C., Schmit, T.M., Dong, D. & Kaiser, H.M. (2007). Economic Evaluation of Shelf-Space Management in Grocery Stores, Agribusiness, Vol. 23 (4) 583–597.
[3] Segetlija, Z. & Dujak, D. (2013). Upravljanje kategorijama proizvoda (category management), Ekonomski fakultetu Osijeku, Osijek.
[4] Rasa Gudonaviciene, Sonata Alijosiene, “Visual Merchandising Impact on Impulse Buying Behavior,” Procedia - Social and Behavioral Sciences 213 (2015) 635 – 640.
[5] Jeff Tanner, Mary Anne Raymond “Consumer behavior: how people make buying decisions”, chapter 3, Marketing Principles v1.0, 2012.
[6] Roberto J. Bayardo, Rakesh Agrawal, “Mining the Most Interesting Rules,” Proc. of the Fifth ACM SIGKDD Int’l Conf. on Knowledge Discovery and Data Mining, 145-154, 1999.
[7] Paul D. McNicholas, Yanchang Zhao, “Association Rules: An Overview,” Chapter 1, IGI Global, 2009.
[8] S. Brin, R. Motwani, J. D. Ullma, and S. Tsur, “Dynamic Itemset counting and implication rules for Market Basket Data,” SIGMOD '97 Proceedings of the 1997 ACM SIGMOD international conference on Management of data Pages 255-264.
[9] Herman Aguinis, Lura E. Forcum, Harry Joo, “Using Market Basket Analysis in Management Research,” Journal of Management Vol. 39 No. 7, November 2013, 1799-1824.
[10] Ivana Štulec, Kristina Petljak, Anja Kukor,” The Role of Store Layout and Visual Merchandising in Food Retailing,” European Journal of Economics and Business Studies, Jan-Apr 2016, Vol.4, Nr. 1.
[11] Masao Otha, and Yoshiyuki Higuci, “Study on design of supermarket store layouts: the principle of “Sales Magnet”,” World Academy of Science, Engieering and Technology, Vol.7, 2013. [12] Ms. Shallu, and Ms. Sangeeta Gupta, ““Impact of Promotional
Activities on Consumer Buying Behavior: A Study of Cosmetic Industry”,” IRACST – International Journal of Commerce, Business and Management (IJCBM), ISSN: 2319–2828 Vol. 2, No.6, December 2013.
[13] A. Al Essa, and C. Bach, «Data Mining and Knowledge Management for Marketing,» International Journal of Innovation and Scientific Research, vol. 2, n. 2, pp. 321-328, 2014.
[14] H. Sheng-Hsiang, C.-Y. Tsai, and C.-C. Lo, «A Multi-Data Mining for shelf Space Optimization Considering Customer Behaviour,» Proceeding of the 11th International conference on e-Business (ICE 2014), pp. 89-95, 2014.
[15] Angelo Galiano et al, “Machine to Machine (M2M) Open Data System for Business Intelligence in Products Massive Distribution oriented on Big Data,” (IJCSIT) International Journal of Computer Science and Information Technologies, Vol. 7 (3) , 2016, 1332-1336.
[16] RapidMiner. https://rapidminer.com/
[17] Top 10 Data Analysis Tools for Business.
http://www.kdnuggets.com/2014/06/top-10-data-analysis-tools-business.html
[18] International Business Machines, 1996. IBM Intelligent Miner User’s Guide, Version 1, Release I.
[19] Bayardo, R. J.; Agrawal, R.; and Gunopulos, D. 1999. Constraint-Based Rule Mining in Large, Dense Databases. In Proc. of the 15th Int’l Conf on Data Engineering, 18% 197.
[20] Fukuda, T.; Morimoto, Y.; Morishita, S.; and Tokuyama, T. 1996. Data Mining using Two-Dimensional Optimized Association Rules: Scheme, Algorithms, and Visualization. In Proc. of the 1996 ACM-SIGMOD Int’l Con on the Management of Data, 13-23.