Cloud Service Providers Optimized Ranking Algorithm based on Machine Learning
and Multi-criteria Decision Analysis
Muhammad
*Umer Wasim
◦, Abdallah
*A. Z. A.
Ibrahim
◦, Pascal Bouvry
Computer Science and Communication Lab University of Luxembourg, Luxembourg
firstname*.lastname◦@uni.lu
Tadas Limba
Digital and Creative Industries LAB Mykolas Romeris University
Vilnius, Lithuania [email protected]
Abstract—Multi-criteria decision analysis (MCDA), one of the prevalent branches of operations research, aims to design mathematical and computational tools for selecting the best alternative among several choices with respect to specific criteria. In the cloud, MCDA based online brokers uses customer specified criteria to rank different service providers. However, subjected to limited domain knowledge, the customer may exclude relevant or include irrelevant criterion, which could result in suboptimal ranking of service providers. To deal with such misspecification, this research proposes a model, which uses notion of factor analysis from the domain of unsupervised machine learning. The model is evaluated using two quality-of-service (QoS) based datasets. The first dataset i.e., feedback from customers, was compiled using leading review websites such as Cloud Hosting Reviews, Best Cloud Computing Providers, and Cloud Storage Reviews and Ratings. The second dataset i.e., feedback from servers, was generated from cloud brokerage architecture that was emulated using high performance computing (HPC) cluster at University of Luxembourg (HPC @ Uni.lu). The simulation runs in a stable cloud environment i.e. when uncertainty is low, shows that online broker (equipped with the proposed model) produces optimized ranking of service providers as compared to other brokers. This is due the fact that proposed model assigns priorities to criteria objectively (using machine learning) rather than using priorities based on subjective judgments of the customer. This research will benefit potential cloud customers that view insufficient domain knowledge as a limiting factor for acquisition of web services in the cloud.
Keywords—multi-criteria decision analysis (MCDA), online broker, misspecification of criteria, structural uncertainty, unsupervised machine learning, factor analysis, quality of service (QoS).
I. INTRODUCTION
Multi-criteria decision analysis (MCDA), one of the prevalent branches of operations research, aims to design mathematical and computational tools for selecting the best alternative among several choices, with respect to specific criteria [1, 2]. It prescribes a methodology that deals with the most important components in the process of decision making and aims at supplying reliable information to take an unbiased decision [3]. These components include a pre-established goal achievable under given constraints. Constraints are criteria used to rank potential alternatives. An unbiased ranking of alternatives is based upon selection of relevant criteria by a decision maker which strongly relates
to his/her profound knowledge of the subject matter [1, 4]. Hence, the approach is termed ineffective when the decision maker has insufficient domain knowledge [5-7].
For example, let’s assume a startup called Moogle is using cloud based brokerage architecture to buy online storage service for data backups. The goal of online broker is to select a service provider with best QoS from the list: carbonite, dropbox, ibackup, justcloud, sos online backup, sugarsync, and zip cloud. A ranking of these service providers is generated by online broker using following QoS based criteria: availability, response time, price, speed, ease of use, technical support, and customer services. However, Moogle as per its insufficient domain knowledge for cloud based storage environment includes an additional criterion of storage space to the list. As a result, the ranking generated by online broker for service provider is off by a certain amount and consequently, Moogle bypasses an optimal choice for online storage service in the cloud.
Since most common MCDA methods used by online brokers fail to operate without customer interference, a model to deal with misspecification of criterion owing to insufficient knowledge of a customer is needed [8-10]. For this purpose, the integration of unsupervised machine learning and MCDA has been explored in this research. The remaining parts of this paper are organized as follows. Section II presents related literature and research gap. Section III and IV present proposed model and its evaluation in an online cloud environment, respectively. Finally, section V concludes the paper and present directions for future research.
II. LIERATURE REVIEW AND RESEARCH GAP
To identify models used by online brokers to generate ranking of service providers, the research published between January 2010 and March 2017 was explored by using the following databases: ACM Digital Library, Google Scholar, IEEE Xplore, ScienceDirect, and SpringerLink. The primacy search term was “web service provisioning”. Twenty two models were identified [11-32]. Out of these twenty two models, six [11-16] were using data mining techniques and the remaining sixteen [17-32] were using MCDA. Moreover, out of sixteen MCDA based models, nine [22-30] were used to perform ranking and the rest [17-21, 31, 32] were used to optimize resources in the cloud. The literature review of nine
MCDA based models used by online broker to generate ranking is presented below.
In [22] authors proposes a hybrid decision-making model based on affinity diagram, fuzzy Analytic Hierarchy Process (F-AHP) and fuzzy Technique for Order Preference by Similarity to an Ideal Solution (F-TOPSIS) to evaluate cloud solutions to host Big Data projects. In the first stage of this model, identification of evaluation criteria is performed by a decision-making committee using Affinity Diagram. Due to the varied importance of the selected criteria, F-AHP process is used in the second stage to assign weights for each criterion. F-TOPSIS in the third stage employ these weighted criteria as inputs to evaluate and measure the performance of each alternative (cloud solutions). In the last step, a sensitivity analysis is performed to evaluate the impact of criteria weights on the final rankings of alternatives.
In [23] authors discusses evaluation of Trade-offs based Methodology for Adoption of cloud based Services (TrAdeCIS) using TOPSIS and Analytic Network Process (ANP). They argue that the decision to use such services is based upon criteria which can be mutually interdependent and conflicting and hence, a trade-offs-based methodology is needed to make such decisions. TrAdeCIS is the first methodology that supports an automated and quantified trade-offs based decision making for selection of a best cloud based service. In [29] authors propose a model which uses Fuzzy TOPSIS for web service selection. Based on the fact that web service selection is highly influenced by customer preferences, a simulated environment represented by 8x8 LED matrices on a circuit board was used to demonstrate the selection.
In [24] authors compares behavior and quality of TOPSIS and VIKOR based multi-objective decision methods with the Pareto optimality solutions. In [25] authors propose a Service Measurement Index Cloud framework (SMICloud). It provides a holistic view of criteria to benchmark service providers. It is divided into seven categories that include accountability, agility, assurance, financial, performance, security and privacy, and usability. Each of these categories is further subdivided into three or more mid-level criteria. For example, mid-level criteria assigned to agility include, beside others, capacity and elasticity. Then within each mid-level criterion, a set of low-level criteria are defined for data collection. For example, low-level criteria assigned to capacity include, beside others, CPU and memory. For each criterion in these levels, relative weights are assigned using AHP to generate relative ranking.
In [26] authors propose consumer centered cloud service selection model. They argue that, QoS criteria in the cloud are solely related to service provider. However, as cloud service spread all over the internet, part of them (e.g. availability and reliability) are largely influenced by a network which eventually impact customers. For this reason, selection of a cloud service must be subjected to customer’s interest. In this regards, AHP is used for ranking of service providers based on customer preferences.
In [27] authors propose fuzzy based AHP model for cloud service selection. They argue that, it is often difficult for a customer to exactly quantify his or her opinion as a number. However, if expressed as an interval then it will be better description of an opinion. In this regard, proposed model combined interval valued fuzzy sets (IVFs) with AHP to generate ranking.
In [28] authors propose fuzzy based TOPSIS model for cloud service selection. They argue that, QoS based cloud service selection can be treated as a multi-criteria group decision making problem when selection is performed by a group of experts with different experiences and skills. In this regard, proposed model uses triangular fuzzy numbers to represent opinions of experts. Afterwards, these fuzzy numbers are transformed into crisp numbers by using graded mean integration representation method. The canonical representation of addition and multiplication operations on triangular fuzzy numbers is then used to obtain the positive ideal solution (PIS) and the negative ideal solution (NIS). Due to the use of crisp number rather than triangular fuzzy number for canonical representation, the complicated calculations involving triangular fuzzy numbers is avoided. Afterwards, Minkowski distance function is applied to measure the distance of each alternative (cloud service) from the PIS and the NIS. The shortest distance from the PIS and the farthest distance from the NIS is selected as a best alternative.
In [30] authors propose a cloud service selection model that uses subjective assessment of customers and objective performance assessment conducted by a trusted third party. The model is composed of four services: (i) Cloud Selection Service – it chooses cloud services which meets all the objective requirements of a customer; (ii) Benchmark Testing Service – this service is provided by a trusted third party which designs a variety of testing scenarios to conduct objective performance analysis; (iii) User Feedback Management Service – it is used to collect and manage the feedback from the customers who are already consuming selected cloud services. For every performance aspect of a cloud service, a customer gives his/her subjective assessment (e.g., “good”, “fair” and “poor”); and (iv) Assessment Aggregation Service – it is responsible for accumulating assessments (subjective and objective) and perform benchmarking using fuzzy simple additive weighting system to generate ranking.
TABLE I. COMMONLY USED MCDA METHODS BY ONLINE BROKERS
MCDA Objective Reference
AHP Pair-wise comparison of elements structured in a hierarchal relationship. [22] [25] [26] [27]
TOPSIS
Criteria based selection of an alternative that is closest to the ideal solution.
[22] [23] [24] [28] [29]
Based on above review, table 1 lists most commonly used MCDA methods used by online brokers to generate ranking of service providers in the cloud. They are: AHP and TOPSIS. The prime objective of AHP is to decompose the decision problem into a hierarchical structure of goal, criteria and alternatives. It then evaluates them in a series of pair-wise comparisons that uses priorities provided by the decision maker [26]. TOPSIS on the other hand, compares a set of alternatives by using weights for each criterion provided by the decision maker and afterwards, calculate the geometric distance between each alternative and the expected ideal alternative [28].
It is evident that AHP and TOPSIS use distinct approaches to evaluate alternatives. However, at the very outset, both of them equally rely upon subjective judgments of the decision maker to ensure that all relevant criteria are included in the process. Thus it can be concluded that MCDA based online brokers that are using AHP or TOPSIS overlook misspecification for criterion owning to subjective judgments of the decision maker. Hence, the conclusion acknowledges a need to develop a model to deal with such misspecification owing to insufficient knowledge of a customer (decision maker) in the cloud.
III. PROPOSED MODEL
This research proposes a model called as self-regulated MCDA, which resolves misspecification for criterion owning to its statistical relevance that is estimated using notion of communality. Communality belongs to broader concept of factor analysis from the domain of unsupervised machine learning [33, 34]. Numerically, it is a measure of a relationship between a criterion and a goal [33]. Its high value indicates strong correlation between the two and hence, endorses the criterion as relevant with reference to a goal. In the example of Moogle, except for the additional criterion of storage space, all other criteria have strong correlation with QoS and hence, relevant to generate QoS based ranking of service providers.
Communality is estimated by using structural equation modeling (SEM). SEM is a statistical approach used to examine association between a latent variable (or goal) and an observed variables (or criteria) [33, 34]. Latent variable is a theoretical construct that is inferred from the variables that are observed in the field. In the example of Moogle, QoS is a latent variable since it represents intent of a customer and is inferred from the variables (availability, response time, price, speed, ease of use, technical support, and customer service) that are observed during the test or survey.
In SEM, the most popular and frequently used methods to estimate communality are Principal Factor Analysis (PFA) and Maximum Likelihood (ML) [33, 34]. Considering that ML estimation assumes normal distribution of observed variables and this research is dealing with observed variables without making any prior assumption, PFA was used to estimate communality.
In PFA, the relationship vector ⋀ = (λ λ … λ ) ′
between a latent variable F and observed variables vector
Y = (y y … y )′ is expressed in a variance-covariance matrix notation as:
cov(Y) = cov(⋀F) + ψ
ψ is a vector that represent uniqueness of observed variables not shared with the latent variable. By using covariance property cov(AZ) = A cov(Z) A ,cov(⋀F) in the right hand side of above equation can be expanded to
⋀ cov(F) ⋀ + ψ. Moreover, since F being an identity matrix has cov(F) = 1, ⋀ cov(F) ⋀ can be further reduced to:
⋀⋀ + ψ and the equation becomes:
cov(Y) = ⋀⋀ + ψ
If Y is not commensurate i.e. observed variables are measured in different units and scales, then standardized Y is used. After standardization, covariance becomes correlation
(r) and subsequently, covariance matrix cov(Y) becomes a correlation matrix R.
R = ⋀⋀ + ψ
we can expand above equation as:
1 ⋯ r
⋮ ⋱ ⋮
r ⋯ 1 =
λ λ ⋮ λ
[λ λ … λ ] +
ψ ⋯ 0
⋮ ⋱ ⋮
0 ⋯ ψ
Bringing ψ to left hand side and preforming subtraction,
1 − ψ ⋯ r
⋮ ⋱ ⋮
r ⋯ 1 − ψ =
λ λ ⋮ λ
[λ λ … λ ]
Subtracting unique variance from the one (1 − ψ ) will yield shared variance of an observed variable for the latent variable, which is equal to square of λ [33, 34]. Respectively, (λ ) can replace 1 − ψ and above equation will become:
(λ ) ⋯ r
⋮ ⋱ ⋮
r ⋯ (λ ) =
λ λ ⋮ λ
[λ λ … λ ] (1)
where (left hand side),
(λ ) ⋯ r
⋮ ⋱ ⋮
r ⋯ (λ ) = R − ψ (2)
Accordingly, in a reduce form, equation 1 becomes:
R − ψ = ⋀⋀ (3)
R − ψ is a ‘reduced correlation matrix’ with (λ ) on the diagonal. If R − ψ is positive semi-definite matrix i.e. it satisfy R − ψ = (R − ψ) , then this implies that left hand side in equation 3 is symmetric and has a following spectral decomposition.
R − ψ = UDU (4)
of R − ψ and D is the diagonal matrix of corresponding eigenvalues Θ Θ … Θ .
D = Θ⋮ ⋯⋱ 0⋮
0 ⋯ Θ
The important property of a positive semi-definite matrix is that its eigenvalues are always positive or null. Hence,
Θ ≥ 0 and consequently, D can be factored into D/ D/
and right hand side in equation 4 becomes:
R − ψ = UD D U (5)
Equation 5 is in the form of equation 3 and accordingly, following can be deduced for ⋀.
⋀ = UD (6)
In an expanded form, right hand side in above equation can be written as:
⋀ =
u ⋯ u
⋮ ⋱ ⋮
u ⋯ u ×
√Θ ⋯ 0
⋮ ⋱ ⋮
0 ⋯ √Θ
It can be observed that ⋀ (or UD/ ) is [n × n] matrix,
however, for single latent variable F, ⋀ must be [n × 1]
matrix representing ⋀ = (λ λ … λ ) ′ . Hence, from the right hand side of above equation we take the largest eigenvalue Θ
and corresponding eigenvector U for calculation of Λ i.e.,
Λ = U Θ. The squared value of Λ is called communality ( ) and can be written as:
= =
( ) ( ) ⋮ ( )
(7)
In the equation, eigenvector contains estimated unit-scaled loadings or weights ( ) that are associated with each observed variable. The eigenvalue Θ is a shared variance among all the observed variables that represent the latent variable. Communality is obtained by multiplying squared value of with Θ, which represents the relationship of latent variable with observed variable. The strong correlation between the two is identified by using the condition > ω. Where, ω is a controlled variables (or constant) and its value is assigned by a substantive specialist in the field or a statistical technique [33]. The value of ω lies between 0 and 1 and is used for identification of relevant criterion. For example, ω = 0.60 ensures that a criterion which contributes less than 60% to the goal is not selected for further processing. In the example of Moogle, storage space was one such criterion. Accordingly, equation 7 can be rewritten as:
= ( ) ( ) ⋮ ( )
> ω (8)
IV. EVALUATION AND RESULTS
A two-stage procedure was implemented in order to evaluate self-regulated MCDA in an online cloud environment. In stage one; relevance of criterion was assessed by using equation 8. In stage two, a comparative analysis was performed between two types of MCDA based online brokers. Only one type was equipped with self-regulated MCDA. The two datasets used during these stages comprised of “feedback from customers” and “feedback from servers” on QoS of cloud storage providers. The first dataset i.e., feedback from customers, was compiled using leading review websites such as Cloud Hosting Reviews, Best Cloud Computing Providers, and Cloud Storage Reviews and Ratings. In this dataset, the feedbacks1 were provided for the following QoS based criteria (or observed variables): Availability (AV), Response Time (RT), Price (PR), Speed (SP), Storage Space (SS), Ease of Use (EU), Technical Support (TS), and Customer Services (CS). Each of these criteria was assessed on the following ordinal scale: excellent (1), very good (2), good (3), satisfactory (4), and sufficient (5). In total, the dataset contained 390 feedbacks for seven cloud storage providers that included: Carbonite, Dropbox, iBackup, JustCloud, SOS Online Backup, SugarSync, and Zip Cloud. The latent variable (or the goal) was QoS. The second dataset i.e., feedback from servers, was generated from cloud brokerage architecture that was emulated using high performance computing (HPC) cluster at University of Luxembourg (HPC @ Uni.lu). More specifically, a virtual machine in HPC cluster together with docker (a software container platform) was used to emulate three cloud storage providers running NoSQL databases [35]: Redis, MongoDB, and Memcached. Each of these service providers were operating under a workload comprising of operations ranging from 0 to 10,000, records ranging from 0 to 10,000, and threads ranging from 0 to 100.
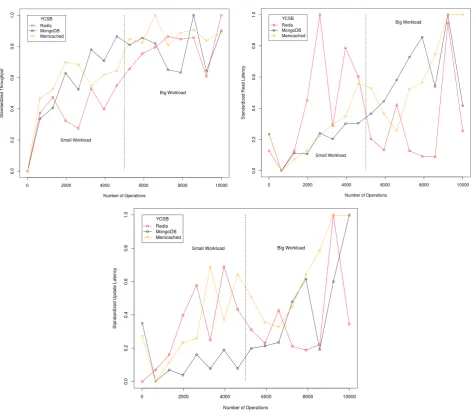
Yahoo Cloud Service Benchmark (YCSB) [36] was deployed at the customer end i.e., second virtual machine in HPC cluster, to continuously monitor QoS of these storage providers in terms of throughput (operations per second), read latency (time to read data from database), and update latency (time to update data in database). For eight simulation runs with small workload (number of operations < 5000) and big workload (number of operations > 5000), Figure 1 depicts descriptive statistics of three storage providers in terms of standardized values of throughput, read latency, and update latency. Based on these statistics, none of the storage provider can be classified “more superior” as compared to others. The data analysis, scripting, and visualizations tools used during the two-stage procedure include: Python [37, 38], R/R Studio [39], Arena Rockwell Input analyzer [40, 41], STATA – Data Analysis and Statistical Software [42-44], IBM Statistical Analysis Software Package (SPSS) [45, 46], and Microsoft Excel.
Fig. 1. Descriptive Statitics of Server Feebacks
A. Assessing Relvance of a Criterion
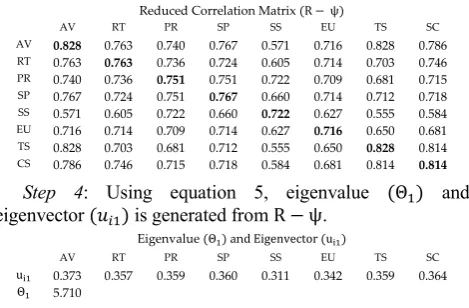
This section presents following five steps to assess relevance of a criterion in the dataset containing customer feedbacks. Step 1: the correlation matrix (R) is generated for QoS based criteria using the dataset. As these criteria are assessed on ordinal scale, the generated matrix contains polychronic correlations that are used to measure associations between ordinal variables [42-44].
Polychoric Correlation Matrix
AV RT PR SP SS EU TS SC
AV 1 0.763 0.740 0.767 0.571 0.716 0.828 0.786
RT 0.763 1 0.736 0.724 0.605 0.714 0.703 0.746
PR 0.740 0.736 1 0.751 0.722 0.709 0.681 0.715
SP 0.767 0.724 0.751 1 0.660 0.714 0.712 0.718
SS 0.571 0.605 0.722 0.660 1 0.627 0.555 0.584
EU 0.716 0.714 0.709 0.714 0.627 1 0.650 0.681
TS 0.828 0.703 0.681 0.712 0.555 0.650 1 0.814
CS 0.786 0.746 0.715 0.718 0.584 0.681 0.814 1
Step 2: In order to generate reduced correlation matrix, initial estimates for (λ ) were required, see equation 2. In
[33] author lists several approximation techniques, among
which the most commonly used are “average correlation of a variable with other variables” and “highest correlation of a variable”. In this research we have used highest correlation of a variable as an initial estimate for (λ ) .
Highest Correlation as Initial Estimates of (λ )
AV RT PR SP SS EU TS SC
0.828 0.763 0.751 0.767 0.722 0.716 0.828 0.814
Reduced Correlation Matrix (R − ψ)
AV RT PR SP SS EU TS SC
AV 0.828 0.763 0.740 0.767 0.571 0.716 0.828 0.786
RT 0.763 0.763 0.736 0.724 0.605 0.714 0.703 0.746
PR 0.740 0.736 0.751 0.751 0.722 0.709 0.681 0.715
SP 0.767 0.724 0.751 0.767 0.660 0.714 0.712 0.718
SS 0.571 0.605 0.722 0.660 0.722 0.627 0.555 0.584
EU 0.716 0.714 0.709 0.714 0.627 0.716 0.650 0.681
TS 0.828 0.703 0.681 0.712 0.555 0.650 0.828 0.814
CS 0.786 0.746 0.715 0.718 0.584 0.681 0.814 0.814
Step 4: Using equation 5, eigenvalue (Θ ) and eigenvector ( ) is generated from R − ψ.
Eigenvalue (Θ ) and Eigenvector (u )
AV RT PR SP SS EU TS SC
u 0.373 0.357 0.359 0.360 0.311 0.342 0.359 0.364
Θ 5.710
Step 5: Using equations 6 and 7, ⋀ = (λ , λ , … , λ )
and ς are calculated, respectively. Using the opinion of substantive specialist, the value of ω was set to 0.60 (60%) for the dataset with feedback from customers and was set to 0.30 (30%) for the dataset with feedback from servers. Afterwards, based on equation 8, criterion SS (0.552 < 0.60) was omitted from further processing and termed as irrelevant to generate QoS based ranking of storage providers.
Finding λ and
AV RT PR SP SS EU TS SC
λ 0.890 0.852 0.858 0.860 0.743 0.817 0.857 0.869
ς 0.793 0.727 0.736 0.740 0.552 0.669 0.735 0.755
Finding λ and without SS
AV RT PR SP EU TS SC
λ 0.905 0.854 0.841 0.853 0.807 0.856 0.872
ς 0.819 0.729 0.707 0.727 0.651 0.734 0.760
Above mentioned steps were also used to calculate relevance of each criterion in the dataset with feedback from servers. For throughput, ς was calculated to be 0.379, whereas, for read latency and update latency it was 0.463 and 0.338. As none of criterion has shared variance less than 30% and hence, endorses: throughput, read latency, and updates latency; as relevant to generate QoS based ranking of storage providers.
B. Comparative Analysis
In this stage, a comparative analysis is performed between MCDA based online Broker that is using self-regulated MCDA and the one that is not. More specifically, it’s a comparison between AHP (identified in section II) and AHP based upon proposed model i.e. Self-regulated AHP.
For dataset with feedback from customers, the prior i.e. AHP, performs series of pair-wise comparisons for eight QoS based criteria using priorities provided by the customer (decision maker). The later i.e. Self-regulated AHP, uses seven QoS based criteria (excluding SS) with priorities assigned based on the communalitythat was calculated in preceding section. For example, Availability with communality of 0.819 was given highest priority (followed by Customer Service, Technical Support, Response Time, Speed, Price, and Ease of Use). Based on the fact that Self-regulated AHP in this dataset was using “relevant criteria”
and “priorities assigned objectively”, it was expected that it will produce better results as compared to AHP.
For dataset with feedback from servers, AHP performs series of pair-wise comparisons for three QoS based criteria using priorities provided by the customer (experts at HPC @ Uni.lu). As mentioned, there was no omission of criterion based on the condition ς > ω, Self-regulated AHP uses the same three QoS based criteria with priorities assigned based on the communality. However, based on the fact that Self-regulated AHP in this dataset was only using “priorities assigned objectively”, it was expected that it might not produce better results as compared to AHP. This is true when priorities assigned by the customer in AHP are not substantially different from priorities in Self-regulated AHP.
A similar setting was also applied for comparison between TOPSIS (identified in section II) and Self-regulated TOPSIS. The motivation for performing two pairs of comparative assessment (AHP v. Self-regulated AHP and TOPSIS v. Self-regulated TOPSIS) for each dataset was to produce results for both certain and uncertain online cloud environment. High degree of randomness was induced by using random probability distribution to simulate uncertainty in the datasets for TOPSIS v. Self-regulated TOPSIS.
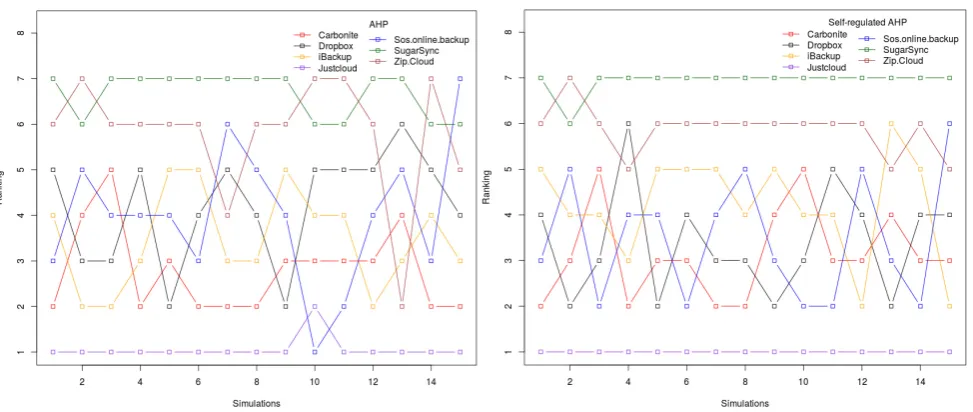
Figure 2 presents results for comparative assessment of AHP v. Self-regulated AHP for dataset with feedback from customers. Following observations show that Self-regulated AHP produces more explicit ranking of storage providers as compared to AHP.
• Considering all simulations in both images (15+15=30), it can be observed that Just Cloud is commonly ranked 1st. However, as per simulation 10 in AHP graph, assigned rank for Just Cloud is 2nd, whereas, in corresponding simulations in Self-regulated AHP graph, the rank is 1st.
• Considering all simulations in both images, it can be observed that Sos.online.backup is commonly ranked in the range of 2nd to 6th. However, as per simulation run 10 and 15 in AHP graph, assigned ranks for Sos.online.backup are 1st and 7th, whereas, in corresponding simulations in Self-regulated AHP graph, the ranks are 2nd and 6th.
• Considering all simulations in both images, it can be observed that Zip Cloud is commonly ranked in the range of 5th to 7th. However, as per simulations 7 and 13 in AHP graph, assigned ranks for Zip Cloud are 4th and 2nd, whereas, in corresponding simulations in Self-regulated AHP graph, the ranks are 6th and 5th. • Considering all simulations in both images, it can be
Fig. 2. Comparative Assessment AHP v. Self-regulated AHP
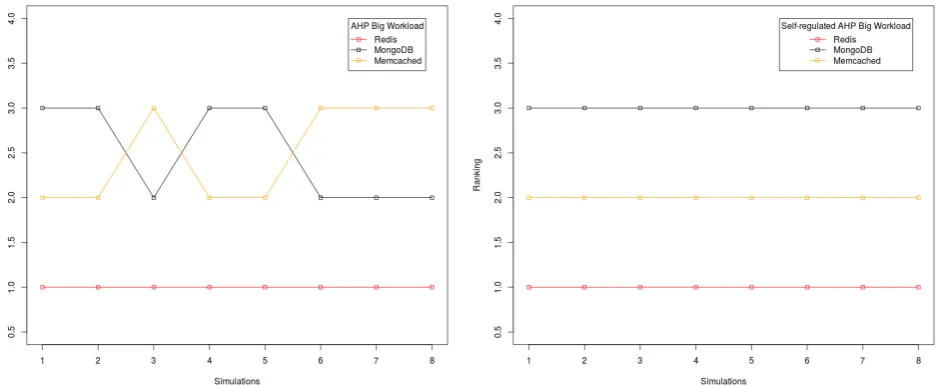
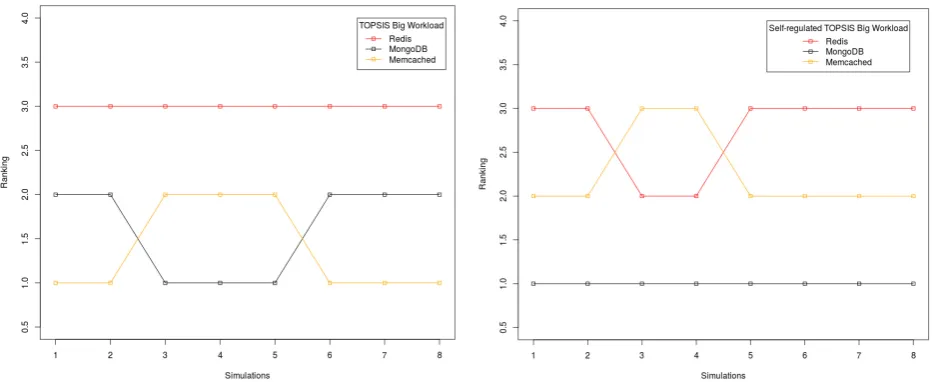
Figure 3 and 4 presents’ results for comparative assessment of AHP v. Self-regulated AHP for dataset with feedback from servers. The assessment was performed for two workloads (small load and big load, see figure 1). For big load, the priorities assigned by the customer (experts at HPC @ Uni.lu) in AHP (Update Latency was given highest priority followed by Read Latency and Throughput) were
substantially different from priorities in Self-regulated AHP (Read Latency was given highest priority followed by Throughput and Update Latency). Hence, Self-regulated AHP produced better results as compared to AHP. However, for small load, the priorities were not substantially different and therefore, the results of Self-regulated AHP were same as AHP.
Fig. 4. Comparative Assessment AHP (big workload) v. Self-regulated AHP (big workload)
Fig. 5. Comparative Assessment TOPSIS v. Self-regulated TOPSIS
Figure 5 presents results for comparative assessment of TOPSIS v. Self-regulated TOPSIS for dataset with feedback from customers. Both the graphs in the figure clearly show effects of induced uncertainly and respectively, every storage provider is ranked in the range of 1st to 7th. However for Sos.online.backup and Dropbox the range has reduced to 2nd to 7th and 1st to 6th respectively, in Self-regulated TOPSIS graph. This certainly highlights the limited ability of proposed model to produce better results even in presence of uncertainty. Figure 6 and 7 presents’ results for comparative assessment of TOPSIS v. Self-regulated TOPSIS for dataset with feedback from servers. The assessment was performed
Fig. 6. Comparative Assessment TOPSIS (small workload) v. Self-regulated TOPSIS (small workload)
Fig. 7. Comparative Assessment TOPSIS (big workload) v. Self-regulated TOPSIS (big workload)
V. CONCLUSION AND FUTURE RESEARCH
This research proposes self-regulated MCDA for online broker to optimize ranking of service providers in the cloud. In this regards, the research has successfully integrated notion of unsupervised machine learning and multi-criteria decision analysis. A two-stage procedure was implemented in order to evaluate self-regulated MCDA in an online cloud environment. Two quality-of-service (QoS) based datasets were used during the evaluation. The first dataset i.e., feedback from customers, was compiled using leading review websites such as Cloud Hosting Reviews, Best Cloud Computing Providers, and Cloud Storage Reviews and Ratings. The second dataset i.e., feedback from servers, was generated from cloud brokerage architecture that was emulated using high performance computing (HPC) cluster at University of Luxembourg (HPC @ Uni.lu).
ACKNOWLEDGMENT
Research presented in this paper is conducted as a PhD research at the University of Luxembourg, within the Erasmus Mundus Joint International Doctoral (Ph.D.) program in Law, Science and Technology.
REFERENCES
[1] J. Figueira, S. Greco, and M. Ehrgott, Multiple criteria decision analysis: state of the art surveys vol. 78: Springer Science & Business Media, 2005.
[2] C. A. B. e Costa, Readings in multiple criteria decision aid: Springer Science & Business Media, 2012.
[3] J. Branke, K. Deb, and K. Miettinen, Multiobjective optimization: Interactive and evolutionary approaches vol. 5252: Springer Science & Business Media, 2008.
[4] C. Macharis and A. Bernardini, "Reviewing the use of Multi-Criteria Decision Analysis for the evaluation of transport projects: Time for a multi-actor approach," Transport Policy, vol. 37, pp. 177-186, 2015.
[5] I. Ivlev, J. Vacek, and P. Kneppo, "Multi-criteria decision analysis for supporting the selection of medical devices under uncertainty," European Journal of Operational Research, vol. 247, pp. 216-228, 2015.
[6] H. Broekhuizen, C. G. Groothuis-Oudshoorn, J. A. van Til, J. M. Hummel, and M. J. IJzerman, "A Review and Classification of Approaches for Dealing with Uncertainty in Multi-Criteria Decision Analysis for Healthcare Decisions," PharmacoEconomics, vol. 33, pp. 445-455, 2015.
[7] N. Fenton and M. Neil, "Making decisions: using Bayesian nets and MCDA," Knowledge-Based Systems, vol. 14, pp. 307-325, 2001.
[8] V. Belton and T. Stewart, Multiple criteria decision analysis: an integrated approach: Springer Science & Business Media, 2002. [9] A. Ishizaka and P. Nemery, Multi-criteria decision analysis:
methods and software: John Wiley & Sons, 2013.
[10] J. Bilcke, P. Beutels, M. Brisson, and M. Jit, "Accounting for methodological, structural, and parameter uncertainty in decision-analytic models a practical guide," Medical Decision Making, vol. 31, pp. 675-692, 2011.
[11] A. Li, X. Yang, S. Kandula, and M. Zhang, "CloudCmp: comparing public cloud providers," in Proceedings of the 10th ACM SIGCOMM conference on Internet measurement, 2010, pp. 1-14.
[12] S. Sundareswaran, A. Squicciarini, and D. Lin, "A Brokerage-Based Approach for Cloud Service Selection," in Cloud Computing (CLOUD), 2012 IEEE 5th International Conference on, 2012, pp. 558-565.
[13] S. Gong and K. M. Sim, "CB-Cloudle: A Centroid-based Cloud Service Search Engine," in Proceedings of the International MultiConference of Engineers and Computer Scientists, 2014. [14] J. Kang and K. M. Sim, "Cloudle: an ontology-enhanced cloud
service search engine," in Web Information Systems Engineering–WISE 2010 Workshops, 2011, pp. 416-427. [15] X. Wang, J. Cao, and Y. Xiang, "Dynamic cloud service
selection using an adaptive learning mechanism in multi-cloud computing," Journal of Systems and Software, vol. 100, pp. 195-210, 2015.
[16] S. Khaddaj, "Cloud computing: service provisioning and user requirements," in Distributed Computing and Applications to Business, Engineering & Science (DCABES), 2012 11th International Symposium on, 2012, pp. 191-195.
[17] D. Ergu, G. Kou, Y. Peng, Y. Shi, and Y. Shi, "The analytic hierarchy process: task scheduling and resource allocation in cloud computing environment," The Journal of Supercomputing, vol. 64, pp. 835-848, 2013.
[18] C.-H. Su, G.-H. Tzeng, and H.-L. Tseng, "Improving cloud computing service in fuzzy environment—combining fuzzy DANP and fuzzy VIKOR with a new hybrid FMCDM model,"
in Fuzzy Theory and it's Applications (iFUZZY), 2012 International Conference on, 2012, pp. 30-35.
[19] B. Y. Ooi, H. Y. Chan, and Y.-N. Cheah, "Resource selection using fuzzy logic for dynamic service placement and replication," in TENCON 2011-2011 IEEE Region 10 Conference, 2011, pp. 128-132.
[20] J. Rao, Y. Wei, J. Gong, and C.-Z. Xu, "DynaQoS: model-free self-tuning fuzzy control of virtualized resources for QoS provisioning," in Quality of Service (IWQoS), 2011 IEEE 19th International Workshop on, 2011, pp. 1-9.
[21] Y. O. Yazir, C. Matthews, R. Farahbod, S. Neville, A. Guitouni, S. Ganti, et al., "Dynamic resource allocation in computing clouds using distributed multiple criteria decision analysis," in Cloud Computing (CLOUD), 2010 IEEE 3rd International Conference on, 2010, pp. 91-98.
[22] O. Boutkhoum, M. Hanine, T. Agouti, and A. Tikniouine, "A decision-making approach based on fuzzy AHP-TOPSIS methodology for selecting the appropriate cloud solution to manage big data projects," International Journal of System Assurance Engineering and Management, pp. 1-17, 2017. [23] R. Garg, M. Heimgartner, and B. Stiller, "Decision Support
System for Adoption of Cloud-based Services," 2016.
[24] L. H. Nunes, J. C. Estrella, C. Perera, S. Reiff‐Marganiec, and A. C. Botazzo Delbem, "Multi‐criteria IoT resource discovery: a comparative analysis," Software: Practice and Experience, 2016.
[25] S. K. Garg, S. Versteeg, and R. Buyya, "A framework for ranking of cloud computing services," Future Generation Computer Systems, vol. 29, pp. 1012-1023, 6// 2013.
[26] M. Sun, T. Zang, X. Xu, and R. Wang, "Consumer-centered cloud services selection using AHP," in Service Sciences (ICSS), 2013 International Conference on, 2013, pp. 1-6. [27] C.-T. Chen and K.-H. Lin, "A decision-making method based on
interval-valued fuzzy sets for cloud service evaluation," in New Trends in Information Science and Service Science (NISS), 2010 4th International Conference on, 2010, pp. 559-564. [28] C.-C. Lo, D.-Y. Chen, C.-F. Tsai, and K.-M. Chao, "Service
selection based on fuzzy TOPSIS method," in Advanced Information Networking and Applications Workshops (WAINA), 2010 IEEE 24th International Conference on, 2010, pp. 367-372.
[29] D.-Y. Cheng, K.-M. Chao, C.-C. Lo, and C.-F. Tsai, "A user centric service-oriented modeling approach," World Wide Web, vol. 14, pp. 431-459, 2011.
[30] L. Qu, Y. Wang, and M. Orgun, "Cloud service selection based on the aggregation of user feedback and quantitative performance assessment," in Services Computing (SCC), 2013 IEEE International Conference on, 2013, pp. 152-159.
[31] H. Wu, Q. Wang, and K. Wolter, "Methods of cloud-path selection for offloading in mobile cloud computing systems," in Cloud Computing Technology and Science (CloudCom), 2012 IEEE 4th International Conference on, 2012, pp. 443-448. [32] P. Gulia and S. Sood, "Automatic Selection and Ranking of
Cloud Providers using Service Level Agreements," International Journal of Computer Applications, vol. 72, 2013.
[33] R. J. Rummel, Applied factor analysis: Northwestern University Press, 1988.
[34] A. C. Rencher, Methods of multivariate analysis vol. 492: John Wiley & Sons, 2003.
[35] J. Han, E. Haihong, G. Le, and J. Du, "Survey on NoSQL database," in Pervasive computing and applications (ICPCA), 2011 6th international conference on, 2011, pp. 363-366. [36] B. F. Cooper, A. Silberstein, E. Tam, R. Ramakrishnan, and R.
Sears, "Benchmarking cloud serving systems with YCSB," in Proceedings of the 1st ACM symposium on Cloud computing, 2010, pp. 143-154.
[37] M. Lutz and M. Lutz, Programming python vol. 8: O'Reilly, 1996.
[39] J. Verzani, Using R for introductory statistics: CRC Press, 2014. [40] B. Neubauer, "Introduction of process modeling using rockwell
arena," Journal of Computing Sciences in Colleges, vol. 24, pp. 164-169, 2008.
[41] J. A. Modi, "Simulation Modeling and Analysis with ARENA," ed: JSTOR, 2008.
[42] A. C. Cameron and P. K. Trivedi, Microeconometrics using stata vol. 2: Stata press College Station, TX, 2010.
[43] A. C. Acock, "Discovering structural equation modeling using Stata," Stata Press books, 2013.
[44] L. C. Hamilton, Statistics with Stata: version 12: Cengage Learning, 2012.
[45] S. B. Green and N. J. Salkind, Using SPSS for Windows and Macintosh: Analyzing and understanding data: Prentice Hall Press, 2010.