in a geothermal area in Kyushu, southwestern Japan, by analyzing long-term changes in the autocorrelation function (ACF) of seismic noise. The seismic velocity decrease appeared just after two major periods of earthquake activity began in June and October of 2007. In both instances, conditions returned to normal within a characteristic time period of 4 months. The observed size of the velocity changes agrees well with the magnitudes of the swarms. The lag-time dependence of ACF changes can be systematically explained by seismic velocity changes induced by uid inclusion in a small, localized area deep within the hypocenter region.
Key words:Earthquake swarm, temporal change, seismic interferometry.
1.
Introduction
The earth changes dynamically over time. Even in ex-tremely short time frames of less than 1 year, changes hap-pen in its crustal structure caused by dynamic phenom-ena such as earthquakes and volcanic eruptions. A tem-poral change in seismic velocity can be detected by ob-serving very slight differences in seismograms traveling through an affected area. In particular, a comparison of coda waves from the tail portion of the seismogram is use-ful since these are sensitive to small changes in seismic velocity (e.g., Sniederet al., 2002). Cross-correlation be-tween seismograms of repeating earthquakes (Poupinetet al., 1984; Yamawakiet al., 2004) and those of man-made arti cial earthquakes (Nishimura et al., 2005) has been a major method used to detect seismic velocity changes.
Seismic interferometry, a recently developed technique in seismology, enables researchers to extract Green’s func-tions of seismic waves between two points using correlation functions of ambient noise or coda waves (e.g., Campillo and Paul, 2003; Shapiro et al., 2005). Passive image in-terferometry (PII) uses this concept in detecting changes through the monitoring of auto- and/or cross-correlation of daily ambient noise (Sens-Sch¨onfelder and Wegler, 2006; Wegler and Sens-Sch¨onfelder, 2007), with successful appli-cations to coseismic changes (Ohmiet al., 2008; Brenguier
et al., 2008a; Wegleret al., 2009) and changes associated
∗Now at Center for Integrated Disaster Information Research,
Interfaculty Initiative in Information Studies, the University of Tokyo, Japan.
†Now at Earthquake Research Institute, the University of Tokyo, Japan.
Copyright cThe Society of Geomagnetism and Earth, Planetary and Space Sci-ences (SGEPSS); The Seismological Society of Japan; The Volcanological Society of Japan; The Geodetic Society of Japan; The Japanese Society for Planetary Sci-ences; TERRAPUB.
doi:10.5047/eps.2010.08.006
with volcanic eruptions (Brenguieret al., 2008b). There are two physical mechanisms that may explain postseismic changes in velocity; one is a relaxation of fault zone damage by healing (Vidale and Li, 2003); the other is a nonlinear change in very shallow subsurface regions caused by the in-cidence of strong motion (Sawazakiet al., 2006). For veloc-ity changes associated with large earthquakes, it is quite dif-cult to distinguish which mechanism is responsible. Here, using the PII technique, we found a temporal change in the seismic velocity that recurred in association with swarms of small earthquake activity.
2.
Earthquake Swarm Activity in NE Kyushu,
Japan
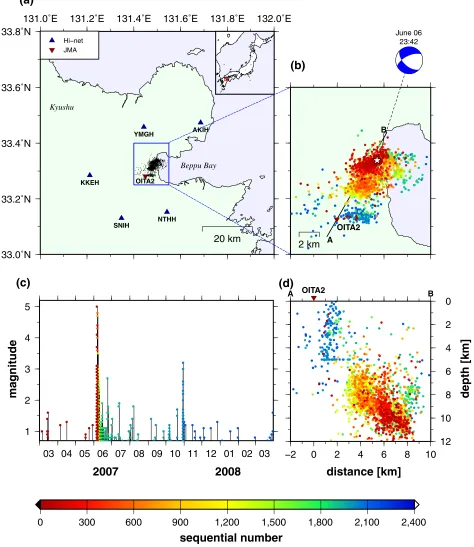
The earthquake swarms occurred in 2007 in a geother-mal area with many hot springs and geysers (Kamata, 1989) located in the northeastern part of Kyushu in southwest Japan. Figure 1 shows the hypocentral distribution and tem-poral variation of the earthquake swarm determined by the National Research Institute for Earth Science and Disaster Preventions high-sensitivity seismograph network (NIED Hi-net) (Okada et al., 2004). The swarm activity is di-vided into two main stages. The rst active period began on June 5, 2007 at a depth of around 10 km and continued for 3 weeks. The hypocenters migrated southwestward and toward the surface. The second swarm activity, which lasted for 2 days from October 30, 2007, was shallower than that of the rst. Maximum local magnitudes of the rst and sec-ond periods were 5.0 and 3.3, respectively. The dominant focal mechanisms were of the normal-fault type contain-ing strike-slip components (National Research Institute for Earth Science and Disaster Prevention, 2008; Fig. 1(b)), as re ected by the north/south-oriented extensional stress eld (Kamata, 1989) in this area. We did not observe any geode-tic change associated with the active periods on the Hi-net tiltmeter records.
686 T. MAEDAet al.: VELOCITY CHANGE IN GEOTHERMAL AREA
Fig. 1. (a) Study area index map. The red inverted triangle marks the location of a seismic station operated by the JMA (OITA2), while blue triangles show stations operated by NIED/Hi-net. A relocated epicenter distribution of earthquakes in the rectangular area is shown in (b). Symbol colors indicate the sequence of the earthquakes in this region, counting from June 1, 2007. The fault mechanism of the largest earthquake during the episode is shown above. (c) The bottom left panel shows a time-magnitude plot of the earthquake activity in the rectangular area. (d) Hypocenter depths along the A–B profile are shown in the bottom right panel.
3.
Temporal Changes in Noise Autocorrelation
We investigated temporal changes in the autocorrela-tion funcautocorrela-tion (ACF) of ambient noise at the nearest sta-tion (OITA2) operated by the Japan Meteorological Agency (JMA), from the epicenter region of the seismic swarm. An ACF for every 1-h period was calculated from a continu-ous record of the short-period velocity seismometer with
a sampling frequency of 100 Hz and natural frequency of 1 Hz. The data was first filtered for the 1–3-Hz bandwidth, then one-bit normalization (Shapiroet al., 2005) was ap-plied to minimize the effect of non-noise records, such as earthquakes. Averaging ACFs for 24 h gives a 1-day ACF, which is used to monitor temporal changes.
688 T. MAEDAet al.: VELOCITY CHANGE IN GEOTHERMAL AREA
Fig. 3. (a) Lag time and time dependence of the relative ACF phase delay. The delay is measured through cross-correlation between 1-day ACFs and the ensemble average ACF for the period of January to March 2007 with a time window of 2 s. If the maximum cross-correlation coefficient, which gives the phase delay, is less than 0.6, the delay estimate is excluded and shaded gray. (b) Average phase delay for lag times of 10–12 s (denoted by (A) in Fig. 3(a)). A circle bracketed by a one-standard deviation bar denotes the average delay for each date.
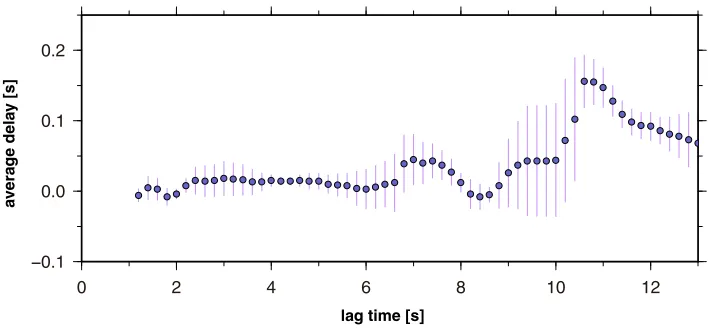
Fig. 4. Average ACF phase delay as a function of lag time for July 2007 obtained from cross-correlation analysis between 1-day ACFs and the ensemble average of ACFs for January to March 2007. The vertical bars extend to one standard deviation from the average.
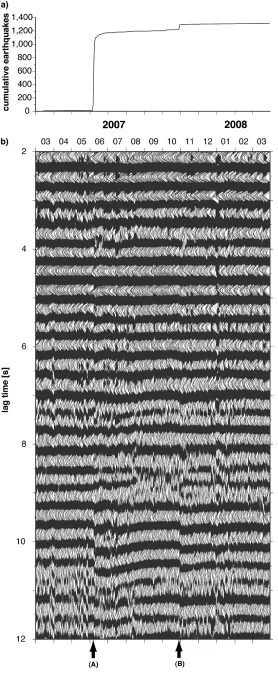
seismic noise traces from January 2007 to March 2008 for a lag-time window of 2–12 s, together with a cumulative number of earthquakes of which magnitude is larger than 0.7 in the rectangular area in Fig. 1(a). Estimated ACFs are generally stable and coherent; they have very little seasonal change. However, at large lag times, there are rapid phase changes in mid-June and at the end of October (shown by arrows A and B in Fig. 2(b)). Both phase changes gradually recover over time. Onset of the sudden change agrees well with the beginning of the active earthquake periods. We note that the ACF phase delay clearly appears at lag times of around 10 s. Since the PII technique assumes that the continuous seismic record mainly consists of noise com-ing from various directions, the estimation of noise ACF might be disturbed by the signal from swarm earthquakes; however, the change in ACF lasted longer than the periods of activity (Figs. 1(c), 2(b)). We applied the same signal processing at surrounding Hi-net stations (Fig. 1(a)). How-ever, we observed no systematic changes, even though they clearly recorded seismic waves from the earthquake swarm. The temporal change is also found in ACFs of horizontal components at OITA2 station, however, the change is most
significant in vertical component ACF.
Fig. 5. (a) Cross section showing hypocenters of earthquakes along line A–B in Fig. 1 with isochronal curves for backscatteredP-waves (dash-dotted line) andS-waves (solid line) from the OITA2 station at lag times of 6, 8, and 10 s. (b) A schematic illustration of the proposed model of the velocity change mechanism.
4.
Discussion
4.1 A cause of the temporal change
Such change in ACF can be explained not only by seismic velocity change but also by rainfalls (Sens-Sch¨onfelder and Wegler, 2006) or contamination by earthquake signal. Dur-ing the period when the earthquake swarm was very active (June, 2007 and October 30, 2007), the continuous record at the OITA2 mainly consisted of an earthquake signal; this is no longer a noise, which may violate the assumption of the seismic interferometry. However, the change in ACF lasted about 4 months, which is longer than the characteristic pe-riod of the earthquake swarm. We also manually con rmed that very few earthquake signals appeared in the continu-ous record at the frequency band of 1–3 Hz after 1 month from the rst activity, and after 2 days from the second ac-tivity, respectively. Although the rainy season in this area stretches from June to July, there is no such seasonal ef-fect in October that could cause such changes. In addition, we con rmed that no seasonal changes in ACFs occurred in other years of 2006 and 2008 at the same station. There-fore, this observation is most plausibly explained by seis-mic velocity decrease and recovery. The ACF of ambient noise can be interpreted as a sum of waves backscattered by random heterogeneity in the lithosphere with the wave source and receiver at the same location (Sens-Sch¨onfelder and Wegler, 2006) based on the single scattered theory (Aki and Chouet, 1975).
4.2 Localized velocity change
The fact that the ACF phase delay was detected only at OITA2 in a limited time range suggests that the veloc-ity change is localized near the OITA2 station. The tem-poral change should not be attributed to the incidence of strong motion because the earthquakes were too small to cause nonlinear effects in shallow sediments. If the veloc-ity change occurred very close to the station, the expected ACF delay would have shorter lag times than those actually
observed. From these observations, we propose that the ob-served ACF packet consists mainly of backscattered body or Rayleigh waves that pass through the hypocenter or epi-center area.
We observe signi cant phase delay of ACF continued for 1 month for the rst earthquake swarm. The maxi-mum observed ACF delay is 0.15 s at a lag time of 10 s (Fig. 3), resulting in a 1.5% velocity decrease. This deter-mination assumes that the seismic velocity decreased ho-mogeneously in a vast area that includes the seismic station and takes into account that ACF phase delay increases pro-portionally to lag time (Sens-Sch¨onfelder and Wegler, 2006; Brenguieret al., 2008a). However, it is noteworthy that the lag-dependent ACF phase delay for both active periods is localized at similar lag times of about 6–12 s, even though the two periods had different hypocenter locations. This also suggests that the location of the changes are localized in a common area.
4.3 Interpretations
690 T. MAEDAet al.: VELOCITY CHANGE IN GEOTHERMAL AREA
for the second activity that occurred at beneath the OITA2 station.
Assuming that the constituents of the ACF are backscat-tered body waves, we calculated the isochronal curves of the two-way travel time of backscattered waves from the station. A 1-D velocity structure (Matsubaraet al., 2008, gure 2) is used for the ray tracing. We note that the same velocity structure is used for the hypocenter location, so that the relative location between earthquakes and isochronal curves is reliable. Figure 5(a) shows the cross section of the isochronal curves of P andS waves which correspond to lag times of 6, 8, and 10 s along the pro le A–B in Fig. 1(a). The isochrones of scattered S waves samples around the hypocenter, while P waves samples deeper ex-tent of swarm. In the case ofP waves, the possible scatter-ing structure must be located farther from the station than the earthquake swarms hypocenters even for the shortest lag times where a temporal change appears (6 s).
It is noteworthy that isochrones of the P-wave for the lag time of 6 s and those of theS-wave of 10 s sample al-most same depth of just beneath of the hypocenter area. At these two lag times, we observe small and large temporal changes at these time windows. One possible interpretation is that the temporal changes occur at the common small area beneath the epicenter area at depths of ∼15 km, and the change is observed by backscatteredP-waves andS-waves (Fig. 5(b)). Since this area is a part of the Hohi volcanic area (Kamata, 1989), which has an extensional stress eld, it is possible that the velocity change is caused by the in-clusion of uid from deep within the hypocenter area. An intermittent uid supply may cause the earthquake swarm in association with the sudden velocity decrease. Fluid injec-tion up into shallower regions triggered the two earthquake swarms, dominated by normal-fault type earthquakes. The north/south-oriented extensional stress eld may promote crack opening, resulting in the uid injection. Compari-son of seismic activity and the magnitude of the ACF phase delay suggests that the volume of the rst uid injection was much larger than that of the second. Recovery of seis-mic velocity may be caused by diffusion of the uid within the crust. That this injection occurred deep within the crust may explain why no geodetic change was associated with the swarms.
5.
Concluding Remarks
Using the PII technique, we found reproducible tempo-ral changes in seismic velocity in association with seis-mic swarm in NE Kyushu, Japan. By monitoring daily changes in noise ACF, a systematic phase delay lasting about 4 months was observed for two major periods of earthquake activities. From the lag-time dependence of ACF, a localized seismic velocity decrease which relates to the swarm activity is proposed as a possible model that may explain the observation.
The PII technique enables researchers to monitor the crustal structure at a temporal resolution of 1 day with small computational effort, which is quite suitable for real time processing. Even with changes in the crustal struc-ture that are not geodetically detectable as in this study case, the noise correlation may contain information on the
dynamic process of crustal structure through seismic ve-locity change. Standing, long-range monitoring that pro-vides dense array data is becoming more available. The use of recently installed systems such as the Hi-net (Okada
et al., 2004) and USArray (Meltzer et al., 1999), can sup-port wider application of this new tool for the monitoring of crustal structure.
Acknowledgments. The authors would like to thank Tatsuhiko Hara, Ulrich Wegler, and an anonymous reviewer for their valu-able comments. We used continuous seismic traces recorded by the Japan Meteorological Agency at the OITA2 station. A part of this research was carried out as a part of the “Research Project for Crustal Activity based on Seismic Data” conducted by the National Research Institute for Earth Science and Disaster Prevention.
References
Aki, K. and B. Chouet, Origin of coda waves: Source, attenuation and scattering effects, J. Geophys. Res., 80, 3322–3342, doi:10. 1029/JB080i023p03322, 1975.
Brenguier, F., M. Campillo, C. Hadziioannou, N. M. Shapiro, R. M. Nadeau, and E. Larose, Postseismic relaxation along the San Andreas Fault at Park eld from continuous seismological observations,Science, 321, 1478–1481, doi:10.1126/science.1160943, 2008a.
Brenguier, F., N. M. Shapiro, M. Campillo, V. Ferrazzini, Z. Duputel, O. Coutant, and A. Nercessian, Towards forecasting volcanic eruptions using seismic noise,Nature Geosci.,1, 126–130, doi:10.1038/ngeo104, 2008b.
Campillo, M. and A. Paul, Long-range correlations in the diffuse seismic coda,Science,299, 547–549, doi:10.1126/science.1078551, 2003. Kamata, H., Volcanic and structural history of the Hohi volcanic
zone, central Kyushu, Japan, Bull. Volcanol., 51, 315–332, doi:10. 1007/BF01056894, 1989.
Matsubara, M., K. Obara, and K. Kasahara, Three-dimensional P-and S-wave velocity structures beneath the Japan Islands obtained by high-density seismic stations by seismic tomography,Tectonophysics,454, 86–103, doi:10.1016/j.tecto.2008.04.016, 2008.
Meltzer, A., R. Rudnick, P. Zeitler, A. Levander, G. Humphreys, K. Karlstrom, G. Ekstr¨om, R. Carlson, T. Dixon, M. Gurnis, P. Shearer, and R. van der Hilst, USArray initiative,GSA Today,9(11), 8–10, 1999. National Research Institute for Earth Science and Disaster Prevention, Seismic activity at the middle Ohita Prefecture, June, 2007,Rep. CCEP, 79, 605–607, 2008.
Nishimura, T., S. Tanaka, T. Yamawaki, H. Yamamoto, T. Sano, M. Sato, H. Nakahara, N. Uchida, S. Hori, and H. Sato, Temporal changes in seismic velocity of the crust around Iwate volcano, Japan, as inferred from analyses of repeated active seismic experiment data from 1998 to 2003,Earth Planets Space,57, 491–505, 2005.
Ohmi, S., K. Hirahara, H. Wada, and K. Ito, Temporal variations of crustal structure in the source region of the 2007 Noto Hanto Earthquake, central Japan, with passive image interferometry,Earth Planets Space, 60, 1069–1074, 2008.
Okada, Y., K. Kasahara, S. Hori, K. Obara, S. Sekiguchi, H. Fujiwara, and A. Yamamoto, Recent progress of seismic observation networks in Japan—Hi-net, F-net, K-NET and KiK-net,Earth Planets Space,56, xv–xxviii, 2004.
Poupinet, G., W. L. Ellsworth, and J. Frechet, Monitoring velocity varia-tions in the crust using earthquake doublets: An application to the Calav-eras fault, California,J. Geophys. Res.,89, 5719–5731, 1984. Sawazaki, K., H. Sato, H. Nakahara, and T. Nishimura, Temporal change
in site response caused by earthquake strong motion as revealed from coda spectral ratio measurement, Geophys. Res. Lett., 33, L21303, doi:10.1029/2006GL027938, 2006.
Sens-Sch¨onfelder, C. and U. Wegler, Passive image interferometry and seasonal variations of seismic velocities at Merapi Volcano, Indonesia,
Geophys. Res. Lett., 33, L21302, doi:10.1029/2006GL027797, 2006. Shapiro, N. M., M. Campillo, L. Stehly, and M. H. Ritzwoller,
High-resolution surface-wave tomography from ambient seismic noise, Sci-ence,307, 1615–1618, doi: 10.1126/science.1108339, 2005.