August 12, 2014
Bachelor Thesis
Liquid-liquid two phase flow and solvent
extraction in the squeezing regime with
on-chip separation of phases
Luuk van der Velden
Faculty of Science and Technology
Soft matter, Fluidics and Interfaces / Mesoscale Chemical Systems
Committee
Abstract
Acknowledgements
Despite the deviation of the set out schedule, it has been a pleasure to pursue finishing this project. Luckily I did not have to face the obstacles myself so I hereby thank the following persons:
? Roland Blanch Ojea for introducing me to microfluidics and helping me with the nerve-racking experiments
? Stefan Schlautmann for fabricating the microfluidic devices and explaining me var-ious details on fabrication
? Roald Tiggelaar for discussing and advice on spectroscopy within microfluidics
? Mattia Morassutto for discussions about several practical phenomena
? Hoon Suk Rho for his interesting explanations about his research and advice regard-ing my microscope photo analysis
? Johan de Rooi for providing me his source code for the baseline estimation
? Volkert van Steijn and Piotr Garstecki for supplying their data and contributing to the understanding of the flow regime
Contents
1 Introduction 1
1.1 Miniaturization of devices and processes . . . 1
1.2 Introduction to microfluidics . . . 2
1.2.1 Dimensionless quantities . . . 3
1.3 Description of the assignment . . . 5
1.3.1 Review of flow regime and droplet generation . . . 6
1.3.2 Review of phase separation . . . 7
1.3.3 Review of mass transfer . . . 8
1.4 Challenges . . . 10
2 Materials and Methods 11 2.1 Used chemicals and equipment . . . 11
2.1.1 Chips . . . 12
2.2 Lab-on-a-Chip platform for mass transfer experiments . . . 14
2.2.1 Droplet generation section . . . 14
2.2.2 Phase separation section . . . 16
2.3 Visualization . . . 18
2.3.1 Reflection Microscopy . . . 18
2.3.2 Image analysis . . . 19
2.3.3 Integrated spectroscopy . . . 20
3 Results 23 3.1 Flow regime . . . 23
3.2 Mass Transfer . . . 23
4 Discussion 31
4.1 Mass transfer . . . 31
4.1.1 Droplet geometry and mass transfer . . . 32
4.1.2 Mass transfer at the T-junction . . . 32
4.2 Phase separation . . . 33
4.3 Recommendations. . . 35
Bibliography . . . 35
Appendices 41 A Appendices to materials and methods 43 A.1 Chemicals . . . 43
A.2 Experimental procedures . . . 45
A.2 (i) Hydrophobizing the chips . . . 45
A.2 (ii) Characterization of flow regime in chip 1 . . . 45
A.2 (iii) Finding segmented flow regime in chip 2 . . . 46
A.2 (iv) Distribution coefficient . . . 46
List of Figures
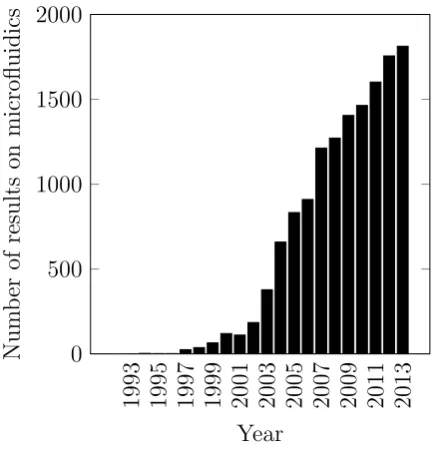
1.1 Trend of publications about microfluidics . . . 2
1.2 Segmented flow and stratified flow . . . 3
1.3 Lab-on-a-chip . . . 6
1.4 Segmented flow . . . 6
2.1 Topology of chip 1 . . . 13
2.2 Topology of chip 2, the primary chip. . . 14
2.3 Complete setup for the mass transfer experiments . . . 15
2.4 Phase separation section . . . 16
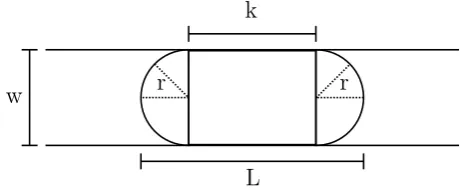
2.5 Simplified top view of a plug in a channel. . . 20
2.6 Geometric considerations to deduce specific interfacial area. From Van Steijn et al. (2010) [33] . . . 21
3.1 Mean Capillary number vs mean Reynolds number for chip 1 . . . 24
3.2 Flow regimes for water-toluene two-phase flow in chip 1. . . 25
3.3 Plug lengths during mass transfer measurements. . . 25
3.4 Mass Transfer kLa vs. total volumetric flow rate . . . 26
3.5 Mass Transfer kLa vs. residence time τ . . . 26
3.6 Mass Transfer kLa vs. reciprocal residence time 1/τ . . . 27
3.7 Extraction efficiency vs. residence time . . . 27
3.8 Plug lengths during mass transfer measurements, compared to literature 28 3.9 Phase separation efficiencyEφ during the mass transfer experiments . . . 29
3.10 Plug flow recording before and after the phase separation . . . 29
4.1 Mass transfer zones in segmented flow. The circulations depict the con-vection within the droplet and within the continuous phase . . . 32
Chapter 1
Introduction
1.1
Miniaturization of devices and processes
The past two decades are characterized by an unprecedented technological advancement which is unlike earlier developments deeply entangled in everyday life. Obviously, earlier developments in physics, chemistry and medicine have had a high impact on society, but in particular the transistor (1947) and subsequently the semiconductor integrated circuit (1958) are nowadays unequalled regarding their indispensability and omnipresence. The rise of the computer chip or integrated circuit as found in many of our everyday devices, has been enabled by the advancement in photolithography. Now it is this photolithogra-phy which for two decades enabled us to further miniaturize a variety of existing devices and processes, resulting in microtechnology from the 1990s and even to nanotechnology from the 2000s [1].
As is the case with integrated circuits, micro- and nanotechnology offer a means to realize several process steps on a single integrated device, hence limiting the system’s (dead) volume and the amount of required processing time. Also, the miniaturization of chemical analysis decreases the analytes sample consumption, increases the mixing rate and enhances the analysis speed, characteristics which rouse the quest for cheap portable analytical devices [2]. Integrated microfluidic systems are known as ‘Lab-on-a-Chip’ (LOC) or ‘micro total chemical analysis system’ (µTAS) [1].
as depicted by Figure 1.1. Still, in microfluidics care should be taken about simple scaling effects of quantities which can often be neglected in the equations for ‘common’ macroscopic flows. As Colin (2010) puts aptly, ‘miniaturization gives a predominant role to surface effects, to the detriment of volume effects’ [4]. It is these very surface effects which are the basis of both advantages of and the challenges to microfluidics.
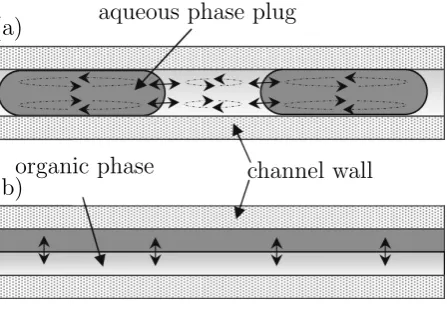
noted however, that the parabolic velocity profile results in an axial dispersion known as ‘Taylor dispersion’ [8]. This may be restricted by confining the sample with menisci as interfaces [4]: injecting two immiscible fluid streams into the microfluidic device creates a liquid-liquid two-phase flow with the possibility of segmented flow (Figure 1.2) [9]. Plugs in segmented flow moving in a straight channel generate internal circulation within two halves of the plug [9]. This is due to shear between the channel and the slug which in turn reduces the thickness of the interfacial boundary layer [10]. At higher flow rates, reaction within the plugs as micro-reaction vessels may even be further enhanced by adding an inert gas phase as third phase [11].
(a)
(b)
aqueous phase plug
channel wall organic phase
Figure 1.2: (a) segmented flow and laminar circulations. (b) parallel or stratified flow. From Dessimoz et al. (2008) [12]
1.2.1
Dimensionless quantities
It is necessary to develop insight in the order of magnitude of various effects in com-parison to one another, like length and time scales, momentum, forces or energy scales. Dimensionless quantities can represent the different scales and ratios to provide a means to comparison of different systems, as it reduces the number of independent variables [13, 10].
Reynolds number
aqueous phase + solute
organic phase organic phase
+ solute
aqueous phase
mass
transfer
Figure 1.3: Segmented flow, mass transfer and subsequently phase separation in one microflu-idic apparatus. NB in this image, the inlet channel of the organic phase is also perpendicular to the main channel, in contrast to the used experimental apparatus.
1.3.1
Review of flow regime and droplet generation
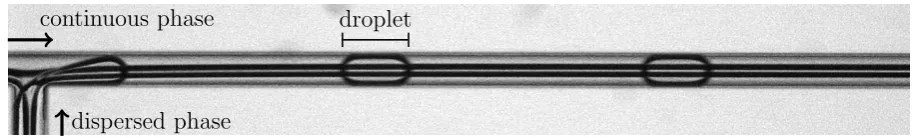
In a microfluidic device with a T-junction geometry, the continuous phase enters the main channel and the dispersed phase enters from a perpendicular channel as depicted inFigure 1.4. The current chips are chemically treated to hydrophobize the surfaces. In multiphase flow, the wetting phase is the continuous phase and the non-wetting phase is the dispersed phase. In this thesis the continuous phase is toluene, the dispersed phase is water with a solute.
dispersed phase
continuous phase droplet
1.4
Challenges
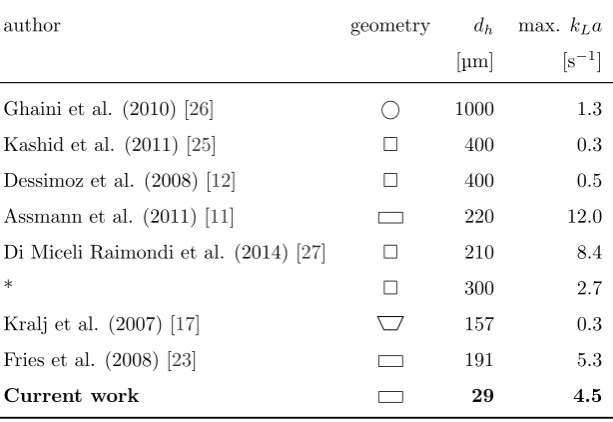
The main objective is to extract a solute from one phase to another and to separate said phases, within one microfluidic device. Fries et al. (2008) compare the mass transfer within segmented flow and stratified flow. They conclude segmented flow performs better on account of internal circulations [23]. Therefore in exploring the flow regimes in the microfluidic chip, emphasis is on segmented flow: in particular on segmented flow within the squeezing regime, for the constant droplet size.
In view of producing an efficient microfluidic device for liquid-liquid extraction, ex-perimental parameters of interest are: initial solute concentration, droplet length and droplet velocity. The droplet length will be fixed. Relevant properties to the mass trans-fer performance and mechanism are: interfacial area, dynamic viscosity, volumetric ratio of phases, residence time.
Chapter 2
Materials and Methods
2.1
Used chemicals and equipment
For this study 2 different chip layouts are adopted, designated ‘chip 1’ and ‘chip 2’. Chip 1 was used for characterization of the flow regimes of a microfluidic device with a T-junction, whereas chip 2 was used for mass transfer experiments. The reason for the usage of two different chip layouts is the unavailability of chip 2 at the start of experiments.
Toluene was used as the continuous phase in the two-phase flow, water as the dis-persed phase and phenol was used as solute during the mass transfer experiments. Octyl-trichlorosilane (‘OTS’) was used for hydrophobizing chip 1, a polysiloxane was used for hydrophobizing chip 2. The OTS method is detailed inAppendix A.2 (i). The polysilox-ane method is described by Arayanarakool et al. [3].
2.1.1
Chips
Both chips have rectangular channels and contain a T-junction for generation of seg-mented flow. The T-junction is orthogonal with no curvature and the dimensions of the main channel and the channel of the dispersed phase are equal. It should be noted however that both the channel width and height of chip 1 and chip 2 differ. A detailed overview of the chips and dimensions is available in Table 2.1.
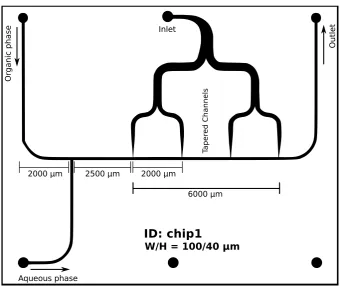
Chip 1
Chip 1 has two tapered channels (10µm width) perpendicular to the main channel. The tapered channels were intended for measurement of the pressure drop along the channel, as previously conducted within the covering project and adopting the method of Gu et al. (2011) [28]. The channel length from the T-junction to the exit is 12 000µm. Chip 1 is shown inFigure 2.1.
Chip 1 is used for characterizing the flow regimes, by varying the flow rates of both phases. The procedure is detailed in Appendix A.2 (ii) .
Chip 2
Table 2.1: Dimensions of used microfluidic chips
chip1
channel width w 100µm
channel height h 40µm
length l 12 000µm
tapered channel width wt 10µm
chip2
width w 50µm
height h 20µm
length l 7000µm
width of capillaries wc 3µm
spacing of capillaries dc 50µm
length of capillaries lc 2000µm
number of capillaries Nc 100
toluene
water toluene
water t-junction
chip2
inlet 1 outlet 1
inlet 2 outlet 2
capillaries
Figure 2.2: Topology of chip 2, the microfluidic chip for mass transfer experiments. This diagram is not to scale.
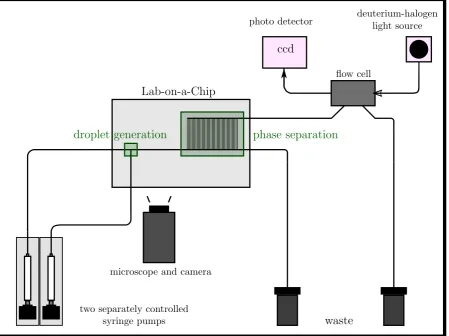
2.2
Lab-on-a-Chip platform for mass transfer
exper-iments
The experimental setup for mass transfer experiments is shown schematically in Fig-ure 2.3. The lab-on-a-chip platform (chip 2) comprises a droplet generation section at the beginning and a phase separation section at the end.
2.2.1
Droplet generation section
From experiments on chip 1 it was learned that Qd < Qc established segmented flow.
This was employed on chip 2, with low total flow rates to comply with the requirement of a low Capillary number in view of the squeezing regime. For a constant continuous phase flow rate Qc = 5.0µl min−1, the dispersed phase flow rate Qd was varied from
phase separation
droplet generation
Lab-on-a-Chip
two separately controlled
syringe pumps waste
flow cell
microscope and camera
deuterium-halogen light source photo detector
ccd
Chapter 3
Results
3.1
Flow regime
The flow regimes for two phase flow at low flow rates have been determined in chip 1. Three distinct flow regimes were observed, in general: plug flow if the toluene flow rate was higher and stratified flow if the water flow rate was higher. Furthermore a transient regime was observed in which no equilibrium was obtained, i.e. no stable flow regime. A flow map as in the figure is specific to a certain device and it’s dimensions. Using dimensionless numbers helps in generalizing the data. In Figure 3.1 the mean Capillary number has been plotted against the mean Reynolds number. The same data has been plotted in Figure 3.2, yet in a more practically sensible manner of volumetric flow rates. Figure 3.3 shows the droplet lengths in chip 2, during mass transfer measurements.
3.2
Mass Transfer
During the mass transfer experimentsm,ReM = 3.9 to 4.9 andCaM = 1.5×10⁻³ to 2.3×10⁻³.
The mass transfer (kLa,Equation (1.12)) of two initial phenol concentrationsc0 (dataset 1 and dataset 2) has been plotted in Figure 3.4 and Figure 3.5. An increase in c0 is not of influence within the applied concentration ranges. InFigure 3.4 the overall volumetric mass transfer coefficient kLa increases with increasing flow rate Q. In Figure 3.5 it is
shown how kLa decreases with residence time τ. In Figure 3.7, the phenol extraction
Chapter 4
Discussion
4.1
Mass transfer
The mass transfer coefficient kL can be regarded as ‘the rate constant for moving one
species from the boundary into the bulk of the phase’, as Cussler remarks [34]. According to Kashid, ‘it depends mainly on the diffusivity of solute, characteristic diffusion length and interfacial hydrodynamics.’ [10]. The latter refers in this case to the existence of circulating lamellae due to the aqueous-organic interface. The specific interfacial area a
depends on the flow regime and on microchannel dimensions. To that extent a proper benchmark of a device’s performance is the overall volumetric mass transfer coefficient
kLa, as it implicates the device’s geometry and flow conditions.
Precise measurement of the specific interfacial areaa is no requisite, as it is ‘lumped’ into Equation (1.12) according to the so-called ‘lumped-parameter model’ [34]. Knowl-edge of area a would however give more insight in the mechanism, as it can be used to accordingly calculatekL. Nonetheless the quality of the microscope photos have shown to
4.1.1
Droplet geometry and mass transfer
Insection 2.3.2the droplet was simplified as having a cross-section equal to the channel’s width and height. This is not accurate, as the continuous phase is the wetting phase and forms a layer δ between the non-wetting droplet and the channel. This would implicate mass transfer not only occurs at the front and back caps of the droplet, but also with the wetting film. Regarding the mass transfer between the droplet and the continuous phase depicted in Figure 4.1, the following can be considered:
a) diffusion across the boundary, from the droplet into the wetting film
b) diffusion across the boundary, from the droplet into the continuous phase bulk c) diffusion from the continuous phase bulk into the wetting film
There are also internal convections within the droplets and within the continuous phase bulk, which enhance mixing in both phases. These convections intensify with the droplet velocity, so mixing increases with flow rate.
The wetting film thicknessδchanges with flow conditions. There are various empirical scaling models, similar to Bretherton’s relation for the case of gas-liquid flow [26]. Within this study’s limited range of flow rates, the wetting film thickness is assumed to be constant. Also would a low Capillary number be indicative for a more constant δ, as viscous forces are of less influence.
a
b
c
Figure 4.1: Mass transfer zones in segmented flow. The circulations depict the convection within the droplet and within the continuous phase
4.1.2
Mass transfer at the T-junction
1. growing of the droplet, the continuous phase is able to pass
2. squeezing of the droplet, continuous phase is essentially blocked until the droplet is pinched of
During the first step, all continuous phase from this droplet to the droplet downstream, has been in contact with the emerging interface. Possibly the entering dispersed phase can be considered as a very long droplet in which internal circulation occurs. During the second step, the continuous phase which is in contact with the droplet, is the same unit of continuous phase as in step 1. With this reasoning, at the beginning of the droplet flow the concentrations in the dispersed phase and the continuous phase are lower and higher, respectively.
4.2
Phase separation
In Figure 3.9 and Figure 3.10 it is shown to what extent the phases were separated. Complete separation has not been achieved. Focus was not on complete separation, but on realizing a single phase flow into the spectroscopic flow cell. Tiny amounts of aqueous phase within the feed for the spectroscopic flow cell would be problematic for the measurements, as it erects an interface in the stream which scatters the spectroscope’s light. Scattering would cause less light to reach the spectroscope’s detector, resulting in a higher measured absorbance. As refraction is dependent on the wavelength, this higher absorbance would be experienced as a non-uniform baseline shift. Despite visual confirmation of no aqueous phase after the separating capillaries, the baseline of the adsorption measurement shifted as shown in the top part of Figure 4.2. One possible explanation is leaking capillary connectors from the chip to the flow cell, so tiny amounts of air enter. Another possibility may be cavitation due to dissolved gases and pressure changes from separating capillaries to the flow cell. Feasibility of the latter has not been studied.
200 220 240 260 280 300 320 340 0.00
0.02 0.04 0.06 0.08 0.10 0.12
Wavelength [nm]
Absorbance
[-]
Data (blue) and baseline estimate (green)
200 220 240 260 280 300 320 340
0.00 0.02 0.04 0.06 0.08 0.10 0.12
Wavelength [nm]
Absorbance
[-]
Baseline subtracted, green is x-axis
4.3
Recommendations
Establishing a stable segmented flow using a T-junction geometry is fairly easy and has received a lot of attention in the last decade. On the other hand, on chip separation of phases is being neglected.
First, focus should be on this separation and on subsequently adding a next step to the setup, as in this study is embodied by the spectroscopic flow cell. Possibly adding an inert gas as third phase helps in separation [11]. Yet it is advicable to focus on the separation dynamics without adding a third phase, because of possible influence of said phase on the mass transfer performance.
The quality of the microscope photos should be improved. Doing so helps accomodat-ing proper image analysis, for example for interfacial area measurements. This method, described as the ‘physical method’ by Ghaini et al. (2010), may be complemented by a ‘chemical method’ [26].
[27] N. Di Miceli Raimondi, L. Prat, C. Gourdon, and J. Tasselli, “Experiments of mass transfer with
liquid–liquid slug flow in square microchannels,”Chemical Engineering Science, vol. 105, pp. 169–
178, Feb. 2014.
[28] H. Gu, M. H. Duits, and F. Mugele, “Interfacial tension measurements with microfluidic tapered
channels,”Colloids and Surfaces A: Physicochemical and Engineering Aspects, vol. 389, pp. 38–42,
Sept. 2011.
[29] A. G¨unther, M. Jhunjhunwala, M. Thalmann, M. A. Schmidt, and K. F. Jensen, “Micromixing of
Miscible Liquids in Segmented Gas-Liquid Flow,”Langmuir, vol. 21, pp. 1547–1555, Feb. 2005.
[30] H. Bruus, “Ch. 3: Basic flow solutions,” in Theoretical microfluidics, Oxford: Oxford University
Press, 2008.
[31] F. J. V. Santos, “Standard Reference Data for the Viscosity of Toluene,” Journal of Physical and
Chemical Reference Data, vol. 35, no. 1, p. 1, 2006.
[32] J. Saien and S. Akbari, “Interfacial Tension of Toluene + Water + Sodium Dodecyl Sulfate from (20
to 50)°C and pH between 4 and 9,”Journal of Chemical & Engineering Data, vol. 51, pp. 1832–1835,
Sept. 2006.
[33] V. van Steijn, C. R. Kleijn, and M. T. Kreutzer, “Predictive model for the size of bubbles and
droplets created in microfluidic T-junctions,”Lab on a Chip, vol. 10, no. 19, p. 2513, 2010.
[34] E. Cussler, “Ch. 8: Fundamentals of Mass Transfer,” inDiffusion - Mass Transfer in Fluid Systems,
University of Minnesota: Cambridge University Press, 3 ed., 2009.
[35] J. J. de Rooi and P. H. Eilers, “Mixture models for baseline estimation,”Chemometrics and
Intel-ligent Laboratory Systems, vol. 117, pp. 56–60, Aug. 2012.
[36] R. Maboudian, W. Ashurst, and C. Carraro, “Self-assembled monolayers as anti-stiction coatings
for MEMS: characteristics and recent developments,” Sensors and Actuators A: Physical, vol. 82,
pp. 219–223, May 2000.
[37] B. J. Adzima and S. S. Velankar, “Pressure drops for droplet flows in microfluidic channels,”Journal
Appendix A
Appendices to materials and
methods
A.1
Chemicals
A.2 (iii)
Finding segmented flow regime in chip 2
In a similar yet less extensive way, the segmented flow regime was located in chip 2, by varying the aqueous phase flow rate at a certain constant continuous phase flow and waiting until the flow regime had settled. Images of the T-junction and downstream were captured for further analysis using ImageJ and Matlab.
A.2 (iv)
Distribution coefficient
Two experiments with different initial concentrations have been conducted to measure the distribution of phenol between the aqueous and organic phase. A known solution of 5 ml phenol in water was added to a separation flask with 5 ml of toluene. The contents were stirred and after a waiting time of approximately 30 minutes for the two layers to settle, the solutions were separated. The absorbance of the resulting organic phase and the resulting aqueous phase was measured. The reason for measurement of the absorbance of both phases, is to check the total amount of measured phenol with the initial amount of phenol, within the measurement error.
A.2 (v)
Measurement of mass transfer performance