Article
1
Results-Based Forest Conservation Funding: Amazon
2
Fund 10 Years Later, Lessons from the World's
3
Largest REDD+ Program
4
Juliano Correa 1*, Richard van der Hoff 2,3 and Raoni Rajão 3
5
1 Duke University, Durham, United States; [email protected]
6
2 Radboud Universiteit, Nijmegen, the Netherlands; [email protected]
7
3 Universidade Federal de Minas Gerais, Belo Horizonte, Brazil; [email protected]
8
* Correspondence: [email protected]; Tel.: +1-919 904-6453
9
10
Abstract: Results-Based Funding (RBF) for Reducing Emissions from Deforestation and Forest
11
Degradation (REDD+) has become an important instrument for channeling financial resources to
12
forest conservation activities. At the same time, much literature on conservation funding is
13
ambiguous about the effectiveness of existing RBF schemes. Many effectiveness evaluations follow
14
a simplified version of the principal-agent model, although in practice the relation between aid
15
providers and funding recipients is much more complex. As a consequence, intermediary steps of
16
conservation funding are often not accounted for effectiveness studies. This research paper aims to
17
provide a nuanced understanding of conservation funding by analyzing the allocation of financial
18
resources for one of the largest RBF schemes for REDD+ in the world: the Brazilian Amazon Fund.
19
As part of this analysis, this study has built a dataset of information on Amazon Fund projects at
20
unprecedented detail in order to accurately reconstruct the allocation of financial resources across
21
different stakeholders (i.e. governments, NGOs, research institutions), geographies and activities.
22
The results show that stakeholders seem to hold preferences with respect to the type of activities
23
that they support, thereby suggesting that project owners exert much influence on how
24
deforestation reduction is to be attained. There are evidences that governmental organizations lack
25
financial additionality of their projects, which renders the growing share of funding to this type of
26
stakeholder particularly worrisome. By contrast, the geographical distribution of financial resources
27
seemed to follow a more focused rationale as financial support tends to concentrate in areas where
28
deforestation threats are highest. Overall, the allocation of the financial resources from the Amazon
29
Fund reflects an arbitrary support of different projects that adopt very diverging theories of change
30
that are not primarily concerned with attaining further deforestation reductions. As projects owners
31
exert influence on funding effectiveness to some extent, the Amazon Fund may either seek to
32
regulate the allocation of financial resources more actively or adopt funding effectiveness
33
evaluations that account for this influence more comprehensively.
34
Keywords: REDD+; Amazon Fund; Results-Based Funding; benefit distribution; resource allocation;
35
climate change funding; effectiveness.; forest conservation funding
36
37
1. Introduction
38
International allocation of funds to activities intended to funding forest conservation – directly
39
or indirectly – is said to be a “highly cost-effective way of reducing greenhouse gas emissions on
40
climate change” [1]. Among many types of financial mechanisms for pursuing this approach,
Results-41
Based Funding (RBF) for Reducing Emissions from Deforestation and Forest Degradation (REDD, or
42
REDD+ for a broader suite of activities) has become an important instrument for channeling financial
43
resources to forest conservation activities [2,3]. RBF can be defined as the “transfer of money or
44
material goods conditional upon taking a measurable action or achieving a predetermined
45
performance target” [4-7]. The success of RBF instruments for REDD+ stems from political
46
controversies related to initial REDD+ proposals that favored offset-based markets [8]. Particularly
47
the Brazilian government has been known to challenge the use of markets on the basis of sovereignty
48
concerns [6,9]. Instead, Brazil created the Amazon Fund in 2008 in order to receive results-based
49
payments for achievements in deforestation reductions [10], which have plummeted between 2004
50
and 2012 [11-13]. Similar developments have also occurred in international forest governance debates
51
as the Green Climate Fund became the central financial instrument for REDD+ [14], testifing the
52
growing prevalence of RBF approaches in forest governance. Despite this dominance, the
53
effectiveness of RBF has been challenged by scholars [5,7,15-18], while others have showed that donor
54
and receiving countries and stakeholders often disagree on how to best evaluate these schemes and
55
distribute the resources [19,20].
56
This research paper aims to enhance the understanding of intermediary stages of RBF for forest
57
conservation by reconstructing the allocation of financial resources from the Brazilian Amazon Fund
58
to individual projects and analyzing the underlying rationales behind this allocation. Between 2008
59
and 2017 the Amazon Fund has received more than USD 1,2 billion in donations, committed USD
60
667.3 million for the financial support of 96 approved projects and thereby represents the largest and
61
most longstanding RBF initiatives in forest governance worldwide [10,13,21]. An analysis of financial
62
resource allocation could therefore provide important lessons on the intermediary stages of RBF (as
63
Amazon Fund) to REDD+ and other conservation purposes. Our analysis exposes the underlying
64
intervention logics (or ‘theory of change’) adopted for redistributing financial resources, which is
65
useful for identifying the main factors for successful or failing forest conservation funding. The
66
remainder of this paper proceeds as follows. Section 2 reviews the literature on related resource
67
allocations, including the theories of change, criteria for resource allocation, benefit-sharing
68
mechanisms and impacts. Section 3 then outlines our approach and Section 4 presents data about the
69
distribution of Amazon Fund resources. Section 5 concludes with our main findings and their
70
implications for impact and policy making.
71
2. Aid Effectiveness and the Complex Relations between Service Providers and Service Users
72
Deforestation reduction [17,22] has been a relatively recent trend in the broader context of
73
development aid that usually targeted health, education or biodiversity conservation [16,23].
74
Although using the same model, for REDD+ initiatives the literature generally refers to aid as
75
funding, since the former seems to be charity while the last is close to the climate change concepts,
76
where developed countries should fund initiatives of forest conservation to offset their historical
77
emissions [2].
78
Although this aid could come in many forms, RBF has become an increasingly appealing
79
approach due to its simplicity from both the donor and receiver sides. On the donor side, the
80
payments are done based on the measurement of a result already achieved, reducing substantially
81
the transactional risk. On the receiver side, RBF promises the transfer of resources with “no strings
82
attached” as countries are able to decide on how to best invest the payments. Since receiving countries
83
would want to receive an increasing volume of resources, they would be incentivized to invest the
84
RBF proceedings in a way that reduces deforestation the most. A closer look, however, reveals that
85
many of the issues that have plagued REDD+ and development aid more in general are still present
86
in RBF, namely: benefit distribution, intervention design and effectiveness.
87
One of the key design choices around REDD+ programs concerns the definition of “who needs
88
to be involved, whose interests are at stake, and the expected co-benefits and required
89
safeguards”[19]. Moreover, their discussion of approaches to reducing tropical forest degradation
90
highlights the importance of contextualizing local realities, responding to new knowledge and
91
experience, and incorporate the full complexity of forest loss and degradation, among others [24,25].
92
Many scholars have highlighted the issues of equitable sharing of net benefits from REDD+ projects
93
[e.g. 26,27]. For instance, Luttrell, Loft, Fernanda Gebara, Kweka, Brockhaus, Angelsen and Sunderlin
94
[27] distinguish a number of possible rationales for the distribution of REDD+ benefits. They have
95
forest stewards; (4) actors incurring the costs of REDD+ implementation; (5) effective facilitators of
97
REDD+ implementation; and (6) the poorest actors. They note great variation in how implementing
98
countries apply these rationales, implying that this is a function of context, project design and the
99
beneficiaries [see also 28]. Some scholars find that “equity can have significant positive feedback on
100
program outcomes and legitimacy over the longer term” [26,28,29]. According to Vatn and Vedeld
101
[30], market-based approaches were found to be the most problematic among governance structures,
102
since they do not address equity. These observations suggest a theme of providing equal
103
opportunities to stakeholders. Yet rigorous analysis and even merely comprehensive evaluations of
104
net benefits and their distribution are scarce, in part because of the way decisions are made about
105
distributions of resources within and across REDD+ projects [19].
106
Another key aspect of RBF is the choice, by the receiving country, of the interventions that will
107
be supported by the programme. [27,31]. Weatherley-Singh and Gupta [32], for example, find that
108
REDD+ activities must target directly the drivers of deforestation, such as forest fires and illegal
109
logging, as well as structural drivers, such as changes in land tenure and land-use planning. Yet they
110
argue that not all drivers are considered as most schemes do not address cattle ranching, corruption,
111
roadbuilding and or commodities demands, among others [see also 29,33]. As important as the choice
112
of the type of intervention is the definition of the territories that will be prioritized by REDD+.
113
Wolosin, Breitfeller and Schaap [10] show that the geographical distribution of REDD+ finance can
114
be explained to a large extent by priorities on tree cover, tree-cover loss and carbon emissions at
115
national (70-94%) and subnational (58-72%) levels, though institutional capacity and political
116
commitments have also been influential. Other work highlights significant gaps for specific priority
117
areas. Some scholars point to areas in the Amazon region facing high deforestation pressure that are
118
important for emissions and biodiversity [33-35]. Other scholars argue for additional investments in
119
the network of protected areas given their importance to date in curbing deforestation and the risks
120
from deforestation dynamics [36,37]. Still others argue that support should also consolidate pristine
121
or intact or stable forests to ensure long-term conservation [e.g. 35]. While the majority of available
122
literature strongly emphasizes improved protection of high-risk areas, at the least for prioritizing
123
additional impacts in the short run, various goals play parts within comprehensive approaches to
124
forest conservation.
125
Finally, different studies have pointed out that it is not clear that RBF leads to the efficient use
126
of resources, as assumed initially. The proponents of RBF expected that since receiving countries have
127
a direct financial incentive to reduce deforestation, they would strive to support actions on the
128
ground that contribute directly to that aim. However, a closer look suggests that that empirical
129
evidence on the effectiveness of RBF schemes is either lacking or points to contradictory effects [5], a
130
problem already well known in relation to development aid [38]. On the one hand authors such as
131
Restivo, Shandra and Sommer [17] argue that more bilateral aid from the United States Agency for
132
International Development (USAID) has a lowering effect on forest loss. On the other hand, studies
133
such as Hermanrud and de Soysa [22] report that forest conservation funding from Norway´s
134
International Forest and Climate Initiative (NICFI), one of the largest aid initiatives in the world and
135
the main donor to the Amazon Fund, has had no effect on forest degradation. In a similar line, Bare,
136
Kauffman and Miller [18] for example, argue that forest conservation funding in sub-Saharan Africa
137
“is not associated with reduced deforestation rates at the national scale” and even claim that
short-138
term impacts had negative effects. All scholars agree, however, that the relations between aid and
139
results are complex and therefore difficult to analyze.
140
The problem with evaluating the effectiveness of RBF initiatives is that the relations between
141
service users (aid providers) and service providers (aid users) are much more complex than a
142
simplified reading of the principal-agent model suggests. According to Paul [7], the contracted
143
agency relationship is often one between the donor organization and a recipient organization or
144
ministry, whereas results may come from other organizations that ultimately spend the financial
145
resources from these donations but have no direct relation with the donor organization (i.e.
non-146
contracted agency relation). In this respect, for example, the UN-REDD+ programme from the United
147
Paraguay, Democratic Republic of the Congo and Nigeria. However, UNDP are directly related only
149
to the governmental focal point of each country, relating only indirectly with the local beneficiary
150
[53].
151
According to Van der Hoff, Rajão and Leroy [19] the indirect relations between financial
152
donations, ‘project performance’ and deforestation rates underlie discursive tensions between donor
153
and recipient countries. These tensions and conflicts suggest that the intermediary processes of forest
154
conservation funding are poorly understood, particularly with respect to how they affect aid
155
effectiveness. Addressing these conflicts requires new approaches to aid effectiveness evaluations
156
that account for the complex relations of RBF for REDD+, particularly the intermediary stages of
157
forest conservation funding. A possible response is to make transfers conditional upon desired
158
results, as within well-implemented payments for ecosystem services (PES) approaches [28]. Scholars
159
have noted that such conditions could also require environmental additionality, that is, provide more
160
ecosystem services than without the activities [39,40]. In addition, REDD+ should be ‘financially
161
additional’, beyond already planned funding [41]. While attractive, the idea of adding specific
162
demands of additionality to RBF goes against the simplicity and “hands off” approach that made RBF
163
popular in the first place.
164
The growing body of literature presented above presents valuable insights on how RBF should
165
be designed and presents some its dilemmas and contradictory results. But while allot has been said
166
about how large RBF programmes should look like, until recently we lacked a strong record of
167
largescale schemes to look back and draw lessons from concrete experiences. This study provides the
168
first comprehensive analysis of the first decade of the Amazon Fund, the world largest REDD+ RBF
169
programme [42][43]. Our study aims to reveal the design choices adopted by the Fund by analyzing
170
its resource distribution across beneficiaries, activities and geographies. While this study does not
171
provide a quantitative impact analysis of the fund, it allows us to understand how the allocation of
172
financial resources corresponds with various REDD+ design choices, as reflected in the available
173
literature on REDD+, and the extent to which this may affect its long-term effectiveness. From this,
174
this study draws lessons that could be used to improve the Amazon Fund in Brazil and others large
175
RBF programmes.
176
3. Research Approach and Methodology
177
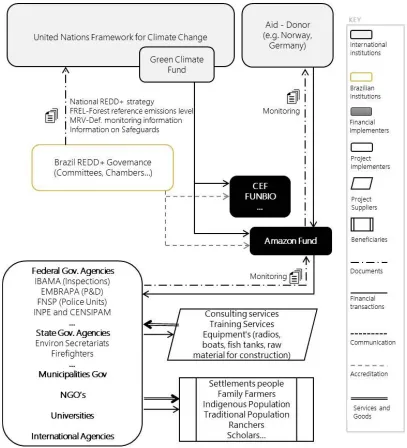
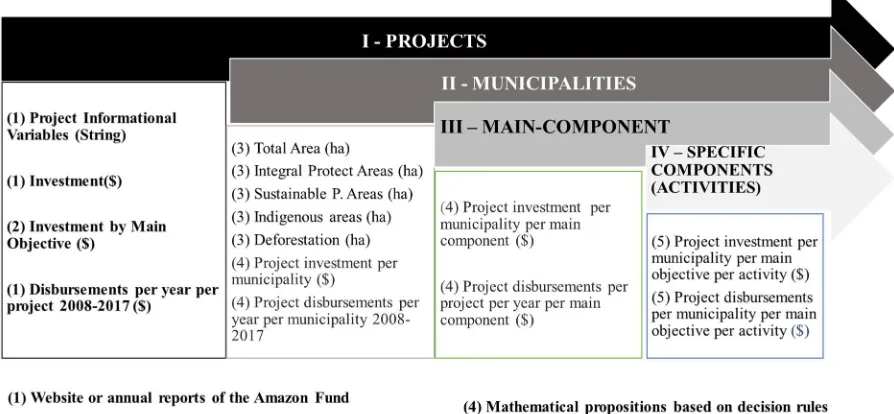
This research paper conceptualizes the Amazon Fund as an intermediary organization that links
178
the forest conservation funding provided by donor organizations to the individual projects (see figure
179
1). Created in 2008, the Amazon Fund was the first large scale RBF programme to be implemented.
180
As such, the fund played an important role in shaping the discussions around REDD+ at the United
181
Nations Framework Convention on Climate Change (UNFCCC). For this reason, the UNFCCC’s
182
Warsaw Framework for REDD+ adopted to a large degree the modus operadi pioneered by Brazil.
183
Financial donations to the Amazon Fund mainly come from Norway’s International Climate and
184
Forest Initiative (NICFI) and the German Development Bank (KfW). The Amazon Fund consists of a
185
steering committee (COFA), which is responsible for establishing allocation guidelines, and a
186
technical committee (CTFA), which is responsible for approving results in terms of reducing
187
emissions from deforestation. The managing organization of the Amazon Fund is the Brazilian
188
Development Bank (BNDES) and is responsible for the approval (or rejection) of submitted project
189
proposals according to predefined guidelines as well as for the receipt and allocation of financial
190
resources. Since 2015, BNDES has also become eligible to receive financial resources from the Green
191
Climate Fund (decree 8.576/15), whereas other organizations like the government-owned bank Caixa
192
Econômica Federal (CEF) and the Brazilian Biodiversity Fund (FUNBIO) may also become recipients.
193
Financial resources are allocated to a wide variety of organizations. Federal government
194
organizations include the Brazilian Agricultural Research Corporation (EMBRAPA), the Brazilian
195
Institute for Space Research (INPE), the Brazilian Institute for the Environment and Renewable
196
Natural Resources (IBAMA) and the National Police Force (FNSP). Non-governmental organizations
197
also abound and include the Sustainable Amazon Foundation (FAS), the Amazon Institute for
198
Nature Conservancy (TNC), between others. State governments organizations are mostly
200
represented by the environmental or agricultural secretariats of the nine Brazilian states in the Legal
201
Amazon, while some state secretariats outside this region were also recipients. Finally, municipal
202
government secretariats and federal universities were also supported financially by the Amazon
203
Fund.
204
Understanding how forest conservation funding to the Amazon Fund contributes to the effective
205
reduction of emissions from deforestation and forest degradation involves connecting the project
206
activities, each with a specific benefit sharing, geographies and supported activities, to the overall
207
objective of emissions reduction. The Amazon Fund already provides an annual report that divides
208
the funding distribution according to four broad categories: (1) monitoring and control, (2) land
209
tenure regularization, (3) sustainable production, and (4) scientific and technological development
210
[13]. However, to understand the allocation of financial resources in light of the design outlined
211
above, it is necessary to further refine the available information from the Amazon Fund. For this
212
purpose, we have built a project database with detailed information on the beneficiaries, activities
213
and geographies that received financial resources from the Amazon Fund.
214
Our primary data source is the Amazon Fund´s website as well as its annual activity reports. We
215
collected all data available on all of the 96 projects that received support between 2008 and 2017. This
216
data includes project objectives, beneficiaries, implementing organization, territorial scope,
217
committed and disbursed amounts, and activities conducted, among other information. Websites of
218
project owners provided additional information. For the data refinement for providing geographical
219
information, we used the municipality as the entity. In Brazil, municipalities reflect the smallest
220
geographical unit for monitoring deforestation, applying public policies, allocating government
221
resources and evaluating outcomes.
222
One of the main challenges of generating data at the municipal level is the variation of project
223
target areas, which may involve biomes, river basins, protected areas or indigenous territories. Based
224
on the available literature, we designed rules to determine the municipalities encompassed by each
225
project (see diagram 1 in SupMat). When project disbursements cover multiple municipalities, we
226
used a weight factor in order to determine the share of financial support that each municipality
227
received (see table 2 in SupMat). After the geographical allocation of financial resources, we further
228
categorized the dataset by main-component, which reflects the Amazon Fund´s theory of change. As
229
projects may contribute to multiple main-components, we conducted one interview by email with an
230
BNDES manager, the managing organization of the Amazon Fund, that replied a spreadsheet with
231
the data dividing the investments of each Amazon Fund project by main-component. Finally, we
232
further categorized the dataset by activity (also called specific-components). As a main-component
233
can be composed by multiple activities, if more than one activity by main-component was verified,
234
then the amounts was equally divided across them. The final database contains 10,493 lines of
235
information structured by project, location, main-component and specific-component. The
236
procedures for collecting and interpreting data, and constructing the database, are detailed in the
237
supplements. The Amazon Fund accountability is in Brazilian Reais currency. All financial data were
238
converted from Brazilian reais to US dollars by using the rate for the day they are received, which
239
corresponds with the methodology used for the English publications of the Amazon Fund. For
240
evaluate the additionality of the Brazilian governmental agencies budgets (accountable in Brazilian
241
reais) with the Amazon Fund disbursements, we used an average exchange rate between 2009 and
242
244
Figure 1. The Flows of Amazon Fund.
245
4. Results: Resource Allocations by the Amazon Fund
246
Currently, disbursements are made on the basis of criteria and guidelines updated biannually
247
by COFA. The 2017-2018 document lists 14 minimum requirements that potential projects must meet,
248
some (i.e. items B4, B5, B6, B7 and B14) determining conceptual boundaries of project activities.
249
Projects also must demonstrate coherence with environmental and forest policies, most notably the
250
national Action Plan for the Prevention and Control of Deforestation in the Legal Amazon
251
(PPCDAm), including its manifestations in state governments (PPCDs), and the national policy for
252
Regenerating Native Vegetation (ProVeg) [44]. Projects are also evaluated with respect to coherence
253
with Brazil’s National REDD+ Strategy (ENREDD+), which in turn incorporates implementation of
254
PPCDAm and compliance with the Brazilian Forest Code. Finally, projects are expected to be
255
financially additional, i.e., go beyond existing public environmental budgets and other forms of
256
finance. Given these rules, any organization may submit a project proposal to BNDES for financial
257
resources.
258
4.1. Benefit distribution across Stakeholders
260
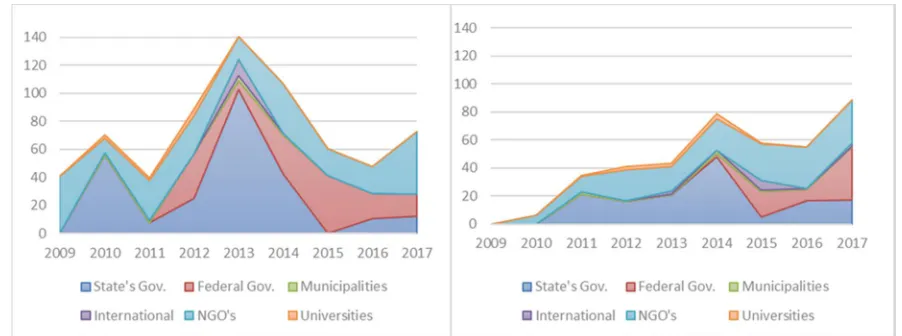
The distribution of financial commitments across stakeholders shows some variation across
261
years (Fig.2, left panel). In 2017, over 95% of a total of USD 667.3 million went to state governments
262
(USD 256.6 million) or NGOs (USD 241.1 million) or federal governments (USD 140.6 million), with
263
their shares varying considerably per year. Of a total of USD 140.4 million in 2013, about 70% (or USD
264
102.9 million) went to projects of state governments that received almost no such commitments either
265
two years earlier or two years later. This peak took place as a consequence to a change in the rule of
266
the Amazon Fund that allowed the approval of larger “structural projects”, as the implementation of
267
the Rural Environmental Register (CAR). By contrast, commitments to NGOs projects were relatively
268
stable over time, averaging USD 22 million until 2016, though rising to USD 44.5 million in 2017
269
(implying variation in NGOs’ share). Commitments to federal government projects were also uneven,
270
with slight peaks in 2012 and 2017 (USD 31.7 million, 41.2 million).
271
272
Figure 2. Annual committed (L) and disbursed (R) amounts per stakeholder (in million USD).
273
However, the ability of different stakeholders to approve projects with the Amazon Fund did
274
not match their implementation capabilities. In the last decade only USD 405.3 of 667.3 million (i.e.
275
60.7 %) has been transferred to project owners. Average annual disbursements to state governments
276
have hovered between USD 16 and 21 million in most years, with a sudden peak of USD 47.6 million
277
in 2014 and then a sharp drop to USD 4.8 million in 2015. Disbursements to federal government
278
increased exponentially from a small base of only USD 2.4 million even in 2014 to USD 37.7 million
279
in 2017. Finally, disbursements to NGOs steadily increased from USD 6.4 million in 2010 to USD 30.7
280
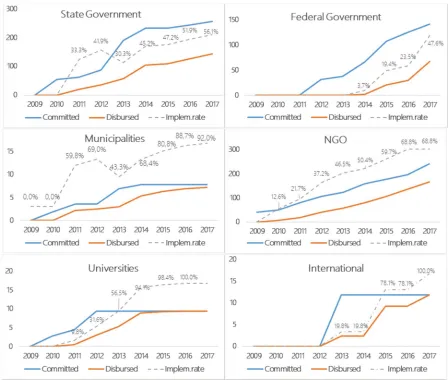
million in 2017. From these three groups of beneficiaries, the Federal Government has been
281
demonstrated the largest implementation gap, starting with a very low implementation rate and
282
reaching the execution of only 47% of the committed values by 2017. This was followed by the State
283
Governments, which spending rates stayed below 50%. Municipalities, Universities and NGOs, in
284
contrast, presented a better implementation capacity, being able to invest most of the resources
285
287
Figure 3. Implementation rates as disbursed divided by committed (consolidated amounts), by
288
Stakeholder.
289
To understand these variations in disbursements, we must also consider the characteristics of
290
the projects supported by the Fund. Federal government projects, for instance, were concentrated
291
within eight projects involving six recipient agencies. Of the total amounts in this category, USD 64.3
292
million (i.e. 47.2%) went to organizations that develop satellite-based monitoring systems and
293
provide information on deforestation trends, namely INPE and CENSIPAM. Another USD 35.9
294
million (i.e. 26.7%) went to organizations responsible for enforcing environmental laws and policies,
295
namely IBAMA and FNSP. The remaining USD 40.5 million (i.e. 25.9%) went to EMBRAPA units to
296
disseminate knowledge about sustainable production and recovery of degraded areas throughout
297
Brazil, and to the SFB to the collection of information aiming increase the forest data available (see
298
section 4.3). While the IBAMA manage to invest 17.5% of the funds received, by 2017 INPE and
299
CENSIPAM used only 58.6%, implying that the development of radar-based monitoring system is
300
lagging behind schedule.
301
The committed and disbursed peaks for state government projects in 2013 and 2014 (Fig.3)
302
corresponds with contextual factors as well, including a surge in state government projects toward
303
development and implementation of the Rural Environmental Register (CAR). CAR is a federal
304
policy instrument introduced in 2012 with the adoption of the new Forest Code (law 12.651/2012) to
305
enhance law enforcement capacity. Yet despite the federal law and a centralized national system, the
306
registers must be executed at state or municipal level (art 29, §1). CAR implementation has therefore
307
can be seen in both spending and appeals to the Amazon Fund [13]. Within the 13 states that have
309
approved projects, 85% of disbursements went to seven of the nine inside the Amazon Biome.
310
The linear increase in disbursements to NGOs reflects yet another set of contextual factors, in
311
this case related to Amazon Fund process adjustments over time. Disbursements to projects were
312
slow, to start, due to rigid assessment procedures intended to show professionalism, in the eyes of
313
donor organizations and BNDES management, that also reflected some lack of understanding of
314
project owners [13,19]. Minutes of COFA meetings indicate that, in response to these challenges, the
315
Amazon Fund adopted a number of measures in order to facilitate and accelerate the disbursement
316
process, including public calls for submitting project proposals. While the consequences of these
317
responses are reflected in the linear increase in approved projects and disbursements to NGOs, the
318
financial resources were not evenly distributed. We find that 80% of the disbursed amount was
319
concentrated in half of the NGOs that received support from Amazon Fund, usually high-capacity
320
and professional organizations, such as FAS, IMAZON, and TNC. (see figure 15 in SupMat).
321
In addition to exposing the implementation capability of different governmental agencies, a
322
comparison between the disbursement of the Amazon Fund with the yearly government budget also
323
reveals the ability of the Fund to foster additional actions. One of the key principles of the first
324
donation contract between Norway and Brazil signed in 2008 was the warrant that the Amazon Fund
325
would not replace but would be additional to tax payer funds [2,20,22,46] However, it is possible to
326
observe that the increases in disbursements to federal agencies coincided with their decreasing
327
governmental budgets, in particular after 2014 (Fig.4). This suggests the occurrence of a partial
328
substitution for agency expenditure of taxpayer-funded budgets using the Amazon Fund. For
329
instance, IBAMA’s committed budgets to reduce deforestation, combat fires and conduct
330
environmental inspections were reduced from USD 50.64 million in 2014 to USD 29.07 million in 2017,
331
a shift occurring in parallel with rising disbursements from the Amazon Fund disbursement.
332
Similarly, INPE´s budget fell from USD 84.5 million in 2010 to USD 43.63 million in 2017, alongside
333
increasing disbursements from the Amazon Fund (USD 27.51 million) between 2015 and 2017.
334
CENSIPAM shows similar trends. Those trends include rising implementation rates for turning
335
federal commitments into disbursements, which increased from 3.7% in 2014 to 26.8% in 2017.
336
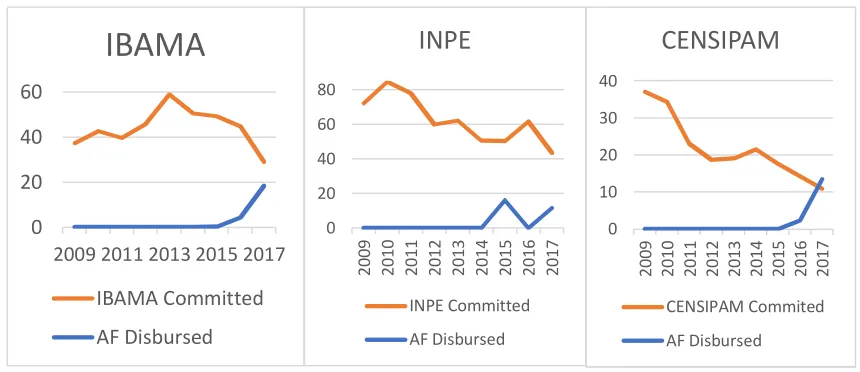
337
Figure 4. Comparison of Federal Committed Budgets with the Amazon Fund disbursements for INPE,
338
IBAMA and CENSIPAM (used average 2009-2017 exchange rate: 2.434). Committed amounts
339
represents the term in Portuguese ‘Empenhado’, an act that guarantees that there is the amount
340
necessary to pay an assumed commitment and creates for the government the payment obligation.
341
342
0 20 40 602009 2011 2013 2015 2017
These observations cannot by themselves confirm a direct causal relationship between the
343
increasing financial disbursements from the Amazon Fund and the decreasing budgets of the
344
recipient federal agencies. Furthermore, it should be highlighted that the period following 2015
345
witnessed one of Brazil’s worse political, economic and fiscal crisis. At the same time, however,
346
contextual factors seem to correspond with an interpretation that the forest conservation funding
347
provided through the Amazon Fund lacks financial additionality, particularly considering the
348
unfavorable political climate for environmental protection [47], more flexibility within forest
349
legislation since 2012 [48], multiple bills for reducing environmental protection during election year
350
2018 and, as a consequence of all these factors, rising deforestation rates since 2014 [49].
351
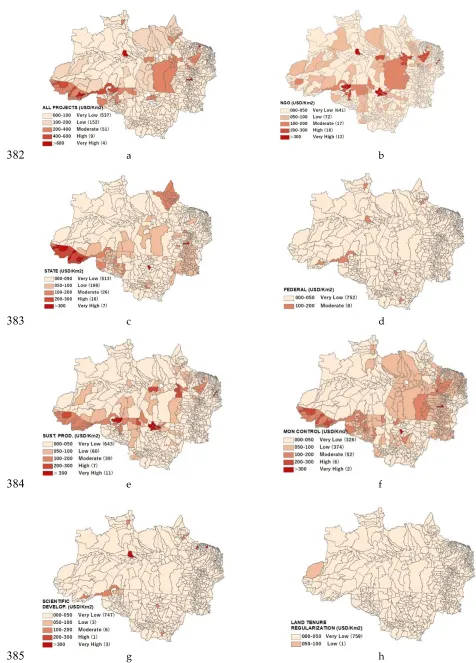
4.2. Geographical distribution
352
Spatially, Amazon Fund allocations display is large concentration (Fig. 5a) in 64 municipalities
353
along the (Fig. 5a) region stretching from the southeast of Pará towards the western regions in the
354
Mato Grosso, Rondônia and Acre states, municipalities that contains, since 2000, the highest
355
consolidated deforestation rates in Brazil. NGO and state projects explain much of this concentration
356
(Fig. 5b and 5c), whereas federal projects had no significant contribution mainly due to their
357
nationwide focus (Fig. 5c and 5d). State government projects are mostly responsible for monitoring
358
and control (Fig. 5c), particularly through activities as structuring of environmental secretariats, CAR
359
implementation, and training of firefighters (see section 4.3 for details). State governments that more
360
actively sought the support of Amazon Fund for monitoring and control were Acre, Maranhão,
361
Tocantins and Rondônia. Particularly Acre has a strong presence in investments in sustainable
362
production spread throughout its territory. However, the Amazon Fund allocations did not
363
systematically have privileged the municipalities that showed the recent highest deforestation rates.
364
An analysis of the relation between yearly deforestation rates and disbursements of the 20
365
municipalities that received more by hectare, indicate that the support from the Amazon Fund tend
366
to arrive in a context in which clearings have already been reduced substantially. Likewise, from the
367
10 municipalities with the higher deforestation rates in 2017, only 2 are amongst the top 100 receiving
368
per/Ha considering the 775 municipalities from Legal Amazon (see table 3 and Figure 15 in SupMat).
369
Federal government projects are the most evenly distributed across the landscape, averaging
370
below 26 USD/ha, which could be due to the all-encompassing nature of the GIS and remote sensing
371
activities that these projects tend to promote. At the same time, disbursements to larger federal
372
agencies, such as EMBRAPA, tend to concentrate in eight cities in the Legal Amazon, including Rio
373
Branco, Manaus, Boa Vista and Macapá, where these agencies are located (Fig. 5d). Finally, while
374
municipalities benefit indirectly from various types of support, direct support only went to 6 of the
375
772 municipalities in the Legal Amazon and amounted to only USD 7.8 million. Most of these
376
resources (65.2%) went to the municipal government of Alta Floresta, in northern Mato Grosso. In
377
addition, the Amazon Fund had also financed research of the state universities of Pará (in Belem) and
378
Amazonas (in Manaus) as well as to the development of satellite-based monitoring systems by INPE
379
(in Manaus).
380
a b
382
c d
383
e
f
384
g h
385
Figure 5. Spatial distribution of Amazon Fund investments per municipality by Stakeholder and by
386
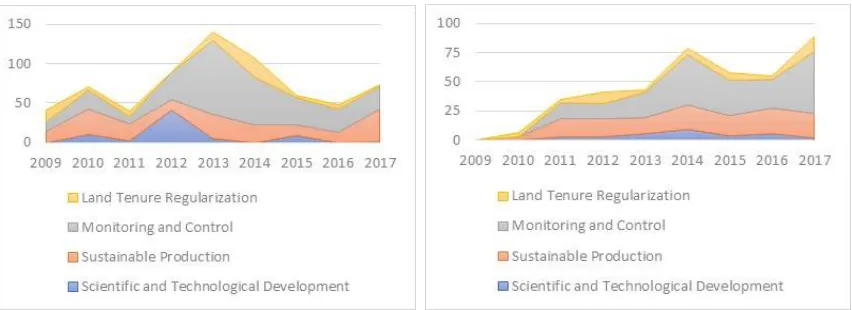
4.3. Distribution across Activities
388
Almost half of total commitments (USD 667.3 million) has gone to monitoring and control (USD
389
326.7 million) while one third (USD 201.9 million) went to sustainable production (see figure 6 and
390
table 1). The latter category has been relatively steady over time, as have the small land tenure
391
commitments. By contrast, the large investments monitoring and control have been uneven over
392
time: starting slow with an average of USD 20.3 million in the first four years, peaking in 2013 at USD
393
94.0 million, and then settling at an average of USD 30.6 million from 2015 on (Fig.6 left panel).
394
Finally, nearly all commitments for scientific and technological development occurred in 2012 (USD
395
40.7 million).
396
397
398
Figure 6. Annual committed (L) and disbursed (R) amounts per main-component (in million USD).
399
Although slightly slower than noted above, actual disbursements to individual projects have
400
corresponded with commitments, with most disbursements going to monitoring and control (49.6%)
401
and sustainable production (31.9%). Monitoring and Control was responsible for most of the
402
variation (see right graph of figure 3), peaking in 2014 (USD 43.1 million) and 2017 (USD 53.5 million).
403
Disbursements for scientific and technological development have notably never really gotten much
404
406
Figure 7. Implementation rates as disbursed divided by committed (consolidated amounts), by
main-407
component.
408
Monitoring and control efforts involved mostly state and federal government projects (USD
409
187.1 million and USD 100.1 million, respectively). It was the only category, though, that included
410
the unique international project supported by the AF aiming help develop the capacity to monitor
411
deforestation in 8 neighboring countries that also contain the Amazon biome (USD 11.8 million). Yet
412
most of the monitoring and control investments (USD 113,0 million) was allocated to CAR
413
implementation. A large share of the funds provided for this activity (USD 102.5 million) was used
414
by state governments to acquire equipment (GPS, computers, software) and provide training for
415
effective processing of CAR proposals. Another share (USD 52 million) was invested in
capacity-416
building of environmental secretariats for CAR implementation and other environmental policies,
417
including the creation of municipal secretariats, the acquisition of cars and buildings, the hiring of
418
employees and training in monitoring deforestation, landscape analysis, sustainable supply chains
419
and measurement. In addition, some resources were used to promote CAR among landowners and
420
to provide georeferencing services for landowners. A small amount went to development of a state
421
system for granting environmental licensing to new businesses and companies. Therefore, in total
422
18% of the resources committed by the fund has been invested in the implementation of CAR.
423
Monitoring activities that were exclusively promoted by federal government organizations
424
involved the improvement of satellite-based monitoring systems for fighting deforestation (PRODES
425
and DETER, USD 76.1 million) and forest fires (PREVFOGO, USD 6.3 million). State governments
426
also invested in forest fire combat (USD 32.5 million), but emphasized control activities (e.g. creation
427
of firefighter units) rather than monitoring activities. Other investments by federal government
428
organizations targeted the strengthening of law enforcement (USD 29.6 million) in two projects by
429
IBAMA and FNSP, mostly spent on the acquisition of vehicles, helicopters, equipment and buildings.
430
While NGOs received much financial support from the Amazon Fund (USD 241.1 million), their
431
support to monitoring and control activities were relatively small (USD 11.6 million) and only
432
involved CAR implementation.
433
In the category of sustainable production, resources mostly went to NGOs (USD 154.7 million)
434
investments went to the promotion of sustainable forest activities, acquisition of equipment (tanks,
436
driers, processing units’ machines, warehouses) and the provision of professional training and
437
technical assistance (in pisciculture and aquaculture, nut and Açaí extraction, pasture management,
438
as well as forestry and agroforestry systems). This suggests that the social benefits from the Amazon
439
Fund in terms of rural poverty reduction and sustainable farming were carried out mostly by NGOs
440
and state governments.
441
Investments in regularizing land tenure almost exclusively came from state governments (USD
442
23.8 million) and NGOs (USD 46.6 million), notably spending on territorial zoning and
protected-443
area management and indigenous lands. This provides indirect benefits for indigenous peoples,
444
quilombos (descendants from fugitive slaves), riverine people, smallholders and settlements. No
445
such investments were federal. Federal governments did invest substantially in scientific and
446
technological development, which involved field data collection by the Brazilian Forest Service (SFB)
447
for building the National Forest Inventory (USD 31.7 million).
448
Universities, by contrast, invested most financial resources in scientific research (USD 4.7
449
million) and development of the research infrastructure (USD 3.9 million). For instance, one project
450
from the Federal University of Pará conducted research for the development of new products from
451
bioactive compounds of plants typical of the Amazon Biome (USD 0.7 million), and investments in
452
the development of new forest products such as herbal medicines, cosmetics and food products,
453
among others. Natura, a private cosmetics company from Brazil, announced in 2016 an investment
454
of more than USD 70 million in biodiversity inputs as part of its Amazon Program that aims to
455
develop a new line of products with origins in Amazon Biodiversity.
456
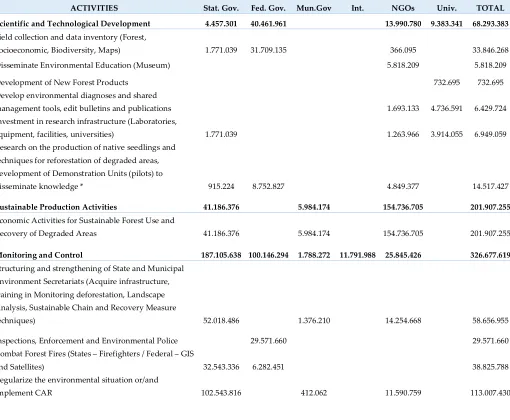
Table 1. Distribution of project approvals to Amazon Fund projects (USD).
457
ACTIVITIES Stat. Gov. Fed. Gov. Mun.Gov Int. NGOs Univ. TOTAL
Scientific and Technological Development 4.457.301 40.461.961 13.990.780 9.383.341 68.293.383 Field collection and data inventory (Forest,
Socioeconomic, Biodiversity, Maps) 1.771.039 31.709.135 366.095 33.846.268
Disseminate Environmental Education (Museum) 5.818.209 5.818.209
Development of New Forest Products 732.695 732.695
Develop environmental diagnoses and shared
management tools, edit bulletins and publications 1.693.133 4.736.591 6.429.724
Investment in research infrastructure (Laboratories,
equipment, facilities, universities) 1.771.039 1.263.966 3.914.055 6.949.059
Research on the production of native seedlings and techniques for reforestation of degraded areas, development of Demonstration Units (pilots) to
disseminate knowledge * 915.224 8.752.827 4.849.377 14.517.427
Sustainable Production Activities 41.186.376 5.984.174 154.736.705 201.907.255 Economic Activities for Sustainable Forest Use and
Recovery of Degraded Areas 41.186.376 5.984.174 154.736.705 201.907.255
Monitoring and Control 187.105.638 100.146.294 1.788.272 11.791.988 25.845.426 326.677.619 Structuring and strengthening of State and Municipal
Environment Secretariats (Acquire infrastructure, training in Monitoring deforestation, Landscape Analysis, Sustainable Chain and Recovery Measure
techniques) 52.018.486 1.376.210 14.254.668 58.656.955
Inspections, Enforcement and Environmental Police 29.571.660 29.571.660
Combat Forest Fires (States – Firefighters / Federal – GIS
and Satellites) 32.543.336 6.282.451 38.825.788
Regularize the environmental situation or/and
Improve Deforestation Monitoring System (GIS and
Satellites) ** 64.292.183 11.791.988 76.084.171
Land tenure regularization 23.829.953 62.995 46.552.443 70.445.392
Land Regularization of Small and Middle size
properties (Tenure, Deeds) 1.141.031 3.219.703 4.360.735
Territorial and Ecological Zoning, strengthening and
empowerment of PA and IT Management 22.688.922 62.995 43.332.740 66.084.657
Total 256.579.269 140.608.255 7.835.441 11.791.988 241.125.355 9.383.341 667.323.649
5. Amazon Fund design choices and effectiveness
458
The findings of our analysis of the recipient projects in the Brazilian Amazon Fund reflect a
459
broad variety of stakeholders and activities. Following the categorization of Luttrell, Loft, Fernanda
460
Gebara, Kweka, Brockhaus, Angelsen and Sunderlin [27], the recipient projects of the financial
461
resources from the Amazon Fund often involve the largely indirect contributions of effective
462
facilitators, legal rights holders, cost-incurring groups, forest stewards or poor communities.
463
Moreover, the Amazon Fund's financial resources were channeled towards the direct and structural
464
drivers of deforestation, but this was not proportional to the importance of addressing these drivers
465
as argued by some scholars[e.g. 32]. Investment patterns tend to reflect specific relations between
466
specific stakeholder groups and project activities. Although activities also vary considerably, there
467
are some general patterns. Federal government organizations tend to invest in development of
468
monitoring systems (45.7%) and inventory data (22.6%), which denotes a main concern with gaining
469
control over deforestation dynamics. State government organizations tend to invest mostly in CAR
470
implementation (40.1%) and capacity-building for state and municipal organizations (20.3%), thereby
471
incurring many of the costs of federal policies. Finally, investments by NGOs have mainly benefited
472
local communities that aim to adopt sustainable production activities (64.2%), but have also
473
supported (more than federal or state government organizations) land tenure regularization projects
474
(19.3%).
475
The geographical distribution of financial resources seemed to follow a more focused rationale.
476
We found that many project organizations were located in municipalities with the highest
477
consolidated deforestation rater of Brazil. For instance, NGO projects for territorial and ecological
478
zoning, strengthening of PA and IT management as well sustainable production represent 30% of
479
total disbursements from the Amazon Fund and were largely located in this region. Disbursements
480
from the Amazon Fund to the three main recipient categories have generally benefited municipalities
481
located in areas where deforestation threats are highest [50]. This observation only partially
482
corresponds with findings by Wolosin, Breitfeller and Schaap [10] as we found no evidence of
483
substantial contributions to areas with high tree cover, which are more commonly found in remote
484
areas of the Amazon biome [35].
485
Within the pre-established main-components of the Amazon Fund, we also found variation in
486
the activities that compose these categories. For instance, while most financial resources were
487
channeled to the strengthening of monitoring and control activities by federal and state governments
488
(USD 287.2 million), their investments have focused on monitoring activities like satellite imaging
489
(USD 70.6 million) and CAR implementation (USD 102.5 million). This contrasts with the
490
substantially smaller investments in control activities like combat forest fires (USD 32.5 million) or
491
law enforcement (USD 29.6 million). This trend is representative of the broader resource allocation
492
within the monitoring and control category. Similarly, investments in land regularization were
493
mainly directed at indigenous territories and protected areas (USD 66.0 million), whereas
494
smallholders (USD 4.3 million) received much less support. These findings suggest that financial
495
resources are not evenly distributed across stakeholders, activities and geographies even within the
496
main-components of the Amazon Fund.
497
Based on our findings on the variations in financial resource distribution, we argue that the
498
funding ultimately supports. The four main-components of the Amazon Fund, which aim drive the
500
projects to deforestation reduction, had a limited influence in the activities developed. As projects
501
owners exert influence on funding effectiveness to some extent, the Amazon Fund may either seek to
502
regulate the allocation of financial resources more actively or adopt funding effectiveness evaluations
503
that account for this influence more comprehensively. Corresponding with the study by
Weatherley-504
Singh and Gupta [32], for example, the Amazon Fund restricts financial resource allocation to the
505
four main-components of its theory of change, while not addressing alternative factors such as the
506
impacts of cattle ranching, road construction, international demand for agricultural products or
507
corruption. However, any project proposal that adheres to the project quality criteria and guidelines
508
of the Amazon Fund [13] may become eligible for financial support. In other words, the Amazon
509
Fund takes a more passive stance towards resource allocation after the criteria and guidelines are in
510
place. This view accounts for the great variety of stakeholders, activities and geographies, as
511
described above, since each stakeholder category seems to prefer a different investment strategy.
512
Such behavior may ultimately undermine the effectiveness of conservation funding provided by
513
Norwegian and German donor organizations, at least in terms of emissions reductions.
514
The influence of individual projects on decisions related to how financial resources will be
515
allocated may have substantial impact on the effectiveness of forest conservation funding. As already
516
argued in section 2, the Amazon Fund´s theory of change is generally geared towards deforestation
517
reduction, but the design choices of individual projects are primarily directed at contributing to one
518
or more main-components. The evaluation of a completed project in northern Mato Grosso [43], for
519
instance, indicates that the project geared its intervention logic upon its contribution to the
main-520
components “sustainable development” and “monitoring and control”, and stated that the main
521
contribution to emissions reductions was coming from “the restoration of native vegetation and
522
pastures and the planting of native species in permanent protection areas”. The extent to which such
523
projects achieved emissions reductions was not stated in the report and would admittedly be a
524
complex methodological endeavor. The leeway that projects have in contributing to these
main-525
components, although important for attracting project proposals, accounts (at least partially) for the
526
imbalanced allocation of financial resources discussed above and may undermine the Amazon
527
Fund´s contribution to deforestation reduction to some extent.
528
It is important to note that this undermining of the Amazon Fund´s overall contribution is by no
529
means intentional. At the same time, there are also indications that some projects require a more in
530
depth evaluation. Particularly but not exclusively, projects from governmental organizations are
531
under greater pressure from critical considerations of their contribution to emissions reductions. One
532
may argue that investments in CAR implementation, for example, support more structural
533
improvement of a nation-wide instrument that enhances monitoring capacity, but some studies point
534
out that it is still unclear whether and to which extent this instrument indeed contribute to reducing
535
deforestation [45,51]. In addition, our analysis indicates that federal government organizations (i.e.
536
CENSIPAM, INPE and IBAMA) tend to lack financial additionality. Particularly the substitutive
537
nature of Amazon Fund financial resources of IBAMA projects is worrying, because these
538
investments often involve more direct contributions to reducing deforestation, most notably the
539
enhancement of (the capacity for) environmental inspections and fire combat. While the lack of
540
funding for law enforcement may have led to an even higher spike on deforestation rates, a country
541
with a mature enough environmental governance should be able to grant a stable source of public
542
funding by giving priority to this agenda.
543
6. Conclusions
544
Our analysis of financial resource allocation from the Amazon Fund to individual projects has
545
provided a more nuanced understanding of the complexity of evaluating the effectiveness of
546
conservation results-based funding. Perhaps the main challenge is to evaluate (and enhance) its
547
effectiveness on the basis of a singular objective (i.e. emissions reductions from deforestation) while
548
also taking into account the project-level complexity that influences the outcome. For instance,
549
Fund, which already incite a more critical approach from aid provider organizations [19].The
551
critiques on some governmental projects that address both effectiveness and financial additionality
552
may further weaken the credibility of financial support from the Amazon Fund. The sustainable
553
development activities in NGO projects seem to incite less critiques, but these projects require much
554
closer scrutiny in order to understand the extent to which they indeed reduce deforestation. Our
555
analysis confirms the argument by Van der Hoff, Rajão and Leroy [19] that the “demands for
556
demonstrating the results of the Amazon Fund in scientifically rigorous manner are likely to become
557
an important topic for donor countries”. Alternatively, the Amazon Fund could adopt a more active
558
approach to the allocation of financial resources, for example by prioritizing control activities,
559
emphasizing projects in northern Mato Grosso and/or ensure additionality to governmental budgets
560
by improving transparency on spending. This is especially important as the political climate in Brazil,
561
United States and other countries has become more hostile to environmental interests [49,50,52].
562
Our analysis also helps to understand why empirical studies seem ambiguous about the
563
effectiveness of forest conservation funding. As explained in section 3, BNDES’ approach to
564
distributing financial resources from the Amazon Fund to individual projects occurs based on the
565
evaluation of project proposals from diverse organizations rather than a strategic selection of projects
566
based on a predetermined theory of change. As a consequence, our findings show that disbursements
567
by the Amazon Fund to individual projects reflect an arbitrary support of different projects that
568
adhere to very diverging theories of change within a broader REDD+ and RBF strategy. Although
569
this refutes any suggestion that BNDES pursues other interests than deforestation reduction, this
570
arbitrariness of disbursements suggests that the Amazon Fund is not primarily concerned with
571
attaining further deforestation reductions, but rather supports the broader policies that are or should
572
be. The financial transactions to Amazon Fund, as an intermediary organization, are conditional on
573
demonstrated achievements in reducing emissions from deforestation, whereas the conditions for
574
redistribution require adherence to national policies. Although the Amazon Fund contributes to
575
attaining REDD+ objectives to some extent, as an intermediary organization it is not responsible for
576
this attainment and may therefore foment political controversy [19]. Similar processes may underlie
577
some of the aid effectiveness studies [17,18,22], but empirical analysis will be necessary to verify this
578
hypothesis. Finally, this article providing an on-the-ground reference point to reflect on the need of
579
advancing the theoretical framework of RBF to include the intermediate stages of international forest
580
conservation funding.
581
Supplementary Materials: See at the end of this file.
582
Author Contributions: Conceptualization, Juliano Correa, Richard van der Hoff and Raoni Rajão; Data curation,
583
Juliano Correa; Formal analysis, Richard van der Hoff and Raoni Rajão; Investigation, Juliano Correa and
584
Richard van der Hoff; Methodology: Juliano Correa and Raoni Rajão; Visualization, Raoni Rajão; Writing –
585
review & editing, Juliano Correa, Richard van der Hoff and Raoni Rajão.
586
Funding: This research received no external funding.
587
Acknowledgments: We thank Alexander Pfaff from Duke University.
588
Conflicts of Interest: The authors declare no conflict of interest.
589
Bibliography
590
1. Stern, N. Stern Review of the Economics of Climate Change; Cambridge University Press: Cambridge, 2006.
591
2. Angelsen, A. REDD+ as Result-based Aid: General Lessons and Bilateral Agreements of Norway.
592
Review of Development Economics 2017, 21, 237-264, doi:10.1111/rode.12271.
593
3. Turnhout, E.; Gupta, A.; Weatherley-Singh, J.; Vijge, M.J.; de Koning, J.; Visseren-Hamakers, I.J.;
594
Herold, M.; Lederer, M. Envisioning REDD+ in a post-Paris era: between evolving expectations and
595
current practice. Wiley Interdisciplinary Reviews: Climate Change 2016, 10.1002/wcc.425, n/a-n/a,
596
doi:10.1002/wcc.425.
4. Eichler, R. Can "Pay-for-Performance" increase ultilization by the poor and improve the quality of health
598
services? Discussion paper for the first meeting of the Working Group on Performance-Based Incentives; Center
599
for Global Development: Washington, 2006.
600
5. Eldridge, C.; Palmer, N. Performance-based payment: some reflections on the discourse, evidence and
601
unanswered questions. Health Policy and Planning 2009, 24, 160-166, doi:10.1093/heapol/czp002.
602
6. Van der Hoff, R.; Rajão, R.; Leroy, P.; Boezeman, D. The parallel materialization of REDD+
603
implementation discourses in Brazil. Forest Policy and Economics 2015, 55, 37-45,
604
doi:http://dx.doi.org/10.1016/j.forpol.2015.03.005.
605
7. Paul, E. Performance-Based Aid: Why It Will Probably Not Meet Its Promises. Development Policy Review
606
2015, 33, 313-323, doi:doi:10.1111/dpr.12115.
607
8. Den Besten, J.W.; Arts, B.; Verkooijen, P. The evolution of REDD+: an analysis of discursive-institutional
608
dynamics. Environmental Science & Policy 2014, 35, 40-48,
609
doi:http://dx.doi.org/10.1016/j.envsci.2013.03.009.
610
9. Carvalho, F.V.d. The Brazilian position on forests and climate change from 1997 to 2012: from veto to
611
proposition. Revista Brasileira de Política Internacional 2012, 55, 144-169.
612
10. Wolosin, M.; Breitfeller, J.; Schaap, B. The Geography of REDD+ Finance: Deforestation, Emissions and the
613
Targeting of Forest Conservation Finance; Forest Trends: Washington, 2016.
614
11. Cunha, F.A.F.d.S.; Börner, J.; Wunder, S.; Cosenza, C.A.N.; Lucena, A.F.P. The implementation costs of
615
forest conservation policies in Brazil. Ecological Economics 2016, 130, 209-220,
616
doi:http://dx.doi.org/10.1016/j.ecolecon.2016.07.007.
617
12. Boucher, D.; Roquemore, S.; Fitzhugh, E.J.T.C.S. Brazil's success in reducing deforestation. 2013, 6,
426-618
445.
619
13. BNDES. Amazon Fund Activity Report 2017; BNDES: Rio de Janeiro, 2018.
620
14. Voigt, C.; Ferreira, F. The Warsaw Framework for REDD+: Implications for National Implementation
621
and Access to Results-based Finance. Carbon & Climate Law Review 2015, 9, 113-129.
622
15. Oxman, A.D.; Fretheim, A. Can paying for results help to achieve the Millennium Development Goals?
623
Overview of the effectiveness of results-based financing. Journal of Evidence-Based Medicine 2009, 2,
70-624
83, doi:10.1111/j.1756-5391.2009.01020.x.
625
16. Miller, D.C.; Agrawal, A.; Roberts, J.T. Biodiversity, Governance, and the Allocation of International
626
Aid for Conservation. Conservation Letters 2013, 6, 12-20, doi:doi:10.1111/j.1755-263X.2012.00270.x.
627
17. Restivo, M.; Shandra, J.M.; Sommer, J.M. The United States Agency for International Development and
628
forest loss: A cross-national analysis of environmental aid. The Social Science Journal 2018, 55, 171-181,
629
doi:https://doi.org/10.1016/j.soscij.2017.09.001.
630
18. Bare, M.; Kauffman, C.; Miller, D.C. Assessing the impact of international conservation aid on
631
deforestation in sub-Saharan Africa. Environmental Research Letters 2015, 10, 125010.
632
19. Van der Hoff, R.; Rajão, R.; Leroy, P. Clashing interpretations of REDD+ “results” in the Amazon Fund.
633
Climatic Change 2018, 10.1007/s10584-018-2288-x, doi:10.1007/s10584-018-2288-x.
634
20. Birdsall, N.; Savedoff, W.; Seymour, F.J.C.f.G.D.A.f.h.w.c.o.p.f.b.-a.-p.-b.-p.-f.-c.-s. The Brazil-Norway
635
Agreement with Performance-Based Payments for Forest Conservation: Successes, Challenges, and
636
Lessons. 2014.
637
21. Dalene, E. An assessment of the Brazilian REDD+ governance system. A case study of the Amazon
638
Fund. Norwegian University of Life Sciences, Ås, 2011.