Type of the Paper (Article)
Application of spectral angle mapping and maximum
likelihood classification techniques to evaluate forest
fire severity from UAV multispectral images in South
Korea
Heesung Woo1 [0000-0002-7649-0953], Mauricio Acuna2[0000-0003-1409-5699], Seungwan Cho1[0000-0002-8423-0457], Geonhwi Jung1[0000-0002-0305-1116], Bomi kim4[0000-0002-2617-8953], Jiyeon Ryu1[0000-0001-7930-2033], Choongsik Woo3[0000-0002-3064-8612], and Joowon Park1* [0000-0001-7505-6912]
1 Major in Forestry, School of Forest Science and Landscape Architecture, College of Agriculture and Life
Sciences, Kyungpook National University
2 Forest Research Institute, University of the Sunshine Coast, Locked Bag 4, Maroochydore DC, QLD, 4558,
Australia
3 Department of Forest Policy and Economics, National Institute of Forest Science, Seoul 02445, Republic of
Korea
4 Chungnam Forest Environment Research Institute, 110 Sanrimbakmulgwan-gil, Geumnam-myeon, Sejong
Special Self-Governing City, Sejong, 30085 Korea
* Correspondence: [email protected]; Tel.: +82 10-3602-8737
Abstract: High-resolution UAV images can provide valuable information for mapping forest areas that have recently been burned. This study investigates the use of multispectral images captured with a UAV to evaluate burn severity in areas affected by forest fires. Fire classification was performed using two supervised earning methods, Spectral angle mapper (SAM) and Maximum likelihood (ML). To compare the performance of the classification results, the estimated accuracy of fire severity was compared for the two methods. The results indicated that SAM and ML have a moderate overall accuracy in fire severity classification. In comparison to ML, SAM showed a higher accuracy in the crown fire and non-damaged areas, both in the Sokcho and Gumi regions. Most of the misclassification was identified between the unburned area and the low-heat damaged area. This research revealed that the classification between the unburned and low heat-damaged area is the most challenging in fire severity classification. Also, further investigation is required to improve the accuracy of fire severity classification from multispectral images.
Keywords: Forest fire severity, UAV, South Korea, multispectral images, maximum likelihood, and spectral angle mapper
1. Introduction
Globally, catastrophic forest fires are on the rise and have become an important issue in many countries. For example, just recently Australia recorded historical severe uncontrolled fires from June 2019 to March 2020. The fire burnt an estimated 18.6 million hectares and destroyed over 56,900 buildings and houses. Additionally, approximately one billion wildlife animals and birds were killed, and some endangered species were exposed to the danger of extinction [1]. In South Korea, from 2004 to 2018, there were 6,588 forest fires, with a total burned area estimated at around 11,065 ha, and an economic loss estimated at 252 million USD[2].
Forest fires can have other side consequences, including landslides and soil erosion. For instance, it has been confirmed that soil’s water infiltration capacity declines after the occurrence of a forest fire [3-5], which in turn results in an increase of runoff and surface erosion [3, 6-9]. To reduce the side consequences of forest fires, it is required that strategic plans are developed to investigate the burned area and severity so that efficient recovery plans can be implemented in damaged and burned areas. In general, integrated field surveys and satellite imagery analysis are some of the preferred methods to analyze forest fire severity in large-scale forest burned areas [10, 11]. However, there are several aspects that limit the use of field and satellite imagery methods such as time consumption, labor cost, high cost of high-resolution images, and low quality of contaminated images due to weather factors such as clouds, rain, etc. To overcome these issues, unmanned aerial vehicles (UAVs) equipped with high-resolution sensors have been proposed as an alternative to satellite images for different applications in the forest industry sector, including fire severity assessment [2, 12, 13].
Previous forest fire severity research has been performed using satellite or airborne multispectral imagery. Most of this research investigated burn severity comparing pre and post-forest fire spectral indices such as the normalized difference vegetation index (NDVI) and the normalized burn ratio (NBR) [14-19]. Additionally, most of the fire severity studies have combined NBR and the burned area index (BAI) since shortwave infrared bands have the potential to detect forest fire damage [20-22]. According to Keeley (2008), fire severity is defined as the impacts on ecosystems that occurred after of a fire such as mortality of trees or loss in diversity [23]. In forestry, fire severity is generally evaluated by the degree of tree mortality, canopy loss, or bole and crown scorch. In the United States, the Forest Service (USFS) has categorized fire severity into five classes (extreme, high, moderate, low, and unburned), based on the composite burn index [24-26]. These studies have also revealed the current limitations that exist to identify or classify fire severity using low resolution of satellite imagery data [2].
2. Materials and Methods
2.1 Study sites
Figure 1. Satellite images after forest fires in the study sites (a. Sokcho-si, b. Gumi-si)
2.1.1. Sokcho-si
The first study site was located in Jangsa-dong, Sokcho-si, South Korea, which is located on the east coast of the Korean peninsula. The climate condition of the Sokcho area is dry and windy during the winter and spring seasons. Korean red pine (Pinus densiflora) is the predominant species in this region. A forest fire occurred on 5th April 2019, with a total estimated burned area of approximately 323ha. Satellite images in Figure 1 show the total fire-damaged area, one day after the forest fire occurred. The images were captured by the Sentinel-2A imaging satellite, which is operated by the European Space Agency (ESA). The sensor is able to capture images with a spatial resolution of 10 m and 13 bands (coastal aerosol, blue, green, red, vegetation red edge, near-infrared, short wave infrared, etc.). The images collected with the UAV in the study area (200.8ha) are marked in red color in Figure 1.
2.1.2. Gumi-si
2.2 Data collection
2.2.1. UAV machine specification and imaging system description
A NIFoS-2 UAV equipped with a RedEdge camera (Micasense, Seattle, WA, USA), was used to acquire the multispectral images. The RedEdge camera can collect images in five bands (blue, green, red, red edge, and near-infrared), which are appropriate for vegetation detection. The spatial resolution was set to 31 cm with a flying height of over 500 m above the sea level. The images were then pre-processed and converted into a mosaicked reflectance image using the Pix4D software (Pix4 S.A., Prilly, Switzerland). Figure 2 presents the RedEdge multispectral UAV images of the burned areas in Sokcho and Gumi-si collected on 10th October 2019. The images were generated with a pseudo-infrared composite using the NIR band (RGB = band 5, 3, 2). The UAV corresponded to a hexacopter, equipped with six rotor arms, which provides a stable flight and more lifting power. UAV specifications and dimensions are presented in Figure 3. The maximum flight time, speed, and altitude were limited to 30mins, 15m/s, and 1,000m, respectively.
Figure 3. The UAV, NIFoS-2 and RedEdge-M specifications
2.2.2. Definition of fire severity
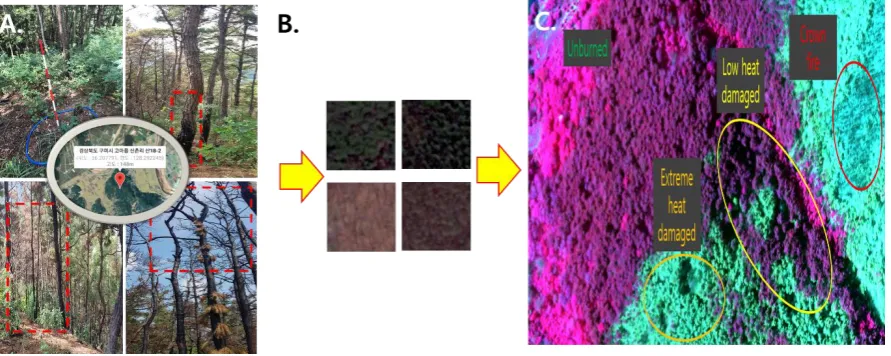
Fire severity was determined combining the Korean composite burn index (KCBI) and field survey results. According to KCBI, fire severity is classified into five levels: unburned, low, moderate, high, and extreme. There was a limitation in applying the KCBI for fire severity assessment due to an ambiguous definition between the moderate and low severity classes [2]. Instead, only four fire severity classes were in this study: (unburned, low heat damaged, extreme heat damaged, and crown fire), to reflect the significant characteristics of the damage degree. These fire severity classes are illustrated in Figure 4 and defined as follows:
• Unburned: no presence of damaged areas or evidence of forest fire • Low heat-damaged: presence of ash, and soot on the ground surface
• Extreme heat-damaged: presence of fallen yellow leaves due to heat damage • Crown fire: evidence of crown fire (no leaves and trunk covered by soot)
2.2.3. Developing reference maps via field survey
A reference map was generated from data collected during the field survey and screen digitalization. To develop the reference map and validate the fire severity results, ten locations in each fire severity class (identified by visual estimation) were visited, and their geographic coordinates were recorded. The borderline between the burned and unburned areas was delineated based on the images captured during the field survey (Figure 4). As a result, Figure 5Error! Reference source not found. presents the reference maps in the Sokcho and Gumi regions. Light green, orange, dark yellow, and light yellow represent unburned areas, crown fire, extreme heat damaged areas, and low heat-damaged areas, respectively.
Figure 5. Generated reference maps based on field survey and screen digitizing
2.2.4. Reflectance value selection
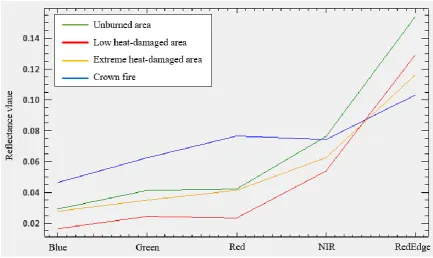
Image reflectance spectra were used to generate maps of fire severity applying the maximum likelihood algorithm (ML) and spectral angle mapper (SAM) algorithms. Reflectance values were sourced from the developed reference map and ground truth data collected during the field survey. Four reflectance values were identified from the study area corresponding to the four fire severity classes. The selected reflectance values are presented in Figure 6. The reflectance pattern shows that crown fire has a higher reflectance in the blue, green, and red bands. Unburned areas have a higher reflectance value in the near-infrared and RedEdge band compared to crown fire. Additionally, the extreme heat-damaged area had a high reflectance value except for the RedEdge band compared to low heat-damaged areas (Figure 6).
Figure 6. Spectral reflectance value selection for pixel-based classification
2.2.5. Training and testing classifiers from UAV image samples
included from all the defined fire severity classes(unburned area, low heat-damaged area, extreme heat-damaged area, and crown fire). Ten plots were selected from each fire severity class from field survey data and visual classification at the two study locations (Sokcho-si and Gumi-si). Each plot was nine-pixel square in size. A total of 720 pixels were collected and then divided into two groups, which were used for training and testing the classifiers, respectively.
2.3 Data analysis
2.3.1. Spectral angle mapper (SAM)
Fire severity was assessed from multispectral images in fire-damaged areas in the Sokcho and Gumi regions. Fire damaged areas were identified using a target detection analysis through spectral reflectance values. The spectral reflectance was derived from the UAV multispectral images, and each fire severity classes was identified based on the reflectance value and wavelength of the images (Error! Reference source not found.). In the SAM approach, similarity values of the spectral angle between the reference spectrum and the image spectrum of each pixel were calculated. The SAM algorithm can be presented as a mathematical formula that represents a pure impulse function between the image pixel and the reference reflectance spectrum. The mathematical formulation is presented in Eq (1) [27]:
D = cos
−1∑ 𝑋𝑌
√∑(𝑋)
2(𝑌)
2 (1)Where:
D = Angle formed between the reference and captured image spectrums X= UAV image spectrum
Y= Reference image spectrum
2.3.2. Maximum likelihood algorithm(ML)
The ML algorithm allocates a pixel to a class that has the highest probability under the assumption that the reflectance values of each class have a normal (Gaussian) distribution in the band [2]. The probability of the pixel is analyzed by the multivariate normal density function from the mean, variance, and covariance of training samples [28]. The equation for ML is presented in Eq (2):
P(𝑋|𝜔𝑖) =
1 𝑛
(2𝜋)2|𝑉 𝑖|
1 2
𝑒𝑥𝑝 [−1
2(𝑋 − 𝑀𝑖)
𝑇𝑉
𝑖−1(𝑋 − 𝑀𝑖)]
(2)
Where:
n = Number of multispectral bands, X = Unknown measurement vector
Vi = Covariance matrix of each training class, Mi = Meean vector of each training class
The main objective of the study was to assess the performance in fire severity classification of two classification algorithms, SAM and ML, using multispectral images acquired with the UAV and the ENVI 5.3 software. The performance validation was conducted based on the capability of the two methods to identify fire severity classes accurately in comparison to ground-truth data.
3. Results and discussions
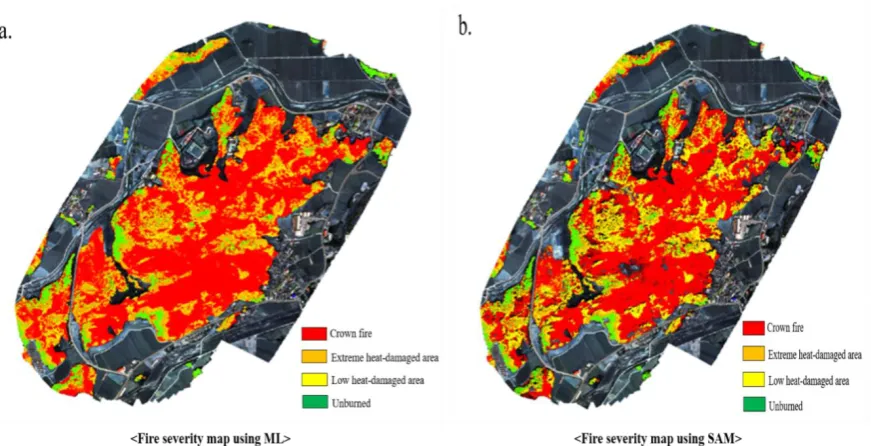
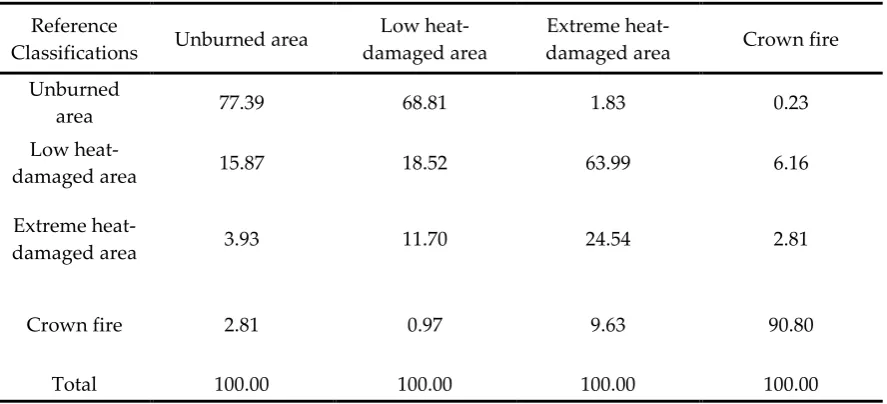
The accuracy of classification for the fire severity map produced from each classifier was assessed using the confusion matrix, including the overall accuracy and the Kappa statistic [29]. The Kappa statistic compares the actual agreement between the reference map and the classifier used to perform the classification, and the probability of agreement between the reference data and a random classifier [30]. The estimated fire severity map is presented in Figure 7. In the Sokcho-si region, the overall accuracy was 65.8% (Kappa coefficient = 0.4) and 72.7% (Kappa coefficient = 0.5) for the SAM and ML methods, respectively. The accuracy results of the SAM classification method are shown in Table 1. Regarding the SAM classification, the crown fire showed the highest accuracy level (90.8%) among all the fire severity classes. Likewise, the highest accuracy (89.0%) was estimated in the crown fire class when using the ML method (Table 2). On the contrary, the lowest accuracy among all the fire severity classes was obtained in the low heat-damaged area for both the SAM and the ML methods. These results indicated that most of the misclassification occurred between the unburned area and the low-heat damaged area.
Table 1. Confusion matrix for classification accuracy assessment using SAM (%) in the Sokcho-si area
Reference
Classifications Unburned area
Low heat-damaged area
Extreme
heat-damaged area Crown fire
Unburned
area 77.39 68.81 1.83 0.23
Low
heat-damaged area 15.87 18.52 63.99 6.16
Extreme
heat-damaged area 3.93 11.70 24.54 2.81
Crown fire 2.81 0.97 9.63 90.80
Total 100.00 100.00 100.00 100.00
Overall Accuracy = 65.83 %, Kappa coefficient = 0.43
Table 2. Confusion matrix for classification accuracy assessment using ML (%) in the Sokcho-si area
Reference
Classifications Unburned area
Low heat-damaged area
Extreme
heat-damaged area Crown fire
Unburned
area 74.41 67.08 4.94 0.47
Low
heat-damaged area 8.09 11.83 28.92 4.01
Extreme
heat-damaged area 13.39 18.00 50.12 6.53
Crown fire 4.11 3.09 16.01 88.98
Total 100.00 100.00 100.00 100.00
Overall Accuracy = 72.65 %, Kappa coefficient = 0.51
3.2 Identified fire severity in Gumi-si
such as under canopy inventory and crown density, which can provide additional information in order to recognize the differences between unburned and low heat-damaged areas accurately.
Figure 8. Identified fire severity using maximum likelihood (ML) and spectral angle mapper (SAM) in Gumi-si (a. result of fire severity map using ML b. result of fire severity map using SAM)
Table 3. Confusion matrix for classification accuracy assessment using SAM (%) in Gumi
Reference
Classifications Unburned area
Low heat-damaged area
Extreme
heat-damaged area Crown fire Unburned
area 3.09 18.19 6.09 7.10
Low
heat-damaged area 96.00 50.47 4.18 6.35
Extreme
heat-damaged area 0.91 31.02 86.40 86.17
Crown fire - 0.32 3.33 0.38
Total 100.00 100.00 100.00 100.00
Overall Accuracy = 61.70 %, Kappa coefficient = 0.36
Table 4. Confusion matrix for classification accuracy assessment using MLC (%) in Gumi
Reference
Classifications Unburned area
Low heat-damaged area
Extreme
heat-damaged area Crown fire Unburned
area 49.57 26.85 1.83 8.65
Low
heat-damaged area 45.48 38.99 18.34 27.91
Extreme
heat-damaged area 0.13 8.89 40.96 5.16
Crown fire 4.83 25.26 38.87 58.27
Overall Accuracy = 42.33 %, Kappa coefficient = 0.21
4. Conclusions
This study investigated the use of multispectral UAV images to assess forest fire severity. Two supervised learning techniques, Spectral angle mapper (SAM), and Maximum likelihood (ML) were used for this purpose. The performance and classification accuracy of the two methods were compared using the confusion matrix. The results indicated that both SAM and ML have moderate overall accuracy in fire severity classification. In the Sokcho region, SAM was more effective in identifying the crown fire and unburned areas compared to the ML method, whereas in the Gumi region, the extreme heat-damaged area had the highest accuracy level compared to the other classes when using the SAM method.
Regarding the ML method, the highest accuracy was estimated in the crown fire class. Despite these promising results, there were some issues to establish the classification limit between some areas (e.g., the unburned area and the low-heat damaged area) in both the SAM and ML methods. Thus, further research is required to improve the accuracy of fire severity classification from multispectral images. Also, it is necessary to factor in other elements such as under canopy inventory and crown density, which can provide additional information for the accurate classification of damage areas (e.g., unburned and low heat-damaged areas).
Author Contributions: “Conceptualization, J.P. and C.W.; methodology, J.P. and H.W.; validation, M.A., B.K. and C.W.; formal analysis, H.W. and G.J.; investigation, H.W.; resources, C.W., J.R., and S.C.; data curation, H.W. and M.A.; writing—original draft preparation, H.W.; writing—review and editing, J.P. and M.A; visualization, S.C.; supervision, J.P.; project administration, J.P.; funding acquisition, J.P. All authors have read and agreed to the published version of the manuscript.”, please turn to the CRediT taxonomy for the term explanation. Authorship must be limited to those who have contributed substantially to the work reported.
Funding: This research was funded by the Korea Forest Service (Korea Forestry Promotion Institute) [project no. 2019149C10-2023-0301, 2018112B10-2020-BB01].
Conflicts of Interest: The authors declare no conflict of interest.
References
1. Dickman, C., More than one billion animals killed in Australian bushfires, in The University of Sydney. 2020, The University of Sydney: Sydney.
2. Shin, J.-i., et al., Using UAV Multispectral Images for Classification of Forest Burn Severity—A Case Study of
the 2019 Gangneung Forest Fire. Forests, 2019. 10(11): p. 1025.
3. Marxer, P., M. Conedera, and D. Schaub. Postfire runoff and soil erosion in the sweet chestnut forests in south
Switzerland. in III International Conference on Forest Fire Research and 14th Conference on Fire and Forest
Meteorology. 1998.
4. DeBano, L.F., Water repellent soils: a state-of-the-art. Vol. 46. 1981: US Department of Agriculture, Forest Service, Pacific Southwest Forest and ….
5. Cerdà, A., Changes in overland flow and infiltration after a rangeland fire in a Mediterranean scrubland.
Hydrological processes, 1998. 12(7): p. 1031-1042.
6. Giovannini, G., The effect of fire on soil quality. Soil erosion and degradation as a consequence of forest
fires’.(Eds M Sala, JL Rubio) pp, 1994: p. 15-27.
7. Giovannini, G., et al., Effects of land use and eventual fire on soil erodibility in dry Mediterranean conditions.
Forest Ecology and Management, 2001. 147(1): p. 15-23.
9. Cerdà, A., Post-fire dynamics of erosional processes under Mediterranean climatic conditions. Zeitschrift für Geomorphologie, 1998. 42(3): p. 373-398.
10. Jaiswal, R.K., et al., Forest fire risk zone mapping from satellite imagery and GIS. International Journal of Applied Earth Observation and Geoinformation, 2002. 4(1): p. 1-10.
11. Loschiavo, J., et al., Mapping prescribed fire severity in south-east Australian eucalypt forests using modelling
and satellite imagery: a case study. International journal of wildland fire, 2017. 26(6): p. 491-497.
12. Matese, A., et al., Intercomparison of UAV, aircraft and satellite remote sensing platforms for precision
viticulture. Remote Sensing, 2015. 7(3): p. 2971-2990.
13. Hunt, E.R., et al., Acquisition of NIR-green-blue digital photographs from unmanned aircraft for crop
monitoring. Remote Sensing, 2010. 2(1): p. 290-305.
14. García, M.L. and V. Caselles, Mapping burns and natural reforestation using Thematic Mapper data. Geocarto International, 1991. 6(1): p. 31-37.
15. Barbosa, P.M., et al., An assessment of vegetation fire in Africa (1981–1991): Burned areas, burned biomass,
and atmospheric emissions. Global Biogeochemical Cycles, 1999. 13(4): p. 933-950.
16. Chafer, C.J., M. Noonan, and E. Macnaught, The post-fire measurement of fire severity and intensity in the
Christmas 2001 Sydney wildfires. International Journal of Wildland Fire, 2004. 13(2): p. 227-240.
17. Epting, J., D. Verbyla, and B. Sorbel, Evaluation of remotely sensed indices for assessing burn severity in
interior Alaska using Landsat TM and ETM+. Remote Sensing of Environment, 2005. 96(3-4): p. 328-339.
18. Collins, B.M., et al., Spatial patterns of large natural fires in Sierra Nevada wilderness areas. Landscape Ecology, 2007. 22(4): p. 545-557.
19. Tran, B.N., et al., Evaluation of spectral indices for assessing fire severity in Australian temperate forests.
Remote Sensing, 2018. 10(11): p. 1680.
20. Chuvieco, E., M.P. Martin, and A. Palacios, Assessment of different spectral indices in the red-near-infrared
spectral domain for burned land discrimination. International Journal of Remote Sensing, 2002. 23(23): p.
5103-5110.
21. Amos, C., G.P. Petropoulos, and K.P. Ferentinos, Determining the use of Sentinel-2A MSI for wildfire
burning & severity detection. International journal of remote sensing, 2019. 40(3): p. 905-930.
22. Filipponi, F. BAIS2: Burned Area Index for Sentinel-2. in Multidisciplinary Digital Publishing Institute
Proceedings. 2018.
23. Keeley, J.E., Fire, in Encyclopedia of Ecology, S.E. Jørgensen and B.D. Fath, Editors. 2008, Academic Press: Oxford. p. 1557-1564.
24. Rossi, F.C., A. Fritz, and G. Becker, Combining satellite and UAV imagery to delineate forest cover and basal
area after mixed-severity fires. Sustainability, 2018. 10(7): p. 2227.
25. Fraser, R.H., J. Van der Sluijs, and R.J. Hall, Calibrating satellite-based indices of burn severity from
UAV-derived metrics of a burned boreal forest in NWT, Canada. Remote Sensing, 2017. 9(3): p. 279.
26. McKenna, P., et al., Measuring fire severity using UAV imagery in semi-arid central Queensland, Australia.
International Journal of Remote Sensing, 2017. 38(14): p. 4244-4264.
27. Yuhas, R.H., A.F. Goetz, and J.W. Boardman, Discrimination among semi-arid landscape endmembers using
the spectral angle mapper (SAM) algorithm. 1992.
28. Swain, P.H. and S.M. Davis, Remote sensing: The quantitative approach. IEEE Transactions on Pattern Analysis & Machine Intelligence, 1981(6): p. 713-714.
29. Foody, G.M., Status of land cover classification accuracy assessment. Remote sensing of environment, 2002.
30. Congalton, R.G. and K. Green, Assessing the accuracy of remotely sensed data: principles and practices. 2019: CRC press.