Pavement crack characteristic detection based
on sparse representation
Xiaoming Sun
1, Jianping Huang
1, Wanyu Liu
1*and Mantao Xu
2Abstract
Pavement crack detection plays an important role in pavement maintaining and management. The three-dimensional (3D) pavement crack detection technique based on laser is a recent trend due to its ability of discriminating dark areas, which are not caused by pavement distress such as tire marks, oil spills and shadows. In the field of 3D pavement crack detection, the most important thing is the accurate extraction of cracks in individual pavement profile without destroying pavement profile. So after analyzing the pavement profile signal characteristics and the changeability of pavement crack characteristics, a new method based on the sparse representation is developed to decompose pavement profile signal into a summation of the mainly pavement profile and cracks. Based on the characteristics of the pavement profile signal and crack, the mixed dictionary is constructed with an over-complete exponential function and an over-complete trapezoidal membership function, and the signal is separated by learning in this mixed dictionary with a matching pursuit algorithm. Some experiments were conducted and promising results were obtained, showing that we can detect the pavement crack efficiently and achieve a good separation of crack from pavement profile without destroying pavement profile.
Keywords:Pavement crack detection, Three-dimensional laser scanning system, Sparse representation, Mixed over-complete dictionary
Introduction
In the life cycle of pavement, there will be various pave-ment distresses due to the burden of vehicles and nat-ural causes. The pavement distress will affect the lifespan of the pavement, vehicles energy assumption, transportation efficiency, and the transportation safety [1]. Among the various pavement distresses, pavement cracking data is the most important element for quanti-fying the condition of pavement surface [2,3], so it is crucial to detect and recognize the pavement cracking automatically and accurately before repairing them.
There are some methods for detecting pavement cracking. The traditional method is to detect by human vision, but manual surface distress survey are subject to many limitation such as non-repeatability, subjectivity, and high personal costs [4]. Manual procedures are time-consuming, and present substantial differences be-tween evaluations of different raters [5]. In recent years,
several 2D image analysis-based pavement crack detec-tion techniques were proposed [6–10]. One major issue with pure 2D video-based systems is their inability to discriminate dark areas not caused by pavement distress such as tire marks, oil spills, shadows, and recent fillings [11]. Moreover, the shadows and poor illumination are also major problems for daytime operation though they can be overcome using additional lighting systems or by acquiring data in the night after sunset [12].
Pavement crack detection technique based on the 3D laser is a recent trend. The measurement principle of pavement crack detection based on the 3D laser tech-nique is shown in Figure 1. A laser stripe is emitted from a structured light source, and is projected onto the detected object. Since the surface of the detected object is not on the plane of the detection platform, the stripes from the lamp house will produce a deformed line on the across the detected object. By using the CCD camera to capture the deformed line, we can obtain the contour of the detected object by analyzing the deformed line [13]. In the practical application of pavement detection, the stripes from light source will deform after going * Correspondence:[email protected]
1
Harbin Institute of Technology, School of Electrical Engineering and Automation, Harbin, Heilongjiang, China150001
Full list of author information is available at the end of the article
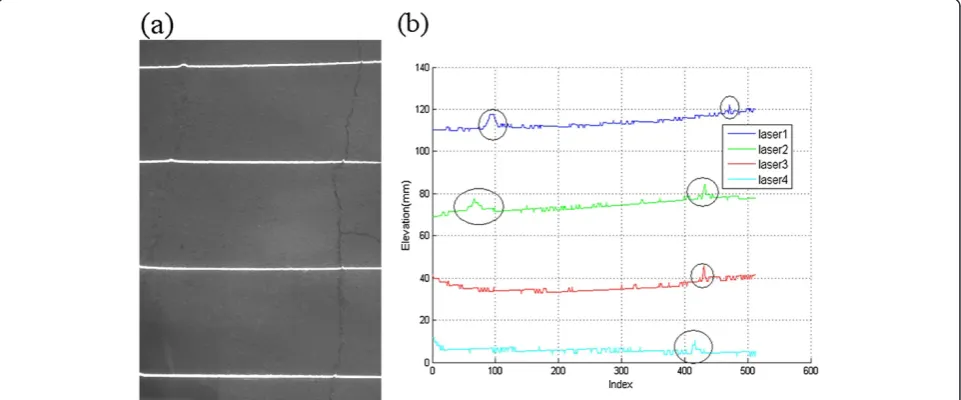
through the pavement cracks (Figure 2), thus the 3D in-formation in both x and y dimensions (surface) and z dimensions (depth) of the crack can be analyzed based on these deformed stripes. The advantage of using 3D laser technique is that it is insensitive to the disturbance such as tire marks, oil spills, and shadows. A crack with some shadows is shown in Figure 3, which contains some shadows, tire marks, and one transverse crack marked in green box. The longitudinal laser stripe deforms across transverse crack and the deformation part is marked in green Oval box. From Figure 3, it is obvious that the 3D laser based technique can effectively detect the crack accurately in case of shadows.
Since each laser profile acquired by 3D laser detection system has its own characteristic in terms of profile shape, crack shape, the number of cracks and signal-to-noise ratio, the signal processing techniques are adapted to each laser profile to extract the features of the crack. As the technology protection, few literatures describe
algorithms in detail in this area. Bursanescu used a spe-cial filter to avoid the noise and extract the crack. The filter uses an adaptive width mobile widow, and width is self-adjusting. We cannot find more details in his papers [5,11,14]. Laurent introduced the algorithm for the de-tection of cracks, which is the valley dede-tection of candi-date cracks in the individual pavement profiles [15–17]. This simple technique is fast and easy to implement, but it cannot achieve a good separation of crack from pave-ment profile.
For profile signal, the main profile signal is varying slowly, which spreads over the whole observing period; Crack signal has sharp edges and performs different shapes, which belongs to narrow-scale signal. Wavelets can detect the location of cracks accurately due to its good time-frequency characteristic, but the wavelet base CCD
Laser stripe Lamp-house
Detected object Detection
platform
Figure 1Illustration of 3D laser detection system.
Figure 2Pavement scanned by laser stripes.(a) the stripes from the light source deform across the pavement cracks; (b) the corresponding profile from picture (a), the elevation coordinate for each profile is relative in this Figure.
is fixed which cannot match the crack shape well. So after analyzing the characteristics of main profile and cracking, we constructed a mixed over-complete diction-ary according to main profile and crack characteristics and proposed a novel method based on sparse represen-tation for crack detection and the mainly pavement pro-file extraction without noise. Some experiments were conducted and promising results were obtained, showing that we can detect the pavement crack accurately and achieve a good separation of crack from pavement profile.
Pavement crack and profile detection based on sparse representation
Sparse representation of signals
Sparse representation of signals has become a major area of research in the last few years [18,19]. Using an over-complete dictionary matrix D 2 Rn×K that contains K atoms, {dj}j = 1K , as its columns, it is assumed that a
sig-naly2Rncan be represented as a sparse linear combin-ation of these atoms. The representcombin-ation of ymay either be exacty=Dx, or approximate,y Dx, satisfying‖y− Dx‖2≤E. The vectorx 2RK displays the representation
coefficients of the signal y. This, sparest representation, is the solution of either
min
x x0subject to y¼Dx ð1Þ
or
min
x x0subject to‖yDx‖2≤E ð2Þ
where‖.‖0is thel0norm , counting the non zero entries
of a vector[20].
For our profile signal f contains crack signal sC and
main profile signal sProf two layers as a linear
combin-ation, we propose to seek the sparsest of all representa-tion over the mixed dicrepresenta-tionary. Thus we need to solve
xoptc ;xoptp
n o
¼ Arg
xoptc ;xoptp
f gmin xc0þxp0
subject to
:¼ΦcxcþΦpxp ð3Þ
whereΦc is the crack dictionary,Φpis the main profile
dictionary, xc and xp are the coefficients in the
corre-sponding dictionaries.
Characteristics of main profile signal and crack signal
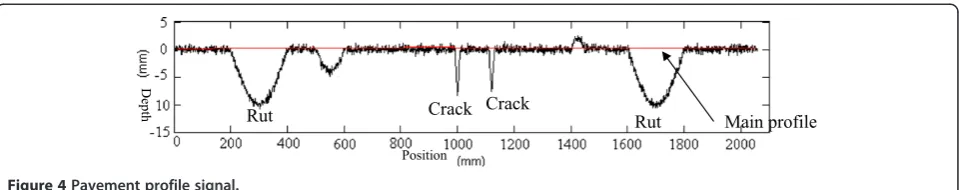
The profile signal acquired by 3D laser detection tech-nology as shown in Figure 4.can be expressed as follows:
f ¼sRþsCþsbumpþsProtþsProfþsn ð4Þ
where f is profile signal, sC is crack signal,sProf is main
profile signal,snis noise. wherefis profile signal,sProf is
the main profile signal, sR, sC,sbump ,sProt , and sn
repre-sent the rut signal, crack signal, bump signal, pothole signal, and noise, respectively. This paper mainly studies the characteristics of cracks and main profiles and how the crack to be separated from the main profile.
Since longitudinal main profile signal sProf is used to
calculate the international roughness index (IRI), it should not contain distress and noise. Therefore, it is ne-cessary to analyze the characteristics of sC and sProf and
separatesCfromfwithout destroyingsProf.
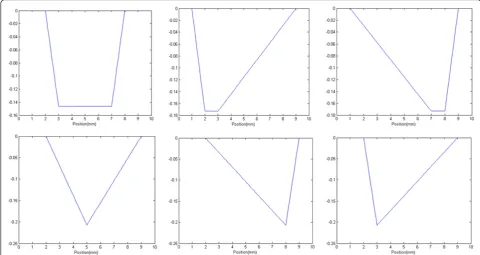
sC has the following characteristics: clear and sharp
edges, a direction below the horizontal surface, different narrow-scale shapes. In order to calculate the crack width and location accurately and achieve a good match with the shape of crack, we observed a large amount of crack data. Figure 5 clearly shows the basic shapes of crack, while most cracks perform asymmetrical form of these basic shapes due to the rain erosion, sand filling, etc.
sProf is a low-frequency curve as the red curve shown
in Figure 6, spreads over all the observing periods and performs to be the profile of pavement without distress and noise.
Figure 4Pavement profile signal.
Mixed over-complete dictionary
The success of sparse representation application depends on how to pick the suitable dictionary which is employed to sparsely describe the signal. Based on the difference be-tweensCand sProf, it is possible to detectsCand sProf by
performing two different transformations. That is to say, we try to find two dictionariesΦcandΦpin line with the
real signal to separate thesCandsProffromf.
The four-point curve is a function of a vectorx, which depends on four scalar parameters a, b, c, and d. As shown in Figure 7, this function is flexible, which can construct different shapes of the cracks using four-point
transform. The mathematical function model of the four-point curve is represented as follow:
f x;ð a;b;c;dÞ ¼
0;x≤a xa ba;a≤x≤b 1;b≤x≤c
dx
dc;c≤x≤d 0;d≤x 8 > > > > > > < > > > > > > :
9 > > > > > > = > > > > > > ;
ð5Þ
Certainly, we construct the over-complete dictionary Φc with four-point curve function which can efficiently
express the sharp edges and diversity of crack. The para-metersaanddlocate the“feet” of the trapezoid and the parameters b and c locate the “shoulders”. As for our work in this article, the scales (d– a) of the four-point curve range from 1 to 5 and the shifts are densely sampled from 0 to L– 1 for each scale, where L is the length of signal.
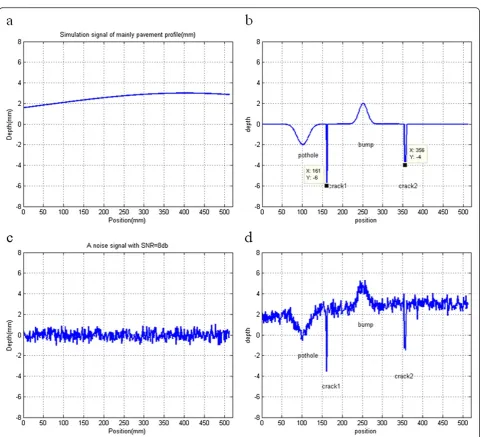
As shown in Figures 6 and 8a, exponential function with large-scale can construct main profile. The math-ematical function model of the exponential function could be represented as follow:
φkð Þ ¼t Akexp
tmk
nk
2!
k¼0;1;2; ð6Þ
wheremis the position information of exponential func-tion,nis the scale information,Ais a normalization fac-tor. Whenm and nchange in different areas separately, we can have different profiles. As for our work,mranges
The mixed over-complete dictionary
Mainly profile dictionary
Crack
Mainly profile
Remaining signal Crack feature
extraction with MP
Mainly profile reconstruction with MP
Crack dictionary
Figure 8The framework of the algorithm used in this paper.
from 0 toL–1, where L is the length of signal, and the nranges from 1 to 800.
Finally, the mixed over-complete dictionary Φis com-posed of exponential functionΦpand trapezoidal
mem-bership functionΦc, which can be denoted byΦ =Φp+
Φc , and all the atoms in over-complete dictionary are
normalized.
Signal separation by the matching pursuit method
The matching pursuit (MP) algorithm [21] iteratively projects a signal onto a given dictionary and chooses the dictionary atom that best matches the signal in each
iteration. We use this algorithm to decompose signal into sparse expression iteratively in the mixed over-complete dictionaryΦ. Figure.9 shows the framework of the algorithm based on MP used in this article. The more detailed algorithm is given below:
1. Initialization: Setk=1,S(0)= 0,R(0)=S,xck=0, where
kis the number of iteration,Sis the profile signal to be decomposed,Ris the residual signal during the iterations; the superscript is the iteration number;xck is the coefficients inΦc;δcminandδcmaxare the threshold of inner product between residual signal
Figure 10Comparison result of crack extraction.(a) Traditional method (b) The sparse representation method.
and each atom in crack dictionaryΦc;δpis the threshold of inner product between residual signal and each atom in crack dictionaryΦp
2. Crack feature extraction with MP:
2.1 -find the atom inΦcwith maximum inner product in each iteration, i.e. Rðk1Þ;Φ
cj
¼
sup Rðk1Þ;Φ c
,xck¼maxj Rðk1Þ;Φcj
where Φcjis thejth atom inΦc,xckis the coefficients. 2.2 -Ifδmin≤ Rðk1Þ;Φcj
≤δmax,Sk¼Sðk1Þþ xckΦck,Rð Þk ¼SSð Þk,k++, go to 2.1. Else, no
crack, go to Step3.
2.3 -Through step 2.1 and step 2.2,Scan be
expressed asS¼Sresidueþ
Xm
k¼1
xckΦckmis the
total number of iterations.
3. Main profile reconstruction with MP:
3.1 - Setk=1,Sresidue ¼S
Xm
k¼1 xckΦck,
Rð Þresidue0 ¼Sresidue
3.2 -ProjectSresidueon a dictionaryΦpand find the atom inΦpwith maximum inner product in each iteration, i.e. Rresidueðk1Þ;Φpj
¼
sup Rresidueðk1Þ;Φp
,xpk ¼
maxj Rresidueðk1Þ;Φpj
whereΦpjis thejth atom inΦp,xpkis the coefficients.
3.3 -If Rresidueðk1Þ;Φpj
≤δp,Sresiduek¼
Sresidueðk1ÞþxpkΦpk,Rð Þresiduek ¼SresidueSð Þresiduek ,k
++, go to 3.2. Else, go to step 4.
4. Finally,Scan be expressed as follow:
S¼X
m
k¼0
xckΦckþ
Xn
k¼0
xpkΦpkþσ,mis the iteration
number of crack feature extraction,nis iteration number of main profile reconstruction,σincludes noise and approximation error.
Experimental results
The following experiments are designed to examine the performance of the proposed approach for a good separ-ation of the crack and main profile.
Figure 12Comparison result of extracted crack accuracy.(a) Traditional method (b) The sparse representation method.
Table 1 Disease characteristic parameter of the left crack in Figure 8d (d)
Parameter Theoretical Value
Traditional method
Our method
Position(mm) 161 161 161
Width(mm) 4 6 4
Depth(mm) 6 1.896 6
Table 2 Disease characteristic parameter of the right crack in Figure 8d (d)
Parameter Theoretical Value
Traditional method
Our method
Position(mm) 356 357 356
Width(mm) 7 13 7
Comparison experiment with wavelet and median filtering method
In order to verify the effectiveness of our method, we construct the simulation signal of pavement profile. The simulation signal is presented in Figure 8d, where the profile is composed of main profile simulated by expo-nential function (Figure 8a), pavement distress (Figure 8b) and white Gaussian noise (SNR = 8db).
Figure 10a presents cracks obtained by wavelet and median filter method, where the db4 wavelet has been used to remove the profile noise and median filter has been used to extract the crack feature. Due to the limita-tion of this algorithm, the cracks in Figure 10a have dis-tortion, which also contains some information about main profile and noise. The processed crack output by sparse representation method is shown in Figure 10(b).
It is observed that cracks have clearly been detected by sparse representation method.
Figure 11 presents main profile extraction results. From Figure 11, it can be seen that the main profile in Figure 11a have distortion, which will affect the results of the subsequent calculation of IRI. The processed main profile output by sparse representation method is shown in Figure 11b. It is observed that this method can not only remove the noise, but also maintain the shape of original main profile well.
Figure 12, Table 1 and Table 2 presents extracted crack accuracy result. From Figure 12, Table 1 and Table 2 it can be seen that both methods can check the location of cracks accurately, but traditional method cannot detect the width and depth accurately.
From the above experiment results, it is clear that the sparse representation method outperforms the wavelet and median filtering method not only in crack detection and main profile reconstruction but also a good separ-ation between crack and main profile.
Comparison experiment with wavelet and Gabor dictionary
We also did comparison experiment with wavelet and Gabor dictionary. The experimental parameters of the wavelet method are as follows: the db4 wavelet has been used to extract crack and make seven-layer wavelet de-composing; The parameters of Gabor dictionary are as follows: grð Þ ¼t p1ffiffisg tsu cosðvtþwÞ is the functional form, γ = (s,u,v,w) = (aj,pajΔu,ka−jΔv,iΔw) is time-frequency parameters of Gabor atom, in whicha= 2,Δu = 1/2, Δv = π, Δw = π/6, 0 <j ≤ log2N, 0 <p ≤ N2−j+1,
0 <k≤2j+1,0≤i≤12; Figure 13 presents cracks obtained Figure 13Comparison result of extracted crack accuracy.
from Figure 8 d) by wavelet and Gabor dictionary and Figure 14 is an enlarged image of two cracks in Figure 13.
From Figures 13 and 14, it can be seen that the cracks detected by wavelet method and Gabor dictionary have distortion, which will affect the results of the subsequent main profile. It is observed that Gabor dictionary can match triangular shape of the crack very well, but when it detects trapezoidal shape of the crack, the match re-sult is not good.
Experiment result of actual pavement crack
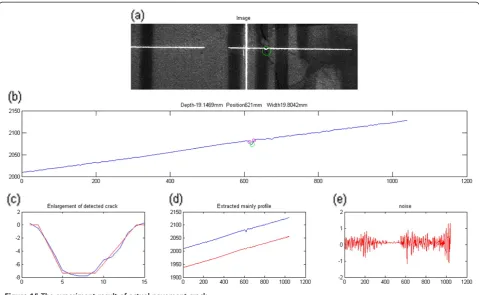
The experiment was carried out to examine the efficiency of the proposed technique for crack detection and main profile reconstruction. From Figure 15a, we can see that the horizontal light deforms when it encounters crack. After this image is processed by center coordinates ex-traction, calibration, we can obtain the profile of the pave-ment. As shown in Figure 15b, this profile includes main profile, noise, and pavement crack. Then we adapt the sparse representation method to the profile signal to ex-tract the features of crack and reconstruct the main pro-file. From Figure 15c, we can see that this method not only detects the location of crack accurately, but also matches the shape of crack very well. Figure 15d shows the reconstructed main profile by sparse representation method, in which the blue line is the original profile
signal and the red line is the reconstructed main profile without crack and noise. From Figure 15d, we can see that the reconstructed main profile not only removes the crack without destroying the main profile, but also retains the original profile information.
In order to verify the consistency between the crack shape extracted by our algorithm and the actual crack shape, we use waveform similarity to evaluate our method. Assuming that the actual crack waveform is x Figure 15The experiment result of actual pavement crack.
(t), the crack waveform extracted by our algorithm isy (t), similarityRcan be expressed as:
R¼ X
x tð Þ y tð Þ
½
ffiffiffiffiffiffiffiffiffiffiffiffiffiffiffiffiffiffiffiffiffiffiffiffiffiffiffiffiffiffiffiffiffiffiffiffiffiffiffi X
x tð Þ2Xy tð Þ2
q ð7Þ
We captured 39 images with cracks randomly, and use sparse representation method to extract cracks. Experi-ment result was shown in Figure 16. From Figure 16, we can see that similarities R are all concentrated between 0.94 and 1, and the extracted crack waveform is good consistency with actual waveform.
Accuracy experiment
In the area of pavement crack detection, crack location and width are the two important indicators. So the pur-pose of our experiment is to verify the accuracy of the extracted crack location and width with our method. As shown in Figure 17, we processed an adjustable gauge block with different groove width (4, 6 and 8mm, the ac-curacy is 0.1mm), to simulate the pavement cracks with different width (4, 6 and 8mm). The experiment was
divided into two groups. We made the opening direction of groove parallel with the longitudinal direction of pavement in one group, i.e. let the transverse laser stripe project onto the groove of gauge block. In the other group, we made the opening direction of groove parallel with the transverse direction of pavement, i.e. let the longitudinal laser stripe project onto the groove of gauge block. Then the 3D laser scanning system is used to de-tect the groove of gauge block with the speed of 80km/h and the results are shown in Table 3. From Tables 3 and 4, we can see that, whether with the transverse or the longitudinal laser stripe, our method can detect the loca-tion and width of crack accurately, the indicaloca-tion error is not greater than 1mm.
Conclusions
In this article, a novel method based on sparse represen-tation is developed to detect pavement cracks and re-construct the main pavement profile. The key for cracks separation from main profile is based on the features of the mixed over-complete dictionary, which consists of two kinds of atoms, one for crack representation and an-other for main profile representation. In this study, Figure 17Accuracy experiment of crack detection (a) gauge block (mm) (b) experimental image.
Table 3 The first group of experiment accuracy with longitudinal direction
The first group Direction The true position(mm)
The detected position(mm)
The true width(mm)
The detected width(mm)
Indication Error(mm)
1 Longitudinal 449 449 4 4.2856 0.2856
2 Longitudinal 430 430 4 4.2593 0.2593
3 Longitudinal 393 393 6 5.7726 −0.2274
4 Longitudinal 298 298 6 5.6775 −0.3225
5 Longitudinal 270 270 8 8.9032 0.9032
6 Longitudinal 228 228 8 8.2566 0.2566
7 Longitudinal 193 193 8 8.1504 0.1504
8 Longitudinal 180 180 6 6.2302 0.2302
9 Longitudinal 234 234 6 5.8847 −0.1153
atoms of trapezoidal membership function are adopted to represent crack, and exponential function for main pavement profile. Compared to the wavelet and median filtering method, the cracks extracted by our method can match the shape of crack very well, which cannot damage the information of the main profile signal. Some outdoor and accuracy experiments were conducted and promising results were obtained, showing that this method cannot only detect the position of pavement crack efficiently and achieve a good separation of crack from pavement profile, but also reconstruct main profile very well. Because MP is very time consuming when the greedy exhaustive search in the whole huge over-complete dictionary adopted and it is still a challenging problem. In the future work, we will use computer grid technology to improve computational efficiency.
Competing interests
The authors declare that they have no competing interests.
Acknowledgments
This study was supported by International S&T Cooperation Project of China (2007DFB30320).
Author details
1Harbin Institute of Technology, School of Electrical Engineering and
Automation, Harbin, Heilongjiang, China150001.2School of Computing, University of Eastern Finland, Box 111FIN-80101, Joensuu, Finland.
Received: 8 March 2012 Accepted: 31 July 2012 Published: 30 August 2012
References
1. T. Fukuhara, K. Terada, M. Nagao, A. Kasahara, S. Ichihashi, Automatic pavement-distress-survey system. ASCE J. Transport. Eng.116(3), 280–286 (1990)
2. J. Zhou, P.S. Huang, F.P. Chiang, Wavelet-based pavement distress detection and evaluation. Opt. Eng.45(2), 1–10 (2006)
3. G. Wang, X.W. Xu, L. Xian, A.Z. He, Algorithm based on the finite ridgelet transform for enhancing faint pavement cracks. Opt.Eng.47(1), 1–10 (2008) 4. R. Copp, Field test of three video distress recognition systems, inProc.
automated pavement distress data collection Seminar(, Iowa, 1990), pp. 12–15 5. L. Bursanescu, M. Hamdi, Three-dimensional laser ranging image
reconstruction using three-line laser sensors and fuzzy methods. Proc. SPIE. 3835, 106–117 (1999)
6. H.D. Cheng, J.R. Chen, C. Glazier, Y.G. Hu, Novel approach to pavement cracking detection based on fuzzy set theory. Comput. Civ. Eng.13(4), 270–280 (1999) 7. C. Kelvin, P. Wang, W.S. Gong, Automated pavement distress survey: a
review and a new direction, inProc. on pavement evaluation conference (, Virginia, 2002), pp. 21–25
8. K.H. Mcghee, Automated pavement distress collection techniques-a synthesis of highway practice, inReport for national cooperative highway research program(synthesis 334), transportation research board of the national academies(, 2004), pp. 11–14
9. H. Zakeri, An optimum feature extraction method based on wavelet-radon transform and dynamic neural network for pavement distress classification. Expert. Syst. Appl.38(8), 9442–9460 (2011)
10. Y.C. Tsai, V. Kaul, Critical assessment of pavement distress segmentation methods. J. Transport. Eng.136(1), 11–19 (2010)
11. L. Bursanescu, M. Bursanescu, M. Hamdi, Three-dimensional infrared laser vision system for road surface features analysis. Proc SPIE4430, 801–808 (2001) 12. Y. Si-Jie, R. Sreenvias, Sukumar, 3D reconstruction of road surfaces using an
integrated multi-sensory approach. Opt. Lasers Eng.45(7), 808–818 (2007) 13. F. Zhou, G. Zhang, Complete calibration of a structured light stripe vision sensor through planar target of unknown orientations. Image. Vis. Comput. 23(1), 59–67 (2005)
14. L. Bursanescu, Automated pavement distress data collection and analysis: a 3-D approach, inProc. Int. Conf. On recent advances in 3-D digital imaging and modeling(, Ottawa, Canada, 1997), pp. 311–317
15. J. Laurent, D. Lefebvre, E. Samson, Development of a new 3D transverse laser profiling system for the automatic measurement of road cracks, inProc. 6th Int. Symp. on Pavement Surface Characteristics(, Portoroz, Slovenia, 2008) 16. J. Laurent, High performance 3D sensors for the characterization of road
surface defects, inProc. IAPR workshop on machine vision applications(, Nara, Japan, 2002), pp. 388–391
17. J. Laurent, Road surface inspection using laser scanners for the high precision 3D measurements of large flat surfaces, inInternational Conference on Recent Advances in 3-D Digital Imaging and Modeling(, Ottawa, Canada, 1997), pp. 303–310
18. L. Daudet, Sparse and structured decompositions of signals with the molecular matching pursuit. IEEE Trans. Audio Speech Lang. Process14(5), 1808–1816 (2006)
19. J. Tropp, Greed is good: algorithmic results for sparse approximation. IEEE Trans. Inform. Theory50(10), 2231–2242 (2004)
20. M. Aharon, M. Elad, A. Bruckstein, K-SVD: An algorithm for designing overcomplete dictionaries for sparse representation. IEEE Trans. Signal. Process.54(11), 4311–4322 (2006)
21. S. Mallat, Z. Zhang, Matching pursuit with time-frequency dictionaries. IEEE Trans. Signal Process41(11), 3397–3415 (1993)
doi:10.1186/1687-6180-2012-191
Cite this article as:Sunet al.:Pavement crack characteristic detection based on sparse representation.EURASIP Journal on Advances in Signal Processing20122012:191.
The second group
Direction The true position(mm) The detected position(mm) The true width (mm) The detected width(mm) Indication error(mm)
1 Transverse 141 141 6 6.5002 0.5002
2 Transverse 127 127 6 6.8589 0.8589
3 Transverse 141 141 6 5.9583 −0.0417
4 Transverse 101 101 6 6.067 0.067
5 Transverse 143 143 6 6.3648 0.3648
6 Transverse 145 145 6 5.4348 −0.5652
7 Transverse 147 147 6 6.2089 0.2089
8 transverse 157 157 8 8.3092 0.3092
9 Transverse 180 180 8 8.2698 0.2698