Research Article
Channel Characterization and Robust Tracking for
Diversity Reception over Time-Variant Off-Body Wireless
Communication Channels
Patrick Van Torre,
1, 2Luigi Vallozzi,
1Hendrik Rogier,
1Marc Moeneclaey,
3and Jo Verhaevert
21Information Technology Department (INTEC), Ghent University, St. Pietersnieuwstraat 41,
9000 Ghent, Belgium
2Hogeschool Gent, INWE Department, Schoonmeersstraat 52, 9000 Gent, Belgium
3Department of Telecommunications and Information Processing (TELIN), Ghent University,
St. Pietersnieuwstraat 41, 9000 Ghent, Belgium
Correspondence should be addressed to Patrick Van Torre,[email protected]
Received 29 January 2010; Revised 25 May 2010; Accepted 5 July 2010 Academic Editor: Markus Rupp
Copyright © 2010 Patrick Van Torre et al. This is an open access article distributed under the Creative Commons Attribution License, which permits unrestricted use, distribution, and reproduction in any medium, provided the original work is properly cited.
In the 2.45 GHz band, indoor wireless off-body data communication by a moving person can be problematic due to time-variant signal fading and the consequent variation in channel parameters. Off-body communication specifically suffers from the combined effects of fading, shadowing, and path loss due to time-variant multipath propagation in combination with shadowing by the human body. Measurements are performed to analyze the autocorrelation, coherence time, and power spectral density for a person equipped with a wearable receive system moving at different speeds for different configurations and antenna positions. Diversity reception with multiple textile antennas integrated in the clothing provides a means of improving the reliability of the link. For the dynamic channel estimation, a scheme using hard decision feedback after MRC with adaptive low-pass filtering is demonstrated to be successful in providing robust data detection for long data bursts, in the presence of dramatic channel variation.
1. Introduction
The safety of rescue workers can be improved by smart textiles that allow a data communication system to be inte-grated into their garment. Textile antenna systems provide a convenient means for unobtrusive integration that does not disturb the movements of the rescue worker. The structure of the patch antennas used, with a ground plane near the body, limits the radiation exposure of the body and the influence of the body on the radiation pattern of the antenna. Operations are often performed indoors, where dramatic signal fading occurs due to multipath propagation. Given the rapid move-ments by rescue workers in combination with the multipath fading of the indoor environment and the shadowing by the human body, the channel seen by the multiantenna system varies rapidly in time. Often short bursts are used to counter this problem. However, this introduces a significant overhead
caused by the retransmission of the necessary preambles for each burst.
The measurements presented in this paper are performed in the same environment where earlier measurements for off-body communication, documented in [1,2], indicated Rayleigh-distributed small-scale fading. The rapid fluctua-tions over larger distance scales are caused by both small-scale fading and shadowing. The cumulative distribution function and level crossing rate in these cases fitted to the Nakagami distribution. Measurements were performed deploying two textile antenna patches integrated in a gar-ment on the human body, using short data bursts and treating the channel as time-invariant.
the rescue worker and capturing longer time frames, subject to very significant variations of the channel behavior in time. In [1,2], no such drastic channel variation occurred during the same received burst. Important parameters of the time-varying off-body communication channel, such as autocorrelation, coherence time, and power spectral density, are determined. The values are shown to be influenced by walking speed as well as antenna location on the body. Measurements are performed for line-of-sight (LoS) and Non line-of-sight (NLoS) situations.
Diversity techniques, using multiple antennas, are widely known to combat the effects of fading. At the receiving side, maximal ratio combining (MRC) is used to combine signals from different antennas. To use MRC effectively, an accurate channel estimation is necessary at all times. Channel estimation can be performed using a series of pilot symbols. In previous publications [1, 2], the transmitted bursts are kept short, allowing the channel to be treated as invariant for the duration of the burst. However, as each separate burst needs to contain a number of pilot symbols, a significant overhead is introduced, limiting the effective data throughput.
For the measurements presented, long data bursts con-taining one million data symbols and lasting over one second are transmitted. During this transmission time, the channel is definitely not invariant when communicating with a walking person; therefore, a robust system of dynamic channel tracking is needed. As we prefer a minimal overhead, decision oriented feedback is used to perform real-time channel tracking. Using this method, no extra pilot symbols are needed. The channel parameters vary stochastically during the data burst, and, moreover, the signals contain a level of additive white Gaussian noise. The channel tracking is robust thanks to the receive diversity and the applied adaptive filtering.
In literature, the performance of body-to-body commu-nication systems at GHz frequencies in indoor environments is characterized based on channel sounding in [3].
Studies of the bit error rate (BER) performance with channel estimation errors and diversity combining in fading channels are published in [4]. Characterizations of the indoor propagation channel have been treated before in many other publications. However, the focus of these publications is different.
Many papers on off-body communication characterize the channel, based on signal levels without performing any actual data transmission [5–14]. Some of the references document the behavior of fixed wireless interfaces with the channel variation occurring due to moving scatterers [15]. Others are based on simulations [4,16–21] or calculations [22–24] and not on measurements. Channel conditions for TETRA mobile radio use in forests were documented in [25]; however, this environment has different propagation properties. Recent work on robust estimation of time-varying channels using various methods to adapt equaliz-ers or filtequaliz-ers was presented in [16–22]. These theoretical contributions are very valuable, but their aim is different from the goal of this paper: to investigate the performance of a robust tracking algorithm in an actual measurement
scenario, involving a time-variant channel observed over a time period much longer than the channel coherence time. An actual transmission of data also accounts for deformation or bending of the wearable antennas due to movements of the wearer. This is not captured by the theoretical contributions.
We believe that in none of the cases listed the channel exhibits equally drastic variations during the continuous communication of data on the physical level, with a moving person and without overhead by frequent repetition of pilot signals as is the case in the experiments described in this paper. The techniques used for a successful transmission of data relate to channel estimation, detection, decision, robust tracking, filtering, and feature extraction of nonstationary signals. The paper also documents a performance analysis for the application of these techniques.
The paper is organized as follows. In Section 2, the textile antenna system is outlined and more details about the transmission scheme are provided. Section 3 describes the measurement environment andSection 4the results, includ-ing the signal-to-noise ratios, phase behavior accordinclud-ing to path length, autocorrelation, coherence time, and power spectral density.Section 5describes the diversity reception of the signals. For demodulation and detection of the signal, decision-oriented feedback followed by an adaptive low-pass filter is used to gradually adapt the estimated channel param-eters during the reception of the data bursts, allowing error-free detection of the transmitted data. The advantages of using decision-oriented feedback after MRC are illustrated.
2. Textile Antenna System
2.1. Description of the Antennas. At the transmitting base station, a quarter-wavelength monopole antenna with linear polarization is used. The transmitting antenna is oriented vertically for all measurements and situated 2 m above the floor level. At the receiving side, which consists of a moving test person equipped with the wearable textile system, four circularly polarized textile patch antennas are employed. Antennas similar to the ones used in the measurement campaign were presented in literature [1] before.
The practical use of textile antennas is most convenient when they are integrated into clothing. As this can be accomplished conveniently and unobtrusively, the integra-tion of such an antenna system into a rescue worker’s garment is nonhindering for the operations to be performed. Moreover, as the antennas are mounted underneath the outer combined thermal and moisture barrier layer, they are protected from the environment. In these conditions, the antennas do not become really wet but still the effect of the relative humidity in the firefighter suit on textile antennas is studied in [26]. The main conclusion is that the performance in conditions of high humidity is stable and satisfactory when a substrate material with a small moisture regain is chosen, as is the case for the antennas used in the following measurements.
1 4
2 3
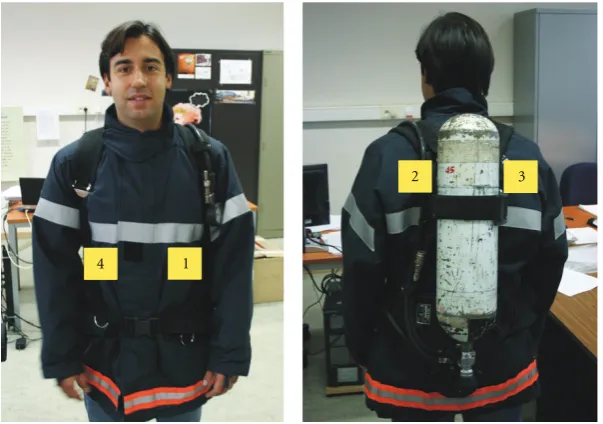
Figure1: Position of the 2.45 GHz circularly polarized textile patch antennas integrated into the fireman’s garment.
received signal is undetermined due to the multiple reflec-tions in the environment. A circularly polarized receiving antenna can capture the impinging signals regardless of their angle of polarization.
A picture of the firefighter and the position of the antennas is shown inFigure 1. The antennas are mounted underneath the two outer layers of the jacket, being a thermal and moisture barrier and an outer protective layer.
The wearable antenna consists of a rectangular-ring microstrip-patch antenna on a low-profile substrate, com-pletely made out of breathable textile materials. A patch antenna such as the one considered represents the most suitable antenna type for wearable applications, since its low profile allows integration into a garment, and the ground plane prevents absorption of the antenna radiation by the wearer’s body.
Moreover, the rectangular-ring topology permits to cover a bandwidth that is larger than required for communica-tion in the ISM band, allowing to account for resonance frequency shifts due to geometry inaccuracies.
The larger bandwidth also provides extra margin for the influence of the textile layers of the garment and bending of the antenna. The patch and the ground plane are made out of FlecTron, which is a high-conductivity electrotextile material with a sheet resistivity smaller than 0.1Ω/sq. The substrate consists of a flexible, fire-retardant, shock-absorbing, and moisture-repellent foam, which is commonly employed in rescue workers’ protective garments. The design was optimized by means of the ADS-Momentum EM field simulator. The geometry of the antenna, together with the optimized parameters’ values, is shown inFigure 2.
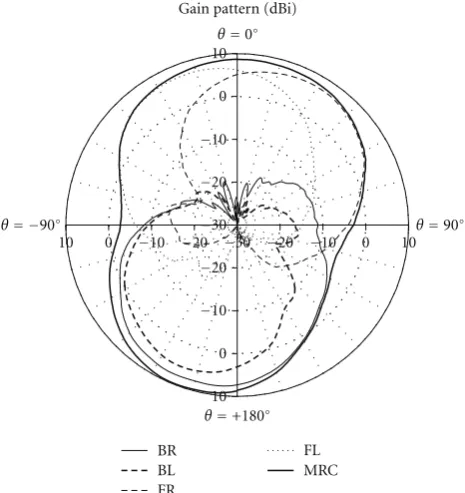
The radiation patterns of the antennas, mounted inside the garment and worn by the firefighter, are displayed in Figure 3.
In the broadside direction, the individual antennas exhibit a gain of up to 8 dBi. The structure of the antenna,
l
l L
w
w W
W yfeed
yfeed
xfeed
xfeed
Foam substrate Conductive material Connector
Patch (mm)
L 52 48
15
5.55
1.19 9
0.003 12
Substrate
8 h (mm)
tanδ εr
Figure 2: Topology and dimensions of the 2.45 GHz circularly polarized wearable patch antenna.
with the ground plane oriented towards the body, causes most energy to be radiated away from the body. Therefore, these textile antennas provide a larger gain and a lower radiation exposure to the body when for example compared to monopole antennas. As stated earlier, the use of textile antennas is most convenient when integration into clothing is possible.
The radiation patterns for the front and back antennas are very complementary as they cover totally different areas around the body. The patterns for both front antennas are partially overlapping but slightly offset due to the shape of the front torso; therefore, the set of two front antennas covers a wider angle than each antenna on its own.
The combined pattern after applying MRC is plotted by adding the received powers for each of the four antennas and for each azimuth angle. The complete antenna system shows a positive gain in dBi over 255◦of azimuth range.
2.2. Transmitted Signals. The communication link is estab-lished by means of a Signalion HaLo430 wireless testbed, consisting of a transmitter and receiver able to interface with Matlab. Baseband in-phase and quadrature samples, gener-ated in Matlab, are applied to the Halo430 transmitter, which performs D/A conversion and upconversion to the 2.45 GHz ISM band. The Halo430 receiver performs downconversion to baseband and A/D conversion. The resulting received baseband samples are processed in Matlab, where matched filtering, synchronization, channel estimation and tracking, MRC, and data detection are carried out.
For all measurements the data are transmitted in quadra-ture phase shift keyed (QPSK) bursts at a rate of 1 MSymbols per second and a bit rate of 2 Mbit/s. The transmitted power is 100 mW for the NLoS measurements and 1 mW for the LoS measurements. Each transmitted burst consists of 300 pilot symbols followed by 106 data symbols making the total burst last a little over one second. Bursts are sent continuously, separated by a 12 ms break.
3. Measurement Description
3.1. Measurement Scenario for a Walking Fireman. The measurements are performed in an indoor environment, in the same location as earlier measurements documented in
[1,2]. A floor plan of the area in an office at Ghent University
is shown in Figure 4. The building consists of reinforced concrete floors and very solid brick walls. The interior includes metal cupboards, contributing to the degree of multipath propagation. The measurements were performed during normal working hours, with many people moving around and contributing to the time-variant character of the channel.
When the firefighter walks around in such a building, the received signals experience time-variant small-scale fading, shadowing, and path loss. The paths followed by the firefighter during the measurements are marked on the floor plan, as well as the position of the transmitter. The transmitted power is 100 mW.
3.2. NLoS Measurements. For path 1, the rescue worker is walking sideways at about 0.5 m/s, along a path perpen-dicular to the direction of the transmitter, at up to 45 m distance from the transmitter. As can be seen in the floor plan (Figure 4, path 1), this is the hardest receiving path.
Path 2 is also oriented perpendicularly, at a distance of 32 m. Signal-to-noise ratios are slightly higher there. Measurements along this path have been performed at walking speeds of
(2a)≈0.5 m/s (slowly walking) and
(2b)≈1 m/s (walking with a good pace).
10
10 0
0 −10
−10 −20
−20 −30 −30
−20 −20
−10 −10
0 0
10 10
Gain pattern (dBi)
θ=0◦
θ= −90◦ θ=90◦
θ=+180◦
BR BL FR
FL MRC
Figure3: Radiation patterns of four circularly polarized antennas mounted into the garment and worn by the firefighter. The antenna locations are listed in the legend: back right (BR), back left (BL), front right (FR) and front left (FL). The curve labeled MRC displays the combined power over the four antennas (the gain of the smart antenna system after applying MRC); a positive gain in dBi is realized over 255◦of azimuth range.
Path 3 is located in the hall, and the firefighter is running away from the transmitter now, at speeds of
(3a)≈0.5 m/s (slowly walking),
(3b)≈1 m/s (walking with a good pace), and (3c)≈2 m/s (running).
The speeds are estimated they correspond to slowly walking, walking with a good pace, and running. Care has been taken to approximate the desired speeds as good as possible by counting seconds and step sizes.
3.3. LoS Measurements. Two LoS measurements are per-formed to assess the difference between signals arriving in direct LoS and multipath scattered signals. The transmitted power is lowered to 1 mW here, to avoid overdriving the input amplifiers of the receiver.
Along path 1, the transmitter is placed in position B. The firefighter is starting in position A and walking towards the transmitter at approximate speeds of
(1c)≈0.5 m/s (1d)≈1 m/s
4. Measurement Results
Path 1
dfrom TX=45 m
Path 2
d=32 m
Path 3
d=18 m
TX
h=2 m A
B
C D
E F
120.002sanitair14.08
m
2
UG
(2.01A)
120.003
ve
rb
ru
ikslokaal
7.11
m
2
TW07(2.02) 120.001traphal 23.06
m
2
UG(2.01) 120.004berg
ing
15.03
m
2
TW07(2.03)
0 0.5 1 1.5 2 0
2 4 6 8 10 12 14 16
Time (s)
SNR
(dB)
1. Front left antenna 2. Back left antenna
3. Back right antenna 4. Front right antenna
Figure5: SNR of signals received by the walking firefighter at 45 m distance from the transmitter (path 1, NLoS, 0.5 m/s)
of time along a NLoS path,Figure 4, path 1. The plot covers 1.66 seconds of receiving time, including the one second data burst that is demodulated. The graph clearly illustrates the serious signal fading experienced. Variations in the range of 10 dB occur frequently during the one second burst. Multiple bursts were received, all displaying similar behavior. From the graphs, it is also apparent that the signals from the four antennas are complementary, as they fluctuate partially independently over time. Fading minima will generally not occur at the same time for all antennas.
4.2. Phase and Path Length. Figure 6displays the unwrapped phaseφnrof the signals in radians, relative to the initial phase
at the start of the one second burst. Note that the absolute value of the phase change is undetermined as the frequency offset between the transmit and receive local oscillators is estimated by means of pilot symbols (the burst consists of 300 pilot symbols, followed by 106data symbols) which were subjected to an unknown Doppler shift.
The frequency offset, estimated by means of the pilot symbols, is the result of the combination of the Doppler shift and the slowly changing frequency offset of the local oscillators in the transceivers. However, as the receiver’s channels are all synchronous, the unknown constant added todφnr/dtis equal for each receiver channelnr.
The phase variation after one second is also an indication of the difference in propagation path length for the different antennas over this time interval because of movement. In case the propagation clusters involved stay similar and assuming one of these clusters is dominant, a phase change of 2π radians corresponds to one wavelength difference in the length of the propagation path. Therefore, path length difference is calculated as Δs = λ· Δφ/2π, with Δφ the phase change during the one second burst andλ=12.24 cm at f = 2.45 GHz. The variations in path length for the different measurements are listed inTable 1. The signal with
0 200 400 600 800 1000
−30 −20 −10 0 10 20
φn
r
(r
ad)
(ms)
1. Front left antenna 2. Back left antenna
3. Back right antenna 4. Front right antenna
Figure6: Unwrapped phaseφnrof signals received at 45 m distance
(path 1, NLoS, 0.5 m/s). Due to the frequency offset between transmitter and receiver, an unknown constant phase variation is added, for the synchronous hardware used this added constant is equal for all channels.
Table1: Relative changes in path length for the different receiving antennas during the 1 second burst. Larger values correspond to a higher increase in signal path length.
Path Speed Δs(cm) for antenna nr. (m/s) 1 (F) 2 (B) 3 (B) 4 (F)
NLoS
1 0.5 19.53 74.92 69.67 0 2a 0.5 13.37 29.94 29.23 0 2b 1 0 91.95 82.53 30.47 3a 0.5 0 93.33 88.09 1.50 3b 1 0 125.43 162.30 23.66 3c 2 12.47 227.49 199.47 0 LoS 1c 0.5 0 119.89 66.47 82.00
1d 1 12.95 135.78 151.42 0
minimum path length difference after 1 second is taken as a reference (0). The larger values inTable 1 correspond to the antennas associated with a higher increase in signal path length.
The values tend to be more in the same range for antennas on the same side of the body; antennas (1, 4) versus (2, 3). The relative phase change is substantially different for antennas on the front and back of the body, indicating that signals arrive via a significantly different propagation path.
and, despite the walls in the signal path, the dominant signal components apparently arrive from the direction of the transmitter. The lower values for the front antennas suggest reflected signals from the adjacent offices, which is very probable, taking into account the directional radiation pattern of the antennas and the shadowing of the body. Note that theΔsvalues are relative, with the smallest value for any of the four antennas set to zero as a reference.
In a LoS situation, despite the anomaly for antennas 3 and 4 in path 1c (presumably caused by the presence of more than one dominant propagation path during the time of the burst), the results for path 1c and 1d show a similar behavior. However, as the fireman is now walking towards the transmitter, the larger values result again for the back antennas 2 and 3. These antennas are oriented away from the transmitter, with the direct path blocked by the body, and hence they receive their signals via an increasingly longer reflected path. The most probable reflector in this case is the right wall in the floor plan.
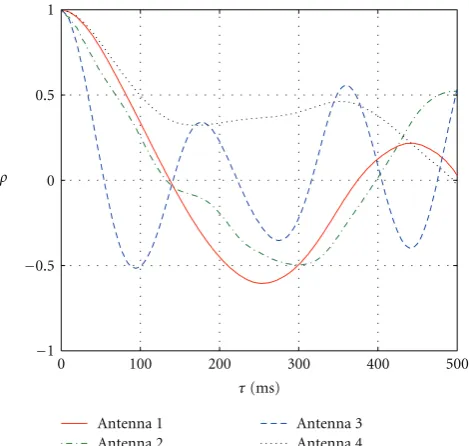
4.3. Autocorrelation and Coherence Time. The autocorrela-tion funcautocorrela-tion is used to calculate the coherence time of the channel and the power spectral density of the signal. Since there is a significant DC component in the signal envelope r(t), we calculate the autocovariance instead, as suggested in [28]
ρr(τ)= r(t+τ)·r(t) − r(t)r(t+τ). (1)
The result for path 1 is displayed in Figure 7, after normalization with respect to the maximum value ofρr(τ).
The coherence timeTC of the channel is calculated as
the time shift for which the autocovariance of the measured channel amplitude reduces to 0.7 [29, page 15].
The results for the measurements are listed inTable 2. Assuming the time-variance of the channel is due to the movement of the firefighter only, the coherence time can also be calculated based on the maximum Doppler shift fm
fm=v· f
c =
v·2.45·109Hz 3·108m/s ,
Tc=
9 16π f2
m
= 0.423 fm .
(2)
The calculated values for the approximate walking speeds are listed inTable 3.
The duration of the data burst is in the order of 20 times the calculated coherence time of the channel for a normal walking speed of 1 m/s. However, comparing the values in Tables 2 and 3, the coherence time for the measurements is approximately half the calculated value for a given speed. This is an indication of rich time-variant multipath propagation, with many reflectors and scatterers spread across the environment, and with the contribution of each of these individual elements changing along the length of the path. The relation between speed and coherence
0 100 200 300 400 500
−1 −0.5 0 0.5
τ(ms) ρ
Antenna 1 Antenna 2
Antenna 3 Antenna 4
Figure7: Normalized amplitude autocovariance of signals received at 45 m distance (path 1, NLoS, 0.5 m/s). Colors and antenna numbers are as in the previous figure.
Table2: Coherence time for measured channels.
Path nr. Speed TC(ms) for Channel (m/s) 1 2 3 4
NLoS
1 0.5 34 17 22 33 2a 0.5 42 60 34 58 2b 1 26 28 37 32 3a 0.5 34 31 32 37
3b 1 15 3 30 9
3c 2 15 17 23 14 LoS 1c 0.5 31 46 26 57 1d 1 22 16 18 25
Table3: Calculated maximum Doppler frequency and coherence time for the approximate walking speeds.
Speed (m/s) fm(Hz) Tc(ms)
0.5 4.09 103.6
1 8.17 51.8
2 16.34 25.9
time is not always apparent for each individual antenna and measurement situation. The measurement environment, including shadowing and scattering by people moving around in the building, is too complex to always obtain a clear relation between the two factors.
Figure 8displays the evolution of the channel estimates
−0.01
−0.01 0
0.01
0.01 −0.02
0
Channel 1
−0.01 0 0.01
−0.01 0.01
0
Channel 2
−0.01 0 0.01
Channel 3
5
0
−5 10 ×10−3
−0.01 0 0.01
−0.01 0.01
0
Channel 4
Figure8: Evolution of the complex channel estimate during one second, for signals received at 45 m distance (path 1, NLoS, 0.5 m/s).
A diversity receiving system used in these circumstances needs to track these changes in amplitude and phase accurately to achieve a successful diversity combination of the signals and subsequent data detection.
4.4. Power Spectral Density for a LoS Path. The power spectral density (PSD) is calculated as the Fourier transform of the envelope’s autocovariance (1) function [28, pages 119–123]
Se
f=
∞
−∞ρr(τ)e
−j2π f τdτ. (3)
InFigure 9, the PSD is displayed for a measurement in
a LoS situation, to determine the behavior as a function of the degree of multipath propagation. The plot is limited to −20· · ·+ 20 Hz because the components outside that frequency range are attenuated by at least 20 dB. The PSD is normalized with respect to the maximum. The DC component is not shown.
Along path 1 the firefighter (position A inFigure 4) is walking towards the transmitter which is placed at position B specifically for this measurement. The fireman walks in a straight line at≈1 m/s and all antennas are moving at the same speed but experience different channel behavior.
The figure clearly reveals a larger frequency spread for the signals from the back antennas, compared to the front antennas. While the front antennas have a direct LoS
0
10 20
−40 −30
−20 −20
−10 −10
0 Frequency (Hz)
1. Front left antenna 2. Back left antenna
3. Back right antenna 4. Front right antenna 2 m/s 1 m/s0.5 m/s 0.5 m/s 1 m/s 2 m/s
10
log[
Se
(
f
)
/Se
(
f
)max
]
Figure 9: Power spectral density for the firefighter with four antennas in a LoS situation (path 1, LoS, 1 m/s; TX in B, RX in A).
to the transmitter, the back antennas receive their signals mainly through scattered reflections resulting in a higher Doppler spread. The vertical lines in the graphs display the maximum Doppler shift fm calculated for the movement
10 20 −40
−30
−20 −20
−10 −10
0 Frequency (Hz)
1 m/s 0.5 m/s
10
log[
Se
(
f
)
/Se
(
f
)max
]
−50
Figure 10: Power spectral density for the firefighter at varying speeds along path 2 (sideways, NLoS). The power densities of the four antennas are summed in the frequency domain.
4.5. Power Spectral Density for a NLoS Path. The PSD is also studied in the NLoS situations. We refer to the floor plan, Figure 4, to describe the paths walked by the firefighter.
(i) Path 2 at≈0.5 and 1 m/s.
(ii) Path 3 at≈0.5, 1 and 2 m/s.
For practical reasons, the measurement at 2 m/s can only be performed in the hall because of the larger space needed for a running firefighter. The resulting PSD for path 2 is displayed
inFigure 10.
Signals are again recorded for the four patch antennas, but for clarity the signals for the same measurement are displayed as one characteristic (the power densities for the four antennas are summed in the frequency domain and normalized with respect to the maximum). The PSD for the measurements along path 3 is shown inFigure 11.
The PSD is wider for each increase in speed. However, the effect is not as large as for the measurement along path 2. Given the environmental conditions in the hall area, the propagation is likely to be determined by one dominant cluster, resulting in less Doppler spread for a given walking speed.
5. Diversity Reception
Despite the difficult channel conditions described in the previous sections, demodulation and detection of the signals is possible using a straightforward system for dynamic channel tracking. As no complex processing is needed, this system can be implemented at real time in a compact low-cost low-power battery operated system.
The channel tracking is performed by means of hard decision oriented feedback, as outlined inFigure 12.
10 20
−40 −30
−20 −20
−10 −10
0 Frequency (Hz)
1 m/s 0.5 m/s
10
log[
Se
(
f
)
/Se
(
f
)max
]
−50
2 m/s
Figure 11: Power spectral density for the firefighter at varying speeds along path 3 (the hall, NLoS). The power densities of the four antennas are summed in the frequency domain.
Initial channel estimation based on pilot symbols:h
Adapt channel estimate using appropriate filtering MRC signal combining
Channel re-estimation using MRC data symbols, by means of decision
oriented feedback:hd
Figure12: Flowchart of the decision-oriented feedback with MRC.
Working symbol per symbol and by using the instanta-neous channel information, a decision is made about which symbol was transmitted. Ideally, with a correct decision and without the presence of noise, the complex channel estimate can now be calculated. However, there is always the possibility of a decision error, because of noise or interference.
Moreover, even with a correct decision, the presence of noise will downgrade the accuracy of the instantaneous channel information.
The MRC received signal is calculated symbol per symbol as
rMRC(n) =
h(n)∗·r(n)
h(n)·h(n)H, (4)
with r(MRCn) a complex scalar for the received data, h(n) a row vector containing the instantaneous complex channel estimates corresponding to the four receiving ports andr(n) a column vector containing the received samples on the four ports (after matched filtering and decimation). The superscripts•(n),•∗,•T, and•H denote the time index, the
complex conjugate, the matrix transpose and the conjugate matrix transpose, respectively.
The complex plane quadrant ofrMRC(n) will determines(n), the QPSK symbol upon which is decided. The instantaneous channel estimates are now calculated as
hnew(n)= r(n)T
s(n). (5)
Because of the presence of noise and potential decision errors for s(n), the channel information should only be gradually upgraded. An adaptive IIR low-pass filter can reduce both influences. The channel information vectorh(n) is then updated each microsecond as
h(n+1)=1−w(n)◦h(n)+w(n)◦hnew(n)
, (6)
with n the time index and◦ the entry wise product. The vector w(n) contains weight factors for the filter, which are adapted according to the rate of change in amplitude observed during the last millisecond for each channel. This observation time is an order of magnitude smaller than the coherence time for the channel.
With X(nnr) a vector containing the 103 most recent
amplitudes for receiver channel nr, corresponding to 1 ms
time, the elements w(nnr) of the weight vector w(n) are also
updated each microsecond for each channelnras
w(nnr)=μ·
maxX(nnr)−minX
(n)
nr
X(nnr)
, (7)
to anticipate for faster variations.X(nnr)is the average
ampli-tude for channelnrduring the last millisecond,μis a constant
scalar factor to scale the weights.
The 10%–90% rise time of the filter is calculated as a function of the weightwn(nr)by means of theZ-transform for
the filter equation, with a unit step function as input. For wn(nr) < 0.1 the rise time, expressed in μs, is approximated
accurately astr=2.1383/w(nnr).
For the NLoS measurement along path 1, the filter coefficients vary in the range 2.4·10−3· · ·6.2·10−2. The scale factor was set toμ=0.01, corresponding to rise times in the range 35· · ·891μs(or symbols, at 1 Msymbols/s). The rise time of the filter has to be an order of magnitude shorter
−1
−1 −0.5
−0.5 0
0 0.5
0.5 1
1
Quadr
atur
e
In-phase
Figure13: Scatter plot for 106symbols of the MRC signal (path 1,
NLoS, 0.5 m/s) demonstrates error-free reception of the complete data burst.
than the coherence time of the channel to track the variations accurately enough to obtain a reliable data detection.
The accuracy of the phase, in particular, is critical in an MRC diversity receiving system as it determines the orientation of the different received constellations to be constructively combined. An accurate orientation of the constellations is of paramount importance, especially when combining noisy signals. Large phase errors lead to decision errors in the data detection process, even without the presence of noise. Small phase errors will increase the susceptibility of the decision process to noise.
The resulting scatter plot inFigure 13corresponds to one million symbols received error free along path 1, after MRC. Path 1 is the path at 45 m from the transmitter, with the lowest signal-to-noise ratio. The adaptive low-pass filtering performs very well in tracking the variation of the channel parameters. Without tracking, a correct demodulation is only possible during a time in the order of magnitude of the channel’s coherence time, which corresponds to 1/20 of the burst’s duration.
To illustrate the importance of receiver diversity with MRC, scatter plots for the signals on each of the four input ports separately are also presented for the same measurement, inFigure 14. These plots clearly illustrate the importance of receiver diversity, as the scatter plots for each single channel are much worse than the MRC scatter plot.
−2 −2
0
0 2 −5−5
0
0 5
−5 0 5
−5 0 5
Channel 3
−2 2
−2 0
0
2 Channel 4
Figure14: Scatter plots for 106symbols of the four input signals after channel tracking (recorded along path 1, NLoS, 0.5 m/s) show the
substantial channel variation during the transmission of the data burst.
Table4: BERs for a number of NLoS situations; for each individual antenna and for the (MRC) combined signal. Channel tracking always on the MRC signal.
Channel BER for Path nr.
1 2a 2b 3a
1 4.9·10−4 4.3·10−5 5.9·10−3 0
2 1.7·10−2 2.1·10−5 0 4.2·10−5
3 1.2·10−2 1.0·10−2 5.0·10−7 6.5·10−6
4 1.7·10−5 5.7·10−2 2.5·10−3 5.0·10−3
MRC 0 0 0 0
up in 103 parts and yield 103subsequent scatter plots, each corresponding to a 1 millisecond part of the transmission. In these 103scatter plots, the variance of the channel can be neglected, and therefore interpretation is then similar to a scatter plot for an AWGN channel. However, in this set of scatter plots obtained, the SNR visible in the constellation would change from plot to plot according to the channel variation.
The scatter plot inFigure 14is for all time instants, for some of them the SNR is good and for others not.
Table 4lists the results of the demodulation and detection
for the recorded signals along the different paths inFigure 4. BERs are shown for the individual signals and for the (MRC) combined signal.
Table5: BERs for a number of NLoS situations without diversity. Channel tracking on the input signals.
Channel BER for Path nr.
1 2a 2b 3a
1 5.1·10−4 4.9·10−5 6.4·10−3 0
2 2.0·10−1 2.6·10−5 0 4.9·10−1
3 2.0·10−1 7.1·10−1 5.0·10−7 1.2·10−5
4 1.6·10−5 2.8·10−1 2.2·10−1 8.8·10−1
MRC 5.0·10−6 1.6·10−4 0 3.2·10−1
It is important to note that the channel tracking is always based on the MRC signal for this table. After MRC, a correct data detection is achieved in all recorded cases.
These values are for uncoded data transmissions. The reason for the higher BERs inTable 5is that after a period of low SNR, the system sometimes resynchronizes erroneously. An event of bad resynchronization occurs when the system synchronizes on a rotated version of the QPSK constellation. For an uncoded data transmission this error is undetectable. Note that the BER for the MRC signal in Table 5 is sometimes worse than for some of the individual channels used in the signal combining. A continuously accurate channel estimate is of paramount importance for successful MRC. Specifically a case of bad resynchronization after a drop in SNR, followed by a substantial rise in signal level, is detrimental to the MRC, as the erroneously synchronized information will at that moment have a dramatic impact on the resulting combined signal. For the system with channel tracking after MRC, the probability of such an event is very low as this requires simultaneous deep fades of the signal on all four receiving channels.
In case of a coded transmission, the code structure can be exploited to improve the channel tracking, as not all bit sequences can occur. This applies to improving resynchroni-zation for systems with diversity as well as without diversity.
6. Conclusions
For a wireless data link in the 2.45 GHz ISM band, with diversity reception by means of textile antennas on a moving person in a multipath environment, the channel parameters vary dramatically. The measurements reveal important chan-nel parameters such as coherence time, maximum Doppler frequency, and power spectral density. These parameters are demonstrated to depend on the walking speed, the environment and the position of the antennas on the body.
Specifically for LoS situations, the antennas oriented away from the transmitter are associated with a higher Doppler spread, indicating that the signals are mainly received by reflection in the environment.
For non-LoS situations, the measurements indicate a higher Doppler spread for a given speed when richer multi-path propagation is present.
Based on the relative phase change for the different antennas during the movement, interesting conclusions are drawn concerning the nature of the propagation paths involved, without the need to perform extensive channel sounding measurements.
The use of decision oriented feedback allows channel tracking without sacrificing throughput for pilot symbols. In the diversity-receiving system, the decision oriented feedback is performed based on the decisions after MRC. The filter strategies used perform well in the conditions of the experiment, resulting in an error-free data detection.
Acknowledgments
This work was supported by the Fund for Scientific Research-Flanders (FWO-V) by Project “Advanced space-time process-ing techniques for communication through multiantenna systems in realistic mobile channels” and by the Postdoctoral Fellowship of H. Rogier.
References
[1] P. Van Torre, L. Vallozzi, C. Hertleer, H. Rogier, M. Moeneclaey, and J. Verhaevert, “Dynamic link performance analysis of a rescue worker’s off-body communication system using integrated textile antennas,”IET Science, Measurement and Technology, vol. 4, no. 2, pp. 41–52, 2010.
[2] L. Vallozzi, P. Van Torre, C. Hertleer, H. Rogier, M. Moeneclaey, and J. Verhaevert, “Wireless communication for firefighters using dual-polarized textile antennas integrated in their garment,”IEEE Transactions on Antennas and Propaga-tion, vol. 58, no. 4, pp. 1357–1368, 2010.
[3] Y. Wang, I. B. Bonev, J. ∅. Nielsen, I. Z. Kovacs, and G. F. Pedersen, “Characterization of the indoor multiantenna body-to-body radio channel,”IEEE Transactions on Antennas and Propagation, vol. 57, no. 4, pp. 972–979, 2009.
[4] L. Cao and N. C. Beaulieu, “Bit error rate analysis of hybrid selection/maximal-ratio diversity combining with channel estimation error,” inProceedings of IEEE Global Telecommuni-cations Conference (GLOBECOM ’04), pp. 446–451, December 2004.
[5] S. L. Cotton and W. G. Scanlon, “Measurements, modeling and simulation of the off-body radio channel for the imple-mentation of bodyworn antenna diversity at 868 MHz,”IEEE Transactions on Antennas and Propagation, vol. 57, no. 12, pp. 3951–3961, 2009.
[6] S. L. Cotton and W. G. Scanlon, “Channel characterization for single- and multiple-antenna wearable systems used for indoor body-to-body communications,”IEEE Transactions on Antennas and Propagation, vol. 57, no. 4, pp. 980–990, 2009. [7] K. I. Ziri-Castro, W. G. Scanlon, and N. E. Evans, “Indoor
radio channel characterization and modeling for a 5.2-GHz body worn receiver,”IEEE Antennas and Wireless Propagation Letters, vol. 3, no. 1, pp. 219–222, 2004.
[8] G. A. Conway, S. L. Cotton, and W. G. Scanlon, “An antennas and propagation approach to improving physical layer performance in wireless body area networks,” IEEE Journal on Selected Areas in Communications, vol. 27, no. 1, pp. 27–36, 2009.
[9] Y. Ouyang, D. J. Love, and W. J. Chappell, “Body-worn distributed MIMO system,” IEEE Transactions on Vehicular Technology, vol. 58, no. 4, pp. 1752–1765, 2009.
[10] I. Khan, P. S. Hall, A. A. Serra, A. R. Guraliuc, and P. Nepa, “Diversity performance analysis for on-body communication channels at 2.45 GHz,” IEEE Transactions on Antennas and Propagation, vol. 57, no. 4, pp. 956–963, 2009.
[11] A. A. Serra, P. Nepa, G. Manara, and P. S. Hall, “Diversity measurements for on-body communication systems,” IEEE Antennas and Wireless Propagation Letters, vol. 6, pp. 361–363, 2007.
[12] I. Khan and P. S. Hall, “Multiple antenna reception at 5.8 and 10 GHz for body-centric wireless communication channels,”
IEEE Transactions on Antennas and Propagation, vol. 57, no. 1, pp. 248–255, 2009.
[13] D. Psychoudakis, G. Y. Lee, C.-C. Chen, and J. L. Volakis, “Estimating diversity for body-worn antennas,” inProceedings of the 3rd European Conference on Antennas and Propagation (EuCAP ’09), pp. 704–708, March 2009.
Communications, vol. 4, no. 3, pp. 253–264, 2010.
[16] C. Mehlf¨uhrer and M. Rupp, “A robust MMSE equalizer for MIMO enhanced HSDPA,” inProceedings of the 40th Asilomar Conference on Signals, Systems, and Computers (ACSSC ’06), pp. 129–133, November 2006.
[17] B.-S. Chen and J.-F. Liao, “Adaptive MC-CDMA multiple channel estimation and tracking over time-varying multipath fading channels,”IEEE Transactions on Wireless Communica-tions, vol. 6, no. 6, pp. 2328–2337, 2007.
[18] S. Galli, “A new family of soft-output adaptive receivers exploiting nonlinear MMSE estimates for TDMA-based wire-less links,”IEEE Transactions on Communications, vol. 50, no. 12, pp. 1935–1945, 2002.
[19] H. Min, C. Xiang, Z. Shidong, and W. Jing, “Low-complexity subspace tracking based channel estimation method for OFDM systems in time-varying channels,” inProceedings of IEEE International Conference on Communications (ICC ’06), pp. 4618–4623, July 2006.
[20] S. Bhashyam and B. Aazhang, “Multiuser channel estimation and tracking for long-code CDMA systems,”IEEE Transactions on Communications, vol. 50, no. 7, pp. 1081–1090, 2002. [21] Y. Yapici and A. ¨O. Yilmaz, “Low-complexity iterative
chan-nel estimation and tracking for time-varying multi-antenna systems,” inProceedings of IEEE International Symposium on Personal, Indoor and Mobile Radio Communications (PIMRC ’09), pp. 1317–1321, September 2009.
[22] S.-Y. Leong, J. Wu, C. Xiao, and J. C. Olivier, “Fast time-varying dispersive channel estimation and equalization for an 8-PSK cellular system,” IEEE Transactions on Vehicular Technology, vol. 55, no. 5, pp. 1493–1502, 2006.
[23] R. Annavajjala and L. B. Milstein, “On the performance of diversity combining schemes on Rayleigh fading channels with noisy channel estimates,” inProceedings of IEEE Military Communications Conference (MILCOM ’03), pp. 320–325, October 2003.
[24] J. Akhtman and L. Hanzo, “Decision directed channel estima-tion employing projecestima-tion approximaestima-tion subspace tracking,” inProceedings of the 65th IEEE Vehicular Technology Conference (VTC ’07), pp. 3056–3060, April 2007.
[25] I. Z. Kov´acs, P. C. F. Eggers, K. Olesen, and L. G. Petersen, “Radio channel description and quality of service for TETRA direct mode operation in forest environments,” inProceedings of the 54th IEEE Vehicular Technology Conference (VTC ’01), pp. 1970–1974, October 2001.
[26] C. Hertleer, A. van Laere, H. Rogier, and L. van Langenhove, “Influence of relative humidity on textile antenna perfor-mance,”Textile Research Journal, vol. 80, no. 2, pp. 177–183, 2010.
[27] G. C. Crumley, N. E. Evans, W. G. Scanlon, J. B. Burns, and T. G. Trouton, “The design and performance of a 2.5-ghz telecommand link for wireless biomedical monitoring,”IEEE Transactions on Information Technology in Biomedicine, vol. 4, no. 4, pp. 285–291, 2000.
[28] R. Janaswamy, Radiowave Propagation and Smart Antennas for Wireless Communications, Kluwer Academic Pubublishers, Dordrecht, The Netherlands, 2001.