International Journal of Nanomedicine
Dovepress
O r I g I N a l r e s e a r c h
open access to scientific and medical research
Open access Full Text article
Flow cytometry for intracellular sPION
quantification: specificity and sensitivity
in comparison with spectroscopic methods
ralf P Friedrich,1 christina
Janko,1 Marina Poettler,1
Philipp Tripal,1 Jan Zaloga,1
Iwona cicha,1 stephan
Dürr,1,2 Johannes Nowak,3
stefan Odenbach,3 Ioana
slabu,4 Maik liebl,4 lutz
Trahms,4 Marcus stapf,5
Ingrid hilger,5 stefan lyer,1
christoph alexiou1
1Department of Otorhinolaryngology,
head and Neck surgery, section of experimental Oncology and Nanomedicine, University hospital erlangen, 2Department
of Otorhinolaryngology, head and Neck surgery, section of Phoniatrics and Pediatric audiology, University hospital erlangen, erlangen,
3Technische Universität Dresden,
chair of Magnetofluiddynamics, Measuring and automation Technology, Dresden, 4Physikalisch-Technische
Bundesanstalt Berlin, Berlin,
5Department of radiology, Division
of Diagnostic and Interventional radiology, experimental radiology, University hospital Jena, Jena, germany
Abstract: Due to their special physicochemical properties, iron nanoparticles offer new promising possibilities for biomedical applications. For bench to bedside translation of super-paramagnetic iron oxide nanoparticles (SPIONs), safety issues have to be comprehensively clarified. To understand concentration-dependent nanoparticle-mediated toxicity, the exact quantification of intracellular SPIONs by reliable methods is of great importance. In the present study, we compared three different SPION quantification methods (ultraviolet spectropho-tometry, magnetic particle spectroscopy, atomic adsorption spectroscopy) and discussed the shortcomings and advantages of each method. Moreover, we used those results to evaluate the possibility to use flow cytometric technique to determine the cellular SPION content. For this purpose, we correlated the side scatter data received from flow cytometry with the actual cel-lular SPION amount. We showed that flow cytometry provides a rapid and reliable method to assess the cellular SPION content. Our data also demonstrate that internalization of iron oxide nanoparticles in human umbilical vein endothelial cells is strongly dependent to the SPION type and results in a dose-dependent increase of toxicity. Thus, treatment with lauric acid-coated SPIONs (SEONLA) resulted in a significant increase in the intensity of side scatter and
toxicity, whereas SEONLA with an additional protein corona formed by bovine serum albumin
(SEONLA-BSA) and commercially available Rienso® particles showed only a minimal increase in
both side scatter intensity and cellular toxicity. The increase in side scatter was in accordance with the measurements for SPION content by the atomic adsorption spectroscopy reference method. In summary, our data show that flow cytometry analysis can be used for estimation of uptake of SPIONs by mammalian cells and provides a fast tool for scientists to evaluate the safety of nanoparticle products.
Keywords: low cytometry, side scatter, intracellular superparamagnetic iron oxide nanopar-ticles, quantification, spectroscopy
Introduction
Superparamagnetic iron oxide nanoparticles (SPIONs) are becoming increasingly important for various applications in technology and medicine. They are particularly useful for many diagnostic applications, such as T2-weighted magnetic resonance imaging of the lymph nodes, liver, intestines, and cardiovascular system, as well as for the treatment of anemia.1–3 Consequently, these nanoparticles will not only be released
into the environment, but will also inevitably come in contact with the human body.4–6
In order to reliably estimate the possible effects of SPIONs on living organisms, it is crucial to find appropriate models to determine the toxicity and biocompatibility of these particles. In vitro models are reliable tools to investigate their effects on cells. Apart from their physicochemical properties, the internalization and/or binding of correspondence: christoph alexiou
Department of Otorhinolaryngology, head and Neck surgery, section of experimental Oncology and Nanomedicine, else Krüner-Fresenius-stiftung-Professorship, University hospital erlangen, glückstrasse 10a, 91054 erlangen, germany
Tel +49 913 1853 4769 Fax +49 913 1853 4828 email [email protected]
Journal name: International Journal of Nanomedicine Article Designation: Original Research
Year: 2015 Volume: 10
Running head verso: Friedrich et al
Running head recto: Quantification of cellular SPIONs with flow cytometry DOI: http://dx.doi.org/10.2147/IJN.S82714
International Journal of Nanomedicine downloaded from https://www.dovepress.com/ by 118.70.13.36 on 23-Aug-2020
For personal use only.
Number of times this article has been viewed
This article was published in the following Dove Press journal: International Journal of Nanomedicine
Dovepress Friedrich et al
nanoparticles to cells is an important determinant of nano-particle toxicity.
Several existing techniques, including transmission electron microscopy (TEM), cryogenic TEM, confocal microscopy, and fluorescence microscopy, are able to visualize the localization of particles within cells and enable us to understand the inter-nalization process and track the fate of nanoparticles within cells.7–9 Although these methods are appropriate to detect
single particles or particle agglomerates, their drawback is the lack of ability to efficiently quantify the amount of particles within a sample of several hundred thousand cells, which is required for a reliable quantification.
At present, several methods of SPION quantification are in use, including ultraviolet spectrophotometry (UVS), magnetic particle spectroscopy (MPS), and atomic adsorption spectroscopy (AAS).10–13 However, those methods are
time-consuming, and in case of MPS and AAS, cost-intensive. Hence, a method that offers simultaneous measurement of the cellular nanoparticle content and a rapid estimation of nanoparticle toxicity would be of great benefit. Flow cytometry is a promising technique that might fulfill these demands. This method allows simultaneous determination of multiple parameters, so that information about cell number, size, granularity, markers of cellular apoptosis and necrosis, plasma membrane integrity, membrane potential, and DNA content can be collected in parallel.14,15 Moreover, previous
reports have shown a correlation between flow cytometric side scatter data and increasing cellular amounts of metal and metal oxide nanoparticles.16–19 Also, the parallel readout of
additional parameters (production of reactive oxygen spe-cies, DNA damage) has already been reported.19 Thus, this
approach can be very useful to simultaneously assess the direct relationship between nanoparticle uptake and cellular toxicity. However, no trials to determine the absolute cellular amount of different SPION types have been performed by this method so far.
We therefore evaluated the possibility of using flow cytometric side scatter data to quantify the cellular SPION-load in primary human endothelial cells. For that purpose, we investigated three types of iron oxide nanoparticles with different physicochemical properties and different coating, which are likely to affect cellular uptake. We found a good correlation between cellular SPION amounts, as quantified by established methods (UVS, MPS, and AAS), and the side scatter data, which provides evidence that use of flow cytometry is not only suitable for toxicity studies, but also offers a reliable method to simultaneously determine the cellular SPION content.
Materials and methods
Nanoparticles
Lauric acid (LA)-coated SPIONs (SEONLA) and lauric
acid/albumin hybrid-coated SPIONs (SEONLA-BSA) were
synthesized at the Section of Experimental Oncology and Nanomedicine (SEON), University Hospital Erlangen, as previously described.20 In brief, SEONLA were
synthe-sized by coprecipitation of iron (III) chloride and iron (II) chloride under an argon atmosphere in alkaline medium and subsequent in situ coating with lauric acid. To produce SEONLA-BSA, SEONLA particles were added to a freshly
pre-pared 20% bovine serum albumin solution and incubated for 30 minutes under constant stirring. After purification and concentration by centrifugal ultrafiltration (molecular weight cut-off 100 kDa; KrosFlo® Research IIi tangential
flow filtration system, Spectrum Laboratories, Rancho Dominguez, CA, USA) the particles were sterilized by filtration through a 0.22 μm membrane filter. SPION stock concentrations were 4.19 μgFe/mL for SEONLA-BSA
and 9.49 μgFe/mL for SEONLA. Rienso® (Ferumoxytol,
30 μgFe/mL; superparamagnetic iron (III)-oxide cores coated with a small-sized carbohydrate shell of polyglucose sorbitol carboxymethylether [PSC]) was purchased from Takeda, London, UK. SPION concentrations used in the text always refer to the iron content and were specified either as μgFe/mL medium or cell lysate, μgFe/cm2 plate surface or pg
Fe/cell.
characterization of sPIONs
For TEM, samples were prepared by adding 25 μL of diluted SPION solution (final iron concentration 25 μgFe/mL) on top of a copper grid. Samples were imaged by TEM (Philips CM 300 UT, Eindhoven, the Netherlands) at an acceleration voltage of 300 kV. Particle core size was measured from transmission electron micrographs using ImageJ image processing software (National Institutes of Health, Bethesda, MD, USA).
For Fourier transform infrared (FTIR) analysis, 3 mL of the respective SPION suspension were frozen in a -80°C freezer and then freeze-dried overnight. FTIR spectra of the lyophilized samples were recorded with a Bruker Alpha FTIR spectrometer operated in attenuated total reflection mode from 4,000 cm-1 to 400 cm-1 with a step size of 0.5 cm-1.
Hydrodynamic sizes and zeta potentials of the nanopar-ticle aggregates were determined with a Zetasizer Nano ZS (Malvern Instruments, Malvern, UK). The respective SPION suspensions were diluted to a final total iron concentration of 25 μgFe/mL. As dispersants, either cell culture medium (Roswell Park Memorial Institute 1640, Life Technolo-gies, Darmstadt, Germany) or Millipore water were used.
International Journal of Nanomedicine downloaded from https://www.dovepress.com/ by 118.70.13.36 on 23-Aug-2020
Dovepress Quantification of cellular SPIONs with flow cytometry
Size measurements were performed in triplicate and zeta potential measurements in hexaplicate.
Stability of the nanoparticles in complex physiological fluids was evaluated using cell culture medium (Endothelial Cell Growth Medium, PELOBiotech, Planegg, Germany) or sheep blood obtained from Fiebig-Nährstofftechnik (Idstein Niederauroff, Germany). Sheep blood was anticoagulated with ethylenediaminetetraacetic acid at a concentration of 1.5 mg/mL.21 To gain information about possible
agglom-eration of nanoparticles caused by media or sheep blood, the fluids were mixed with SPIONs (2.62 mgFe/mL H2O) at a 2:1 ratio. The presence of agglomerates was subsequently determined macroscopically and microscopically using a digital camera and an optical bright-field microscope, respectively.
cell culture and sample preparation
Primary human umbilical vein endothelial cells (HUVECs) were purchased from PromoCell (Heidelberg, Germany). In all experiments, HUVECs pooled from four donors were used at passage 3–5, which corresponds to 12–20 cell divisions. HUVECs were cultivated without antibiotics in enhanced Endothelial Cell Growth Medium from PELOBiotech at 37°C and 5.0% CO2. For further passaging, trypsinization was per-formed using the Subculture Reagent kit from PELOBiotech according to the manufacturer’s instructions.
For experiments, 3.2×10⁵ HUVECs were seeded into
25 cm² cell culture plates. After 24 hours, SPIONs (SEONLA,
SEONLA-BSA, and Rienso®) were added to a final
concentra-tion of 0, 10, 20, 30, 40, 50, and 100 μgFe/mL cell culture medium, which corresponds to a 0, 2.4, 4.8, 7.2, 9.6, 12, and 24 μgFe/cm2 cell culture plate area. Thus, the correlation
between the SPION concentration in cell culture medium and on the plate surface area was kept constant for all experiments. Cells were incubated with SPIONs for another 48 hours, followed by harvesting. The cell pellets were resuspended in 1 mL of phosphate-buffered saline. Cell suspensions were used to determine the absolute cell counts and viability with the MUSE® cell analyzer
(Merck-Milli-pore, Billerica, MA, USA), as well as for flow cytometry analysis. Remaining cells were subsequently used for SPION quantification measurements using UVS, MPS, or AAS techniques.
Quantification of SPIONs in cell lysates
Defined cell numbers (4×10⁵) were collected by
cen-trifugation (5 minutes, 1,000 g, 4°C). The cell pellet was lysed with 100 μL of 10% sodium dodecyl sulfate (Roth,
Karlsruhe, Germany) and stored at -20°C until further use. After thawing, the cell lysates were agitated (1,400 rpm) for 5 minutes at 95°C and immediately vortexed at high power to crop genomic DNA. Afterward, the cell lysates were incubated for 1 hour in an ultrasonic bath to ensure a homo-geneous suspension of the SPIONs within the cell lysate. SPION standards (0, 0.5, 1.0, 1.5, 2.0, 5.0, 10, 15, 20, and 50 μgFe/mL) were prepared in 10% sodium dodecyl sulfate and in untreated cell lysate solutions.
Ultraviolet spectrophotometry
The UVS quantification of the SPION amount was modified after Dadashzadeh et al and performed by measuring the optical density at 370 nm (OD370).22 In detail, 50 μL of cell
lysate (2×10⁵ cells) and SPION standards were pipetted into
96-well plates (Techno Plastic Products AG, Trasadingen, Switzerland) and the OD370 was measured in a spectropho-tometer (FilterMax F5, Molecular Devices, Sunnyvale, CA, USA). Standard dilutions of SPIONs enabled an absolute quantification of the iron nanoparticle concentration in the cell lysates. As the amount of cells was quantified before cell lysis, the SPION concentration was subsequently normalized to the cell number.
Magnetic particle spectroscopy
The amount of SPIONs accumulated in the cells was deter-mined with MPS. The method is based on the nonlinear part of the magnetic susceptibility response of magnetic nanopar-ticles to an oscillating magnetic field. As a result, MPS is a sensitive detection method that allows quantification of the magnetic nanoparticle iron content without being affected by cells or suspension medium. For MPS quantification, 25 μL of cell lysate (1×10⁵ cells) were pipetted in MicroAmp
fast reaction tubes (Life Technologies) and analyzed by MPS (MP-Spectrometer, Bruker, Germany).
atomic absorption spectroscopy
The absolute iron content was determined by flame AAS using an AAS 5 FL spectrometer (Analytik Jena AG, Germany). Before measurement, 25 μL cell lysate (1×10⁵
cells) samples were incubated for 24 hours with 32% HCl (v/v, extra pure, Carl Roth GmbH, Germany) and mixed roughly multiple times to allow complete sample disso-ciation. To remove proteins possibly interfering with the iron determination, a protein precipitation step using 10% trichloroacetic acid (w/v, Carl Roth GmbH) was performed, followed by centrifugation at 3,600 g for 5 minutes. The resulting supernatant was transferred to a new vial and used
International Journal of Nanomedicine downloaded from https://www.dovepress.com/ by 118.70.13.36 on 23-Aug-2020
Dovepress Friedrich et al
for iron measurements. For calibration of the device and later quantification of the sample’s iron content, a calibration curve was prepared with defined iron concentrations ranging from 0 to 50 μmolFe/L. If the iron concentration measured in a sample exceeded the range of the prepared calibration curve, the sample was diluted using double-distilled H2O and remeasured.
Analysis of HUVECs using flow
cytometry
Flow cytometry was performed using a Gallios cytofluorometer (Beckman Coulter, Fullerton, CA, USA) in order to analyze cell morphology (forward scatter and side scatter), cell viability, and in particular to quantify the cellular SPION content. For cell death analysis, 50 μL aliquots of cell suspension were incubated with 250 μL of freshly prepared staining solution containing 1 μg/mL Annexin V-fluorescein isothiocyanate, 1 μg/mL Hoechst 33342, and 5.1 μg/mL 1,1′,3,3,3′,3′-hexamethylindodicarbocyanine iodide [DiIC1(5)] (all from Life Technologies), and 20 μg/mL propidium iodide (Sigma-Aldrich, St. Louis, MO, USA) in Ringer’s solution (Baxter Healthcare, Zurich, Switzerland) for 20 minutes at 4°C.15
Side scatter was extracted from the flow cytometric measurements after gating on phenotypically healthy cells, characterized by Annexin V-negative and propidium iodide-negative staining. The side scatter values from the raw data of the untreated control cells was set to 100% and the side scatter increase of the nanoparticle-treated cells was calcu-lated accordingly. Counting beads were not added into the vials to avoid unspecific binding to the cells and unspecific side scatter increases. Every sample was measured for a fixed time (60 seconds). Detected amounts of cells (events) were dependent on treatment of the cells due to reduced prolifera-tion and cell death. Thus, flow cytometry provides relative cell counts (events).
For analysis of the cell cycle and DNA degradation, a fur-ther 200 μL of the cell suspensions were fixed by adding 3 mL of 70% (v/v) ice-cold ethanol and stored at -20°C for further processing. The cells were then centrifuged (5 minutes, 1,000 g, 4°C), the supernatant was removed, and the cells were washed with phosphate-buffered saline once. The cells were resus-pended in 0.5 mL of phosphate-buffered saline, and 0.5 mL of DNA extraction buffer (192 mL of 0.2 M Na2HPO4, 8 mL 0.1% Triton X-100 (v/v), pH 7.8) was added and incubated for 5 minutes at room temperature. Cells were centrifuged (5 minutes, 1,000 g, 4°C), the supernatant was removed, and the cells were resuspended in 1 mL of propidium iodide-Triton X DNA staining solution (50 μg/mL propidium iodide in water and 1 mg/mL sodium citrate, 0.1% Triton X-100 (v/v)) and incubated for 30 minutes in the dark.23
Electronic compensation was used to eliminate bleed through fluorescence. The data analysis was performed with Kaluza software version 2.0 (Beckman Coulter). All flow cytometry analyses were conducted in three independent experiments, each with triplicate samples.
Results
characterization of sPIONs
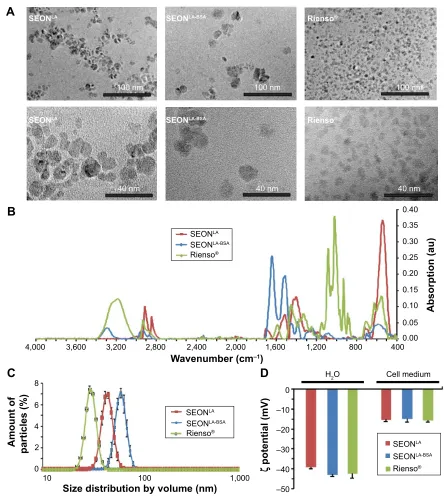
As the nanoparticle size can affect cellular uptake, we first determined the size distribution of the SPIONs using TEM. Interestingly, we found only minimal differences in the average size of single SEON cores (approximately 11 nm), whereas cores of the Rienso® particles were significantly
smaller (5.8 nm, Table 1; Figure S1A).
The chemical structures of all three samples were ana-lyzed with FTIR (Table 1, Figure S1B). The Fe-O peak at 550 cm-1 was visible in all spectra. The spectra of SEONLA
contained the distinctive peaks for the C-H vibrations of lauric acid from 2,957 cm-1 to 2,844 cm-1 as well as the
carbonyl group stretch vibration at 1,698 cm-1 which was
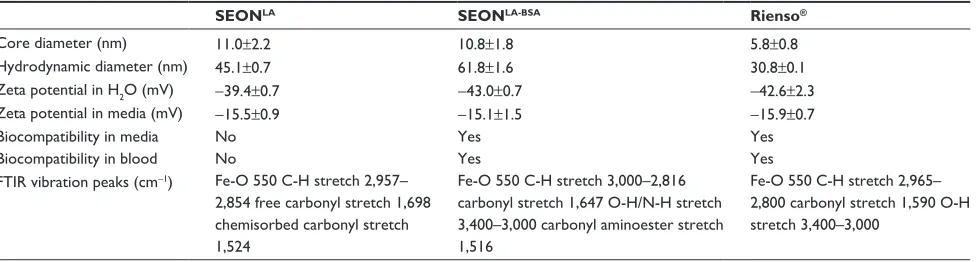
Table 1 Biophysical properties of superparamagnetic iron oxide nanoparticles
SEONLA SEONLA-BSA Rienso®
core diameter (nm) 11.0±2.2 10.8±1.8 5.8±0.8
hydrodynamic diameter (nm) 45.1±0.7 61.8±1.6 30.8±0.1
Zeta potential in h2O (mV) -39.4±0.7 -43.0±0.7 -42.6±2.3
Zeta potential in media (mV) -15.5±0.9 -15.1±1.5 -15.9±0.7
Biocompatibility in media No Yes Yes
Biocompatibility in blood No Yes Yes
FTIr vibration peaks (cm-1) Fe-O 550 c-h stretch 2,957–
2,854 free carbonyl stretch 1,698 chemisorbed carbonyl stretch 1,524
Fe-O 550 c-h stretch 3,000–2,816 carbonyl stretch 1,647 O-h/N-h stretch 3,400–3,000 carbonyl aminoester stretch 1,516
Fe-O 550 c-h stretch 2,965– 2,800 carbonyl stretch 1,590 O-h stretch 3,400–3,000
Note: summary of measured biophysical properties of seONla, seONla-Bsa, and rienso® particles.
Abbreviations: FTIr, Fourier transform infrared; seONla, lauric acid-coated nanoparticles; seONla-Bsa, lauric acid/albumin bovine serum hybrid-coated nanoparticles.
International Journal of Nanomedicine downloaded from https://www.dovepress.com/ by 118.70.13.36 on 23-Aug-2020
Dovepress Quantification of cellular SPIONs with flow cytometry
partially shifted to lower wavenumbers (1,524 cm-1), possibly
due to chemisorption onto the particle surface. SEONLA-BSA
exhibited an infrared spectrum with rather broad -OH and -NH stretch vibration peaks above 3,000 cm-1 and dominant
carbonyl and carbonyl aminoester peaks at 1,647 cm-1 and
1,516 cm-1, respectively. These results were consistent with
previous findings.20 The spectrum of Rienso® showed typical
broad C-H vibration (2,965–2,800 cm-1), -OH stretch
vibra-tion (3,400–3,200 cm-1) patterns and a distinct carbonyl peak
at 1,590 cm-1, all most likely belonging to the PSC.
In distilled water, the hydrodynamic diameter of 45.1 nm (SEONLA), 61.8 nm (SEONLA-BSA), and 30.8 nm (Rienso®) was
determined (Table 1; Figure S1C), indicating that particle coating is the main factor determining the effective size of the investigated nanoparticles.
Determination of the zeta potential revealed similar strong negative surface charges of SEONLA, SEONLA-BSA,
and Rienso® in distilled water (-39.4±0.74, -43.0±0.72,
and -42.6±2.30 mV). However, upon dilution of SPIONs in cell culture medium, the surface charges of SEONLA-BSA,
SEONLA, and Rienso® became significantly more positive
(-15.1±1.52, -15.5±0.85, and -15.9±0.71 mV) indicating the absorption of similar ionic substances from the dispersion medium (Table 1; Figure S1D).
The stability of the SPIONs was further investigated in cell culture medium. In contrast with SEONLA-BSA and
Rienso®, which showed no signs of aggregation, SEONLA
rapidly produced distinct agglomerates (Table 1; Figure S1E). Similar results were achieved in ethylenediaminetetraacetic acid-stabilized blood at a macroscopic and microscopic level, where SPIONs conjugated with lauric acid (SEONLA)
were unstable and aggregated in a time-dependent manner (Table 1, Figure S1F and G). In contrast, nanoparticles additionally coated with serum albumin (SEONLA-BSA), as
well as Rienso® particles, were stable and did not show any
signs of agglomeration in blood (Table 1; Figure S1F and G). The biophysical properties suggest that SEONLA-BSA and
Rienso® are suitable for in vitro and in vivo applications,
whereas SEONLA should be avoided due to a propensity to
aggregate.
Quantification of SPIONs by UVS, MPS,
and aas
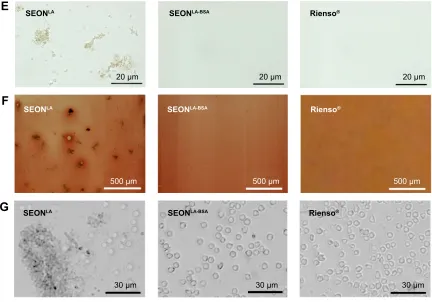
To quantify the cellular SPION content, we modified a photometric technique recently published by Dadashzadeh et al.22 Using this method, the absorption maximum for
SPIONs should be observable at 370 nm. To ensure that this also applies to the SPIONs used in this study, we prepared
SPION dilutions of 30 μgFe/mL in 10% sodium dodecyl sulfate and monitored the corresponding absorption spectra between 200 nm and 900 nm with a stepwise increase of 2 nm. Beside an obvious absorption maximum at ~222 nm, a second absorption peak is observable at a wavelength of roughly ~370 nm (Figure S2A). To test this method for repro-ducibility and for medium-throughput suitability in 96-well format, we measured the absorption of 50 μL dilutions of SPIONs (0–50 μgFe/mL) in 10% sodium dodecyl sulfate at 370 nm and found a direct correlation between absorption and concentration of the particles (Figure S2B–D). Another very important aspect for quantification of SPIONs within cell lysates by a photometric approach is that the absorption of cellular components should not interfere with the absorp-tion peak of SPIONs at 370 nm. Therefore, the reliability of the described method was verified by adding different SPION concentrations (0–50 μgFe/mL iron) into HUVEC lysates (Figure 1A). Even in these settings, an almost perfect correlation was observed between the measured absorption and quantity of added SPIONs, demonstrating the high degree of consistency for determination of the SPION concentration in cell lysates with this method.
Similar SPION contents as found with the UVS method were measured using MPS. MPS is a suitable method for specific quantification of magnetic nanoparticles in biologi-cal samples.11 Correspondingly, the correlation between the
magnetic moment and the SPION concentration was nearly perfect (Figures 1B and S2C). This was independent of the absence or presence of cell lysate within the standard solutions. Interestingly, the MPS detection threshold of 0.3 μgFe/mL for SEONBSA-LA and 0.5 μg
Fe/mL for SEONLA was
far beneath the UVS detection threshold of approximately 5 μgFe/mL as defined by 3σ criteria (Table S1). However, the MPS method was less sensitive to the Rienso® particles
than to the other two types of SPIONs. Most likely this is related to the very small core particle size of Rienso®
which resulted in a slightly higher detection threshold of 2.5 μgFe/mL using the MPS technique.
AAS is another established method to determine the amount of elementary iron (Figures 1C and S2D). Using this technique, iron amount in cell lysates containing above 0.6 μgFe/mL SEONLA, SEONBSA-LA, or Rienso® particles, were
reliably measured (Table S1). In contrast with the UVS and MPS methods, AAS quantifies the total iron content of a solu-tion and not only iron-containing SPIONs. In consequence, this method is not dependent on the magnetic moment of nanoparticles, and can be used also for quantification of nanoparticles that exhibit a very low magnetic moment, like
International Journal of Nanomedicine downloaded from https://www.dovepress.com/ by 118.70.13.36 on 23-Aug-2020
Dovepress Friedrich et al
the Rienso® particles. Moreover, compared with the UVS
method, AAS is especially useful when particles must be quantified in solutions characterized by a high absorption around 370 nm.
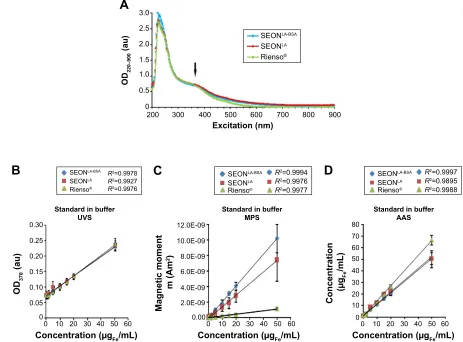
cellular uptake of sPIONs
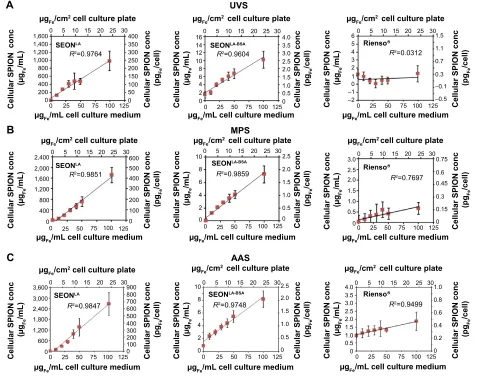
The amount of cellular SPION uptake was previously shown to depend on the concentration of SPIONs within the cell culture medium.24 To evaluate the suitability of each method
to quantify cellular or cell-associated magnetic particles, as well as to correlate those findings with the flow cytometry analysis of the side scatter, HUVECs were treated with 0–100 μgFe/mL SPIONs for 48 hours (Figure 2A–C). Within the tested concentration range, the cellular uptake of SEONLA
and SEONLA-BSA by HUVECs directly correlated with the
SPION concentration in the cell culture medium (R2.0.96,
R2.0.98, and R2.0.97 for the UVS, MPS, and AAS
mea-surements, respectively, Figure 2, left and middle panel). In contrast, cell-associated Rienso® particles werehardly
detectable by any of the methods (Figure 2, right panel). Even at the highest concentration, Rienso® particles were
detected only with the AAS method, suggesting a very low uptake or binding of Rienso® to HUVECs.
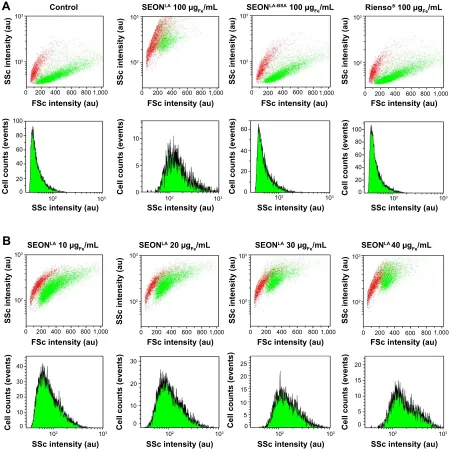
In flow cytometry, cells can be morphologically charac-terized by forward scatter and side scatter, where the forward scatter is corresponding to cell “size” and the side scatter to “granularity” of the cell. As nanoparticles scatter light, it is possible to detect intracellular nanoparticles also by side scat-ter analysis in flow cytometry, if the side scatscat-ter increase of nanoparticle-treated cells compared with untreated cells sur-passes the detection threshold (Table S1). Since the cellular size and granularity changes during cell death, it is necessary
0.30
0.25
0.20
0.15
0.10
OD
370
(au)
SPION concentration (µgFe/mL)
0.05
0
0 10 20 30 40 50
Standard in cell lysate UVS
60
Magnetic moment m (A
m
2)
SPION concentration (µgFe/mL)
2.0E-09 4.0E-09 6.0E-09 8.0E-09 10.0E-09 12.0E-09
0.00
0 10 20 30 40 50
Standard in cell lysate MPS
Standard in cell lysate AAS
60
SPION concentration (µgFe/mL)
SPION concentration
(µ
gFe
/mL)
0 0
10 10
20 20
30 30
40 40
50 50
60 60
70 80
A
B
C
SEONLA-BSA
R2=0.9997
R2=0.9964
R2=0.9994
SEONLA
Rienso®
SEONLA-BSA
R2=0.9993
R2=0.9983
R2=0.9998
SEONLA
Rienso®
SEONLA-BSA R2=0.9988
R2=0.9989
R2=0.9990
SEONLA
Rienso®
Figure 1 suitability of UVs, MPs, and aas techniques for measurement of sPION concentration in cell lysates.
Notes: (A) UVs measurements at 370 nm, (B) MPs measurements, and (C) aas measurements with increasing sPION concentration in cell lysates. Data are presented as the mean ± standard deviation (n=3 with triplicates). R² represents the coefficient of determination.
Abbreviations: au, absorbance units; sPION, superparamagnetic iron oxide nanoparticle; UVs, ultraviolet spectrophotometry; MPs, magnetic particle spectroscopy; aas, atomic adsorption spectroscopy; seONla, lauric acid-coated nanoparticles; seONla-Bsa, lauric acid/albumin bovine serum hybrid-coated nanoparticles; OD
370, optical density at 370 nm.
International Journal of Nanomedicine downloaded from https://www.dovepress.com/ by 118.70.13.36 on 23-Aug-2020
Dovepress Quantification of cellular SPIONs with flow cytometry
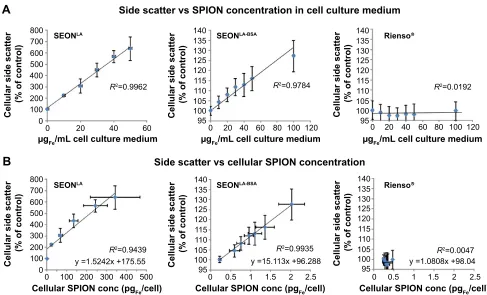
to exclude dying or dead cells with altered morphology from analysis of the side scatter for SPION uptake. Gating on phenotypically healthy cells, characterized by negative Annexin V and negative propidium iodide staining, a signifi-cant correlation was observed between the SPION amount in the cell culture medium and the side scatter of viable cells after 48 hours of incubation with SEONLA-BSA (R2.0.97).
The SEONLA data demonstrated a similar correlation when
narrowing the analysis to cells with a SPION-load below 100 μgFe/mL (R2.0.99; Figure 3A, left and middle panel).
Cells incubated with Rienso® did not display a significant
change in side scatter increase in response to the growing nanoparticle dose in the medium, confirming an extremely low cellular uptake or binding of these particles (Figure 3A, right panel), as compared with SEONLA-BSA and SEONLA
par-ticles. Figure S3 shows representative flow cytometric graphs of nanoparticle-treated cells, and highlights the principle of the side scatter increase after nanoparticle attachment/ uptake by cells.
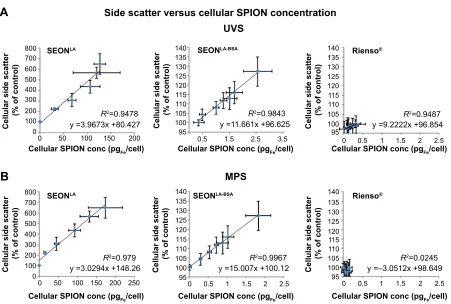
Consequently, when the side scatter data were plot-ted against the results of the AAS measurements, a strong dependence between side scatter and cellular SPION-load for SEONLA (R2.0.94) and SEONLA-BSA (R2.0.99)
par-ticles was confirmed, whereas Rienso® did not show any
correlation tendency (Figure 3B). Similar results were achieved when side scatter data were plotted against the results of the UVS and MPS measurements, demonstrat-ing the applicability of these methods for calibration of the flow cytometry side scatter measurements (Figure S4A and B). ± ±
J)HP/FHOOFXOWXUHPHGLXP
J)HP/FHOOFXOWXUHPHGLXP
J)HP/FHOOFXOWXUHPHGLXP
J)HP/FHOOFXOWXUHPHGLXP
J)HP/FHOOFXOWXUHPHGLXP
J)HP/FHOOFXOWXUHPHGLXP
J)HP/FHOOFXOWXUHPHGLXP
J)HP/FHOOFXOWXUHPHGLXP
J)HP/FHOOFXOWXUHPHGLXP
J)HFPFHOOFXOWXUHSODWH
J)HFPFHOOFXOWXUHSODWH
J)HFPFHOOFXOWXUHSODWH
J)HFPFHOOFXOWXUHSODWH
J)HFPFHOOFXOWXUHSODWH
J)HFPFHOOFXOWXUHSODWH
J)HFPFHOOFXOWXUHSODWH
J)HFPFHOOFXOWXUHSODWH$$6
036 896
J)HFPFHOOFXOWXUHSODWH
&HOOXODU63,21FRQF J )H P/ &HOOXODU63,21FRQF SJ )H FHOO &HOOXODU63,21FRQF J )H P/ &HOOXODU63,21FRQF SJ )H FHOO &HOOXODU63,21FRQF J )H P/ &HOOXODU63,21FRQF SJ )H FHOO &HOOXODU63,21FRQF J )H P/ &HOOXODU63,21FRQF SJ )H FHOO &HOOXODU63,21FRQF SJ )H FHOO &HOOXODU63,21FRQF J )H P/ &HOOXODU63,21FRQF J )H P/ &HOOXODU63,21FRQF J )H P/ &HOOXODU63,21FRQF SJ )H FHOO &HOOXODU63,21FRQF SJ )H FHOO &HOOXODU63,21FRQF SJ )H FHOO &HOOXODU63,21FRQF SJ )H FHOO &HOOXODU63,21FRQF J )H P/ &HOOXODU63,21FRQF J )H P/ ± ± $ % & 6(21/$ 5 6(21/$ 5 6(21/$ 5 6(21/$%6$ 5 6(21/$%6$ 5 6(21/$%6$ 5 5 5 5LHQVR 5LHQVR 5LHQVR 5
Figure 2 concentration measurements of cellular sPIONs.
Notes: (A–C) hUVecs were cultured for 48 hours in medium containing 0–100 μgFe/ml sPIONs. The measured cellular sPION concentration is given in pgFe/cell and μgFe/ml
cell lysate and is correlated to the sPION concentration in medium indicated as μgFe/ml medium and μgFe/cm2 cell culture plate surface. cellular sPION concentrations were
measured with (A) UVs, (B) MPs, and (C) aas. The columns present data acquired with seONla (left panel), seONla-Bsa (middle panel), and rienso® (right panel). Data are
expressed as the mean ± standard error (n=3 with technical triplicates). R² represents the coefficient of determination.
Abbreviations: sPION, superparamagnetic iron oxide nanoparticle; UVs, ultraviolet spectrophotometry; MPs, magnetic particle spectroscopy; aas, atomic adsorption spectroscopy; seONla, lauric acid-coated nanoparticles; seONla-Bsa, lauric acid/albumin bovine serum hybrid-coated nanoparticles; hUVecs, human umbilical vein endothelial cells.
International Journal of Nanomedicine downloaded from https://www.dovepress.com/ by 118.70.13.36 on 23-Aug-2020
Dovepress Friedrich et al
cell viability is strongly dependent
on sPION type
Flow cytometry is a rapid and comprehensive method for analysis of multiple toxicity parameters. The absolute amount of viable cells after treatment is a direct indicator of the toxic effect of SPIONs on cells. In our study, this parameter was routinely collected prior to determination of the cellular SPION-load and other toxicity parameters using the MUSE Cell Analyzer (Figure 4A). Interestingly, incubation of cells with SEONLA for 48 hours resulted in dramatic inhibition of
proliferation, whereas this effect was much less pronounced upon increasing SEONLA-BSA treatment and absent with
Rienso® particles.
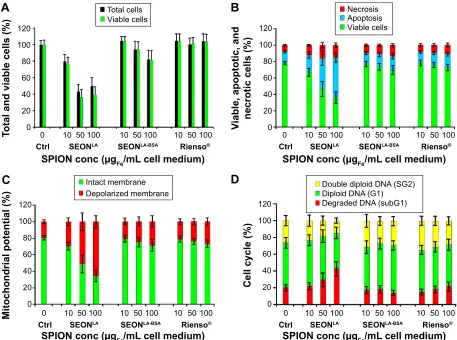
A detailed analysis of the toxic effects of SPIONs was performed using multiparameter flow cytometry (Figure 4B–D).25–27 Annexin V and propidium iodide
stain-ing of HUVECs revealed a very low tendency of SEONLA-BSA
and Rienso® particles to induce cell death (Figure 4B),
whereas treatment of HUVECs with SEONLA had a stronger
effect on viability. Interestingly, n SEONLA-treated cells only
the rate of apoptotic cells increased in a dose-dependent manner, whereas the amount of necrotic cells stayed almost constant. Thus, after incubation for 48 hours, the amount of viable cells dropped continuously to 41% in the presence of the highest SEONLA concentration.
Cells analyzed by DiIC1(5) staining15 revealed only a
slight effect of SEONLA-BSA and Rienso® particles on the
membrane potential (Figure 4C). Again, incubation with SEONLA particles had severe consequences for cell viability
by inducing a dose-dependent collapse of the membrane potential and, ultimately, cell death.
Finally, propidium iodide-Triton X measurements were performed to analyze cell cycle stage and DNA degrada-tion during apoptosis (Figure 4D).28–30 Consistent with the
aforementioned results, SEONLA-BSA and Rienso® did not
significantly influence the cell cycle or DNA degradation. In contrast, treatment with SEONLA induced a
concentration-dependent increase in numbers of damaged cells in subG1-phase, reflecting the DNA degradation due to induction of cell death. Taken together, the flow cytometry analysis
&HOOXODUVLGHVFDWWHU RIFRQWURO
&HOOXODUVLGHVFDWWHU RIFRQWURO &HOOXODUVLGHVFDWWHU RIFRQWURO &HOOXODUVLGHVFDWWHU RIFRQWURO
&HOOXODUVLGHVFDWWHU RIFRQWURO
&HOOXODUVLGHVFDWWHU RIFRQWURO
J)HP/FHOOFXOWXUHPHGLXP J)HP/FHOOFXOWXUHPHGLXP
J)HP/FHOOFXOWXUHPHGLXP
&HOOXODU63,21FRQFSJ)HFHOO &HOOXODU63,21FRQFSJ)HFHOO &HOOXODU63,21FRQFSJ)HFHOO
6(21/$
6(21/$
6(21/$%6$
6(21/$%6$
5LHQVR
5LHQVR 5
5 5
5 5 5
\ [ \ [
\ [
6LGHVFDWWHUYVFHOOXODU63,21FRQFHQWUDWLRQ
6LGHVFDWWHUYV63,21FRQFHQWUDWLRQLQFHOOFXOWXUHPHGLXP
$
%
Figure 3 correlation between side scatter measurements and sPION-loads. hUVecs were cultured for 48 hours in medium containing 0–100 μgFe/ml sPIONs.
Notes: (A) correlation of the side scatter and the sPION concentration within the cell culture medium. (B) relationship between the cellular sPION-load as measured by AAS and the normalized side scatter data delivered by flow cytometry. Results were acquired with SEONla (left panel), seONla-Bsa (middle panel), and rienso® (right panel).
Data are expressed as the mean ± standard error (n=3 with technical triplicates). R² represents the coefficient of determination. y describes the mathematic relationship between side scatter and cellular sPION content.
Abbreviations: sPION, superparamagnetic iron oxide nanoparticle; aas, atomic adsorption spectroscopy; hUVecs, human umbilical vein endothelial cells; seONla, lauric
acid-coated nanoparticles; seONla-Bsa, lauric acid/albumin bovine serum hybrid-coated nanoparticles.
International Journal of Nanomedicine downloaded from https://www.dovepress.com/ by 118.70.13.36 on 23-Aug-2020
Dovepress Quantification of cellular SPIONs with flow cytometry
indicated a very low cytotoxic impact of SEONLA-BSA and
Rienso on HUVECs, corresponding to low cellular uptake, as estimated by side scatter analysis and other techniques. In contrast, SEONLA particles, in parallel with increasing
cellular uptake, resulted in a strong cellular response and a dose-dependent induction of cell death.
Discussion
One of the most important considerations related to use of SPIONs in humans is their potential toxicity. As such, the toxic effects of SPIONs have been investigated ever since their first clinical applications in the 1980s.31–34 In vitro
stud-ies, summarized by Bulte et al indicated no toxic effects of SPIONs at concentrations below 10 pgFe/cell.35 In endothelial
cells, treatment with up to 100 μgFe/mL SPIONs was well
tolerated, although cellular uptake was not determined in that study.36 During clinical applications like magnetic resonance
imaging or magnetic hyperthermia, SPIONs come into direct contact with endothelial cells when administered into veins or arteries. We therefore investigated SPION accumulation/ uptake in endothelial cells, which are the first contact cells for all nanoparticles intended for intravascular administration.
Since the interest in iron oxide nanoparticles for tech-nical, scientific, and medical applications is increasing, there is an urgent need for reliable and rapid methods to characterize those particles before further development and use. Thus, correlation of the cellular SPION amount with cellular effects requires accurate quantification. However, the majority of laboratories have no access to high-end quantification techniques such as AAS and MPS, and being
SPION conc (µgFe/mL cell medium)
To
tal and viable cells (%
)
SEONLA-BSA
SEONLA
Ctrl
0
0 10 50 100 10 50 100 10 50 100
20 40 60 80 100 120
Rienso®
SPION conc (µgFe/mL cell medium)
Vi
able, apoptotic, an
d
necrotic cells (%
)
SEONLA-BSA
SEONLA
Ctrl
0
0 10 50 100 10 50 100 10 50 100
20 40 60 80 100 120
Rienso®
SPION conc (µgFe/mL cell medium)
Mitochondrial potential (%
)
SEONLA-BSA
SEONLA
Ctrl
0
0 10 50 100 10 50 100 10 50 100
20 40 60 80 100 120
Rienso®
SPION conc (µgFe/mL cell medium)
Cell cycle (%
)
SEONLA-BSA
SEONLA
Ctrl
0
0 10 50 100 10 50 100 10 50 100
20 40 60 80 100 120
Rienso®
A
C
B
D
Total cellsViable cells Necrosis
Viable cells Apoptosis
Intact membrane
Depolarized membrane Double diploid DNA (SG2)
Degraded DNA (subG1) Diploid DNA (G1)
Figure 4 association of cellular uptake with toxicity of sPIONs. hUVecs were incubated for 48 hours with different amounts of sPIONs and cytotoxicity was analyzed by flow cytometry.
Notes: (A) Quantification of the absolute amount of total cell numbers and viable cells using MUSE. (B) cell viability determined by annexin V/propidium iodide staining. Percentages of necrotic (propidium iodide-positive), apoptotic (annexin V-positive, propidium iodide-negative) and viable cells (annexin V-negative, propidium iodide-negative) are shown. (C) Membrane potential analyzed by 1,1′,3,3,3′,3′-hexamethyl-indodicarbocyanine iodide [DiIc1(5)] staining. graphs show cells with intact (DiI+) and depolarized (DiI-) membrane potential. (D) cell cycle analysis by propidium iodide-Triton X staining. The cell status is expressed as the amount of apoptotic (degraded DNa, subg1), diploid (g1-phase) and double diploid (synthesis/g2 phase) cells. Data are presented as the mean ± standard error (n=3 with sample triplicates). The results were normalized to total cells (A) or to untreated control cells (B–D), set to 100%.
Abbreviations: sPION, superparamagnetic iron oxide nanoparticle; hUVecs, human umbilical vein endothelial cells; seONla, lauric acid-coated nanoparticles; seONla-Bsa,
lauric acid/albumin bovine serum hybrid-coated nanoparticles; ctrl, control.
International Journal of Nanomedicine downloaded from https://www.dovepress.com/ by 118.70.13.36 on 23-Aug-2020
Dovepress Friedrich et al
compelled to reduce costs, are restricted to other techniques, eg, spectrophotometry.
Photometric quantification of SPIONs within cell lysates was originally established using particles coated either with dextran or with a semisynthetic carbohydrate PSC.22 As the
coating of SPIONs might influence their absorption behav-ior, we investigated the reproducibility of this method for SEON nanoparticles coated with either lauric acid or lauric acid and bovine serum albumin in parallel with Rienso®
particles coated with PSC. We observed similar absorption spectra and an absorption maximum at 370 nm for all three SPION types, indicating only a very slight influence of the coating on absorption intensity at OD370 (Figure S2A). Moreover, for all three types of nanoparticles, we found an almost perfect correlation between SPION concentration and SPION absorbance, which is a prerequisite for reliable SPION quantification.
Other factors that could theoretically influence the results of photometric quantification of SPIONs in cell lysates are the components of the lysate itself. Degradation products of cellular components might absorb light and potentially alter the result of SPION quantification. Although nucleic acids and proteins are usually quantified by absorption measurements at 260 nm and 280 nm, respectively, their interference with the SPION quantification method cannot be completely excluded.37,38 However, the enormous similarity
between measurements of SPIONs in the lysis buffer and in the HUVEC lysates (Figures S2B–D; 1A–C) confirms the reliability of the photometric SPION quantification in cell lysates, proving the absence of compounds able to interfere with quantification of SPIONs in these conditions. Furthermore, we demonstrated that the results obtained with the UVS method are consistent with those of highly precise techniques like AAS and MPS. All three methods deliver comparable results for the cellular SEONLA-BSA and SEONLA
content of HUVECs (Figure 1A–B). In cell lysates contain-ing very small amounts of SPIONs, eg, Rienso®-treated
HUVEC lysates, the slightly poorer detection limit of the UVS method prevented a reliable quantification (Figure 1C). Here, AAS and especially MPS have a clear advantage over the UVS method and are thus more suitable for detection of trace amounts of SPIONs within cell lysates. A strong advantage of the UVS technique, however, is the low costs of the equipment required, ie, a plate reader in comparison with the MPS or AAS instrument.
With regard to cellular uptake, the data presented here underline type-specific SPION internalization into HUVECs, which result from a combination of SPION concentration
and particle coating. Even though the cellular SPION concentration strongly differed depending on the SPION type, SEONLA-BSA and Rienso® were principally non-toxic
even at very high concentrations. In contrast, SEONLA were
toxic already at significantly lower concentrations in the cell culture medium, as determined by multiparameter flow cytometry (Figure 4). SEONLA treatment induced a
dose-dependent increase in numbers of apoptotic cells in parallel with membrane depolarization and the amounts of degraded DNA. Moreover, analysis of biostability displayed highly agglomeration-prone behavior of SEONLA, which was not
observable with SEONLA-BSA and Rienso® particles (Table 1;
Figure S1E–G). These properties were independent of zeta potential values, which did not differ between the three types of nanoparticles, indicating that the zeta potential cannot generally be considered for estimating the stability of colloids. It must be noted that SEONLA particles contain
a bilayer of lauric acid on the particle surface. The outer layer of surfactant is in permanent equilibrium with the solution. After dilution in any type of medium, the outer layer is gradually removed from the particles, thus causing particle-precipitation within minutes or few hours (depend-ing on the degree of particle dilution and/or ionic strength of the diluent). Complex biological fluids, containing proteins to which excess lauric acid can adsorb permanently, can accelerate this process even further.20,39
One of the parameters routinely determined by flow cytometry is the side scatter. Gating on phenotypically healthy cells, characterized by Annexin V-negative and propidium iodide-negative staining, delivered a significant correlation of the side scatter data with cellular SPION con-tent in cells incubated with increasing amounts of SEONLA
and SEONLA-BSA (Figure 3A).
This semiquantitative determination could be further enhanced by calibrating the side scatter parameter for a certain cell type and SPION type. This calibration should preferably be made after quantification of the cellular SPION-load by AAS, but MPS and UVS also deliver accurate data. Based on our results, scatter analysis is a reliable method to quantitatively determine the cellular amount of SPIONs (Figures 3B, S4A–B). Naturally, this is only possible if suf-ficient amounts of particles are internalized and the detection threshold of the side scatter analysis is surpassed. Thus, no measurable change in the side scatter of HUVECs incubated with Rienso® was detectable, indicating an extremely low
uptake of these particles (Figure 3, left panel).
It must be noted that in previously published studies, cellular uptake of SPIONs was normalized to protein
International Journal of Nanomedicine downloaded from https://www.dovepress.com/ by 118.70.13.36 on 23-Aug-2020
Dovepress Quantification of cellular SPIONs with flow cytometry
concentration.36 However, to obtain a better understanding
of the influence of nanoparticles on cells, it is crucial to gather all relevant concentration parameters, such as μgFe/mL media, μgFe/cm2 plate surface, and pg
Fe/cell and, above all,
the respective cell number of the measured sample. The methods applied in our study aimed at quantification of cell numbers in parallel with the measurement of SPION content, in order to correlate the cellular effects with the average amount of SPIONs per cell. This approach enabled correlation of the supplemented iron concentration with the cellular SPION uptake and thus an easy conversion of cellular SPION concentration from μgFe/mL lysate to pgFe/ cell (Figure 2). Counting the cell number within samples is particularly important in order to correlate SPION toxicity with the cellular iron content. As cytotoxic effects could lead to a detachment of cells, we ensured that all cells were collected for measurements to prevent misinterpretation of the results.
In conclusion, flow cytometry is the gold standard to investigate the cellular impact of nanoparticles, since it is the most efficient method to simultaneously determine several different toxicity parameters. Our findings indicate that, together with the side scatter data, and the possibility to correlate those data with the cellular SPION amount, flow cytometry could serve as a platform for medium to high throughput screening of SPIONs.
Acknowledgments
We thank Sibylle Bremer-Streck at the Institut für Klinische Chemie und Laboratoriumsdiagnostik in Jena for technical assistance with the AAS measurements. This study was sup-ported by the Deutsche Forschungsgemeinschaft (SPP1681 [AL 552/5-1, TR 408/8-1], OD 18/23-1, HI 698/7-4, TR 408/4-3, CI162/2-1), by the Bavarian State Ministry for Environment and Consumer Protection, and the Deutsche Forschungsgemeinschaft Cluster of Excellence-Engineering of Advanced Materials (EAM).
Disclosure
The authors report no conflicts of interest in this work.
References
1. Jin R, Lin B, Li D, Ai H. Superparamagnetic iron oxide nanoparticles for MR imaging and therapy: design considerations and clinical applications. Curr Opin Pharmacol. 2014;18C:18–27.
2. Thomas R, Park IK, Jeong YY. Magnetic iron oxide nanoparticles for multimodal imaging and therapy of cancer. Int J Mol Sci. 2013;14: 15910–15930.
3. Schutz CA, Juillerat-Jeanneret L, Mueller H, Lynch I, Riediker M. NanoImpactNet Consortium. Therapeutic nanoparticles in clinics and under clinical evaluation. Nanomedicine (Lond). 2013;8:449–467.
4. Grillo R, Rosa AH, Fraceto LF. Engineered nanoparticles and organic matter: a review of the state-of-the-art. Chemosphere. 2014;119C: 608–619.
5. Sarkar A, Ghosh M, Sil PC. Nanotoxicity: oxidative stress mediated toxicity of metal and metal oxide nanoparticles. J Nanosci Nanotechnol. 2014;14:730–743.
6. Kumar A, Dhawan A. Genotoxic and carcinogenic potential of engi-neered nanoparticles: an update. Arch Toxicol. 2013;87:1883–1900. 7. Mayhew TM, Muhlfeld C, Vanhecke D, Ochs M. A review of recent
methods for efficiently quantifying immunogold and other nanopar-ticles using TEM sections through cells, tissues and organs. Ann Anat. 2009;191:153–170.
8. Burrows ND, Penn RL. Cryogenic transmission electron microscopy: aqueous suspensions of nanoscale objects. Microsc Microanal. 2013;19: 1542–1553.
9. Stender AS, Marchuk K, Liu C, et al. Single cell optical imaging and spectroscopy. Chem Rev. 2013;113:2469–2527.
10. Rad AM, Janic B, Iskander AS, Soltanian-Zadeh H, Arbab AS. Mea-surement of quantity of iron in magnetically labeled cells: comparison among different UV/VIS spectrometric methods. Bio Techniques. 2007;43:627–628, 630, 632.
11. Wiekhorst F, Steinhoff U, Eberbeck D, Trahms L. Magnetorelaxometry assisting biomedical applications of magnetic nanoparticles. Pharm Res. 2012;29:1189–1202.
12. Tietze R, Jurgons R, Lyer S, et al. Quantification of drug-loaded mag-netic nanoparticles in rabbit liver and tumor after in vivo administration. J Magn Magn Mater. 2009;321:1465–1468.
13. Canfranc E, Abarca A, Sierra I, Marina ML. Determination of iron and molybdenum in a dietetic preparation by flame AAS after dry ashing. J Pharm Biomed Anal. 2001;25:103–108.
14. Janko C, Munoz L, Chaurio R, et al. Navigation to the graveyard-induction of various pathways of necrosis and their classification by flow cytometry. Methods Mol Biol. 2013;1004:3–15.
15. Munoz LE, Maueroder C, Chaurio R, Berens C, Herrmann M, Janko C. Colourful death: six-parameter classification of cell death by flow cytometry – dead cells tell tales. Autoimmunity. 2013;46:336–341. 16. Xia J, Zhang S, Zhang Y, et al. The relationship between internalization
of magnetic nanoparticles and changes of cellular optical scatter signal. J Nanosci Nanotechnol. 2008;8:6310–6315.
17. Suzuki H, Toyooka T, Ibuki Y. Simple and easy method to evaluate uptake potential of nanoparticles in mammalian cells using a flow cytometric light scatter analysis. Environ Sci Technol. 2007;41: 3018–3024.
18. Zucker RM, Daniel KM, Massaro EJ, Karafas SJ, Degn LL, Boyes WK. Detection of silver nanoparticles in cells by flow cytometry using light scatter and far-red fluorescence. Cytometry A. 2013;83:962–972. 19. Toduka Y, Toyooka T, Ibuki Y. Flow cytometric evaluation of
nanopar-ticles using side-scattered light and reactive oxygen species-mediated fluorescence – correlation with genotoxicity. Environ Sci Technol. 2012; 46:7629–7636.
20. Zaloga J, Janko C, Nowak J, et al. Development of a lauric acid/albumin hybrid iron oxide nanoparticle system with improved biocompatibility. Int J Nanomed. 2014;9:4847–4866.
21. Matuszak J, Zaloga J, Friedrich RP, et al. Endothelial biocompatibility and accumulation of SPION under flow conditions. J Magn Magn Mater. doi:10.1016/j.jmmm. 2014. Available from: http://www.sci-encedirect.com/science/article/pii/S0304885314008245
22. Dadashzadeh ER, Hobson M, Henry Bryant L Jr, Dean DD, Frank JA. Rapid spectrophotometric technique for quantifying iron in cells labeled with superparamagnetic iron oxide nanoparticles: potential translation to the clinic. Contrast Media Mol Imaging. 2013;8:50–56.
23. Riccardi C, Nicoletti I. Analysis of apoptosis by propidium iodide staining and flow cytometry. Nat Protoc. 2006;1:1458–1461. 24. Petri-Fink A, Chastellain M, Juillerat-Jeanneret L, Ferrari A, Hofmann H.
Development of functionalized superparamagnetic iron oxide nanopar-ticles for interaction with human cancer cells. Biomaterials. 2005;26: 2685–2694.
International Journal of Nanomedicine downloaded from https://www.dovepress.com/ by 118.70.13.36 on 23-Aug-2020
Dovepress Friedrich et al
25. van Engeland M, Nieland LJ, Ramaekers FC, Schutte B, Reutelingsperger CP. Annexin V-affinity assay: a review on an apoptosis detection system based on phosphatidylserine exposure. Cytometry. 1998;31:1–9. 26. Demchenko AP. The change of cellular membranes on apoptosis:
fluorescence detection. Exp Oncol. 2012;34:263–268.
27. Bohm I, Traber F, Block W, Schild H. [Molecular imaging of apoptosis and necrosis – basic principles of cell biology and use in oncology]. Rofo. 2006;178:263–271. German.
28. Pozarowski P, Darzynkiewicz Z. Analysis of cell cycle by flow cytom-etry. Methods Mol Biol. 2004;281:301–311.
29. Ormerod MG. Investigating the relationship between the cell cycle and apoptosis using flow cytometry. J Immunol Methods. 2002;265: 73–80.
30. Nunez R. DNA measurement and cell cycle analysis by flow cytometry. Curr Issues Mol Microbiol. 2001;3:67–70.
31. Weir MP, Gibson JF, Peters TJ. Haemosiderin and tissue damage. Cell Biochem Funct. 1984;2:186–194.
32. Bassett ML, Halliday JW, Powell LW. Value of hepatic iron measure-ments in early hemochromatosis and determination of the critical iron level associated with fibrosis. Hepatology. 1986;6:24–29.
33. Weissleder R, Stark DD, Engelstad BL, et al. Superparamagnetic iron oxide: pharmacokinetics and toxicity. AJR Am J Roentgenol. 1989;152: 167–173.
34. Fischer R, Piga A, Harmatz P, Nielsen P. Monitoring long-term efficacy of iron chelation treatment with biomagnetic liver susceptometry. Ann N Y Acad Sci. 2005;1054:350–357.
35. Bulte JW. In vivo MRI cell tracking: clinical studies. AJR Am J Roent-genol. 2009;193:314–325.
36. Sun Z, Yathindranath V, Worden M, et al. Characterization of cellular uptake and toxicity of aminosilane-coated iron oxide nanoparticles with different charges in central nervous systemrelevant cell culture models. Int J Nanomedicine. 2013;8:961–970.
37. Wilfinger WW, Mackey K, Chomczynski P. Effect of pH and ionic strength on the spectrophotometric assessment of nucleic acid purity. Bio Techniques. 1997;22:474–476, 478–481.
38. Stoscheck CM. Quantitation of protein. Methods Enzymol. 1990;182: 50–68.
39. Shen L, Laibinis PE, Hatton TA. Bilayer surfactant stabilized magnetic fluids: synthesis and interactions at interfaces. Langmuir. 1998;15: 447–453.
International Journal of Nanomedicine downloaded from https://www.dovepress.com/ by 118.70.13.36 on 23-Aug-2020
Dovepress Quantification of cellular SPIONs with flow cytometry
Supplementary materials
Table S1 Detection thresholds for UVs, MPs, aas, and ssc
Quantification method Detection threshold unit (ø +3σ) SEONLA SEONLA-BSA Rienso®
UVs (μgFe/ml) 4.47 4.74 4.03
MPs (μgFe/ml) 0.49 0.31 2.52
aas (μgFe/ml) 0.56 0.56 0.56
ssc (%) 110.48 109.16 112.11
Notes: Detection threshold for the UVs, MPs, and aas techniques with sPION-containing cell lysates indicated as μgFe/ml cell lysate. The detection threshold for ssc analysis
is indicated as the percentage compared with ssc data of untreated cells. The thresholds for UVs, MPs, and ssc is dependent on the sPION nature, whereas aas, a method quantifying elementary iron, is not. Determinations of the detection threshold were achieved using the 3σ criteria.
Ø, mean value of the negative control; σ, standard deviation.
Abbreviations: UVs, ultraviolet spectrophotometry; MPs, magnetic particle spectroscopy; aas, atomic adsorption spectroscopy; ssc, side scatter analysis; seONla, lauric
acid-coated nanoparticles; seONla-Bsa, lauric acid/albumin bovine serum hybrid-coated nanoparticles; sPION, superparamagnetic iron oxide nanoparticle.
6(21/$
6(21/$
6(21/$
6(21/$%6$
6(21/$%6$
6(21/$%6$
5LHQVR
5LHQVR
6(21/$
6(21/$%6$
5LHQVR
6(21/$
6(21/$%6$
5LHQVR
5LHQVR
QP
QP QP QP
QP QP
:DYHQXPEHUFP±
±
±
±
±
±
+2 &HOOPHGLXP
$PRXQWRI SDUWLFOHV
$EVRUSWLRQDX
6L]HGLVWULEXWLRQE\YROXPHQP
ζ
SRWHQWLDOP9
$
%
&
'
Figure S1 (Continued)
International Journal of Nanomedicine downloaded from https://www.dovepress.com/ by 118.70.13.36 on 23-Aug-2020
Dovepress Friedrich et al
Figure S1 Biophysical properties of sPIONs.
Notes: (A) representative transmission electron micrographs of seONla-Bsa, seONla and rienso®. (B) Fourier transform infrared spectra of the nanoparticles. (C) Dynamic
light scattering data of nanoparticles in water. (D) Zeta potential of investigated particles. (E–G) Biostability of nanoparticles. Nanoparticle stability was investigated in cell culture medium (E), and in ethylenediaminetetraacetic acid-stabilized sheep blood (F, G). representative images were recorded using a digital camera(F) and optical bright-field microscopy (E, G). Data are expressed as the mean ± standard deviation (n=3).
Abbreviations: au, absorbance units; seONla, lauric acid-coated nanoparticles; seONla-Bsa, lauric acid/albumin bovine serum hybrid-coated nanoparticles; sPIONs,
superparamagnetic iron oxide nanoparticles.
6(21/$
6(21/$
6(21/$
6(21/$%6$
6(21/$%6$
6(21/$%6$
5LHQVR
5LHQVR
5LHQVR
P P P
P P P
P P P
(
)
*
International Journal of Nanomedicine downloaded from https://www.dovepress.com/ by 118.70.13.36 on 23-Aug-2020
Dovepress Quantification of cellular SPIONs with flow cytometry
([FLWDWLRQQP
2'
±
DX
6(21/$%6$
6(21/$
5LHQVR
$
( (
( ( ( (
2'
DX
0DJQHWLFPRPHQW
P$
P
&RQFHQWUDWLRQJ)HP/ &RQFHQWUDWLRQJ)HP/ &RQFHQWUDWLRQJ)HP/ &RQFHQWUDWLRQ J
)H
P/
6WDQGDUGLQEXIIHU
896 6WDQGDUGLQEXIIHU036 6WDQGDUGLQEXIIHU$$6
6(21/$
6(21/$%6$
5LHQVR 5 5
5 6(21
/$
6(21/$%6$
5LHQVR 5
5
5 6(21
/$
6(21/$%6$
5LHQVR 5
5
5
%
&
'
Figure S2 suitability of UVs, MPs, and aas techniques for the measurement of sPION concentration in lysis buffer.
Notes: (A) absorption spectra of sPIONs (30 μgFe/ml). arrow indicates the absorption peak at 370 nm. correlation of UVs measurements at 370 nm (B), MPs measurements
(C) and aas measurements (D) with increasing sPION concentration in lysis buffer. Data are presented as mean ± standard deviation (n=3 with triplicates). R² represents the coefficient of determination.
Abbreviations: sPION, superparamagnetic iron oxide nanoparticle; UVs, ultraviolet spectrophotometry; MPs, magnetic particle spectroscopy; aas, atomic adsorption spectroscopy; seONla, lauric acid-coated nanoparticles; seONla-Bsa, lauric acid/albumin bovine serum hybrid-coated nanoparticles; OD
370, optical density at 370 nm;
au, absorbance units.
International Journal of Nanomedicine downloaded from https://www.dovepress.com/ by 118.70.13.36 on 23-Aug-2020
Dovepress Friedrich et al
66FLQWHQVLW\DX 66FLQWHQVLW\DX 66FLQWHQVLW\DX 66FLQWHQVLW\DX 66FLQWHQVLW\DX
66FLQWHQVLW\DX
66FLQWHQVLW\DX 66FLQWHQVLW\DX 66FLQWHQVLW\DX
66FLQWHQVLW\DX
66FLQWHQVLW\DX
66FLQWHQVLW\DX
66FLQWHQVLW\DX
66FLQWHQVLW\DX 66FLQWHQVLW\DX 66FLQWHQVLW\DX )6FLQWHQVLW\DX )6FLQWHQVLW\DX )6FLQWHQVLW\DX )6FLQWHQVLW\DX
)6FLQWHQVLW\DX )6FLQWHQVLW\DX
)6FLQWHQVLW\DX )6FLQWHQVLW\DX
&HOOFRXQWVHYHQWV &HOOFRXQWVHYHQWV &HOOFRXQWVHYHQWV &HOOFRXQWVHYHQWV
&HOOFRXQWVHYHQWV
&HOOFRXQWVHYHQWV
&HOOFRXQWVHYHQWV
&HOOFRXQWVHYHQWV
$
%
6(21/$J
)HP/ 6(21/$%6$J)HP/ 5LHQVRJ)HP/ &RQWURO
6(21/$J )HP/ 6(21/$J
)HP/ 6(21/$J)HP/ 6(21/$J)HP/
Figure S3 Representative flow cytometry graphs of SSc and FSc. HUVECs were cultured for 48 hours in medium containing 0–100 μgFe/ml sPIONs. ssc and Fsc were
measured by flow cytometry. Graphs show SSc plotted against FSc, and SSc against the number of counted cells (events).
Notes: (A) graphs of untreated cells and cells treated with 100 μgFe/ml seONla, seONla-Bsa, and rienso®. (B) graphs of cells treated with 10, 20, 30, and 40 μgFe/ml
seONla. The underlying raw data and the data from the aas measurements were used to determine the correlation between ssc and sPION content.
Abbreviations: au, absorbance units; ssc, side scatter; Fsc, forward scatter; sPION, superparamagnetic iron oxide nanoparticle; hUVecs, human umbilical vein endothelial cells; seONla, lauric acid-coated nanoparticles; seONla-Bsa, lauric acid/albumin bovine serum hybrid-coated nanoparticles; aas, atomic adsorption spectroscopy.
International Journal of Nanomedicine downloaded from https://www.dovepress.com/ by 118.70.13.36 on 23-Aug-2020