Theses and Dissertations
2016
Developmental Trajectories of Working Memory
From Age 6 Through 25 Years
Kristin L. Roberts University of South Carolina
Follow this and additional works at:https://scholarcommons.sc.edu/etd
Part of theSchool Psychology Commons
This Open Access Thesis is brought to you by Scholar Commons. It has been accepted for inclusion in Theses and Dissertations by an authorized administrator of Scholar Commons. For more information, please [email protected].
Recommended Citation
Roberts, K. L.(2016).Developmental Trajectories of Working Memory From Age 6 Through 25 Years.(Master's thesis). Retrieved from
by
Kristin L. Roberts
Bachelor of Arts Ohio University, 2005
Submitted in Partial Fulfillment of the Requirements
For the Degree of Master of Arts in
School Psychology
College of Arts and Sciences
University of South Carolina
2016
Accepted by:
Scott L. Decker, Director of Thesis
E. Scott Huebner, Reader
The author wishes to thank the University of South Carolina’s School Psychology
Program faculty for the opportunity to participate in the scholarly community, Drs. Scott
Decker and Scott Huebner for their guidance and support, and the graduate students of
the Applied Cognitive Neuropsychology Laboratory and the Psychology Department at
the University of South Carolina for their help and support in the completion of this
Working memory (WM) has been shown to be closely related to measures of
achievement and intelligence, as well as attention, illustrating the critical role WM plays
in the learning process. Understanding the typical developmental trajectory of WM is
essential if professionals are to recognize and intervene when a child’s WM development
shows signs of delay. The current study evaluated the development of WM in a
cross-sectional sample of 303 children, adolescents, and adults from ages 6 through 25 years.
The study utilized a comprehensive measure of WM, assessing verbal, static
visual-spatial, and dynamic visual-spatial WM capacity across various processing demands.
Results provide support for previous studies indicating a linear trajectory of WM
development from childhood to adolescence. However, in all but one instance (i.e. static
visual-spatial WM), WM development did not show the anticipated quadratic relationship
with age. The developmental trajectory of verbal WM appears to increase linearly
through at least early adulthood, while the trajectory of dynamic visual-spatial WM
shows a more complex relationship, with WM development declining slightly in
mid-adolescence before increasing again in early adulthood. The impact of processing demand
on WM development was also assessed across domains. Overall, WM development
appears to be largely unaffected by processing demand, with the exception of
ACKNOWLEDGEMENTS ... iii
ABSTRACT ... iv
LIST OF TABLES ... vi
LIST OF FIGURES ... vii
CHAPTER 1:INTRODUCTION ...1
CHAPTER 2:METHOD ...14
CHAPTER 3:RESULTS ...20
CHAPTER 4:DISCUSSION ...44
Table 2.1 Demographic Characteristics ...18
Table 2.2 Wombat Structure and Subtests ...19
Table 3.1 Descriptive Statistics ...24
Table 3.2 Correlation Matrix of Subtests with Age ...25
Table 3.3 Correlation Matrix of Domain Composites with Age ...26
Table 3.4 Overall Multivariate Polynomial Regression Results across Domain Composites ...27
Table 3.5 Univariate Polynomial Regression Results across Domain Composites ...28
Table 3.6 Overall Multivariate Polynomial Regression Results across Subtests ...29
Figure 3.1 Developmental Trajectory of Verbal WM Domain ...32
Figure 3.2 Developmental Trajectory of Dynamic Visual-Spatial WM Domain ...33
Figure 3.3 Developmental Trajectory of Static Visual-Spatial WM Domain ...34
Figure 3.4 Developmental Trajectory of Digits Backward (Verbal WM) ...35
Figure 3.5 Developmental Trajectory of Digits Forward Interference (Verbal WM-Executive Attention) ...36
Figure 3.6 Developmental Trajectory of Dots Up (Static Visual-Spatial WM) ...37
Figure 3.7 Developmental Trajectory of Digits Forward (Verbal STM) ...38
Figure 3.8 Developmental Trajectory of Dots (Static Visual-Spatial STM) ...39
Figure 3.9 Developmental Trajectory of Dots Interference (Static Visual-Spatial WM-Executive Attention) ...40
Figure 3.10 Developmental Trajectory of Dots Sequence (Dynamic Visual-Spatial STM) ...41
Figure 3.11 Developmental Trajectory of Dots Sequence Backwards (Dynamic Visual-Spatial WM) ...42
INTRODUCTION
Impact of Working Memory
Working memory (WM) can be thought of as our ability to temporarily retain
small portions of information for use in ongoing cognitive processes (Baddeley, 2000;
Conway et al., 2005; Cowan et al., 2005). Measures of WM have been shown to be
closely related to measures of achievement and intelligence (Alloway & Alloway, 2010;
Oberauer, Schulze, Wilhelm, & Süß, 2005; Swanson & Siegel, 2001) as well as attention
(Engle, 2002; Kane et al., 2007), illustrating the critical role WM plays in the learning
process. Children with poor verbal WM capacity may struggle to follow multipart
instructions, have difficulty holding information within their minds long enough to
process it, and are more likely to report that their mind has wandered off-task during
challenging activities (Kane et al., 2007). These difficulties are often associated with
marked impairments in children’s ability to complete educational assignments.
WM also plays a crucial role in the development of many important academic
skills, including skill in reading and mathematics. WM is strongly associated with the
development of math calculation skills (Alloway, 2006; Cowan & Alloway, 2009), as
well as with mathematical word problems (Swanson & Beebe-Fankenberger, 2004). As
children progress from learning single-digit multiplication to two and three-digit figures,
mathematical skill seems to vary depending upon the type of math problem involved as
well as the child’s age. For instance, although studies have shown that verbal WM is
associated with the development of math skills in young children, this association
becomes less significant by the time children reach adolescence (Alloway, 2006). WM
ability has also been found to be a predictor of specific learning disabilities in
mathematics (Cowan & Alloway, 2009; Swanson & Siegel, 2001), with deficits in verbal
WM, visual-spatial WM, and attentional processing related to lower computational skills
and poor performance on word problems incorporating arithmetic (David, 2012; Siegel &
Ryan, 1989; Swanson & Siegel, 2001).
The impact of children’s WM capacity on educational outcomes can also be seen
in the development of reading skill. Current evidence regarding WM’s role in reading
suggests that verbal short-term memory (STM) is significantly related to early reading
achievement, primarily due to its role in the acquisition of letter knowledge and
phonological processing. In particular, complex WM tasks, which involve both storage
and manipulation of information, have been found to be more predictive of reading
achievement than simple memory span tasks assessing storage alone (Cowan & Alloway,
2009). Yet despite its impact on the acquisition of early reading skills, deficits in WM
have not been shown to be a cause of reading disabilities. Rather, its role seems to be
through its impact on phonological processing. Children with reading disabilities tend to
be able to recall fewer strings of letters than typically developing children (Henry, 2012)
and perform more poorly on nonword repetition tasks (Rispens & Baker, 2012),
supporting the idea that verbal STM is impaired in these individuals. Younger children
typically developing peers, indicating a reduced sensitivity to phonological similarities
and/or differences (Siegel & Linder, 1984). In contrast, significant differences in
visual-spatial STM in children with reading disabilities compared to typically developing peers
have not been found, suggesting that WM’s relationship with reading disabilities may be
linked specifically to the verbal domain.
Given the role WM plays in achievement, it is hardly surprising that WM deficits
have been linked to difficulties associated with other clinical populations as well. STM
and language impairments, for instance, are highly related, with simple repetition tasks
providing one of the best indicators of specific language impairment (Cowan & Alloway,
2009). Nonword repetition tasks are also particularly telling, as children with language
impairments tend to score several grade levels below their peers (Archibald &
Gathercole, 2006). Yet, similar to children with reading disabilities, children with
language impairments typically do not show impairments in visual-spatial WM,
highlighting that their WM deficits are related specifically to the verbal domain
(Archibald & Gathercole, 2006).
WM deficits have also been linked to problems associated with attention
deficit/hyperactivity disorder (ADHD), though the impact seems to vary depending upon
the “type” of ADHD indicated. Children and adolescents with a predominantly
inattentive presentation of ADHD tend to show marked deficits in WM; in fact, WM
deficits are considered a hallmark of the disorder (Cowan & Alloway, 2009). Although
WM deficits have been consistently linked to the predominantly inattentive presentation
of ADHD, research has not yet determined whether WM deficits could be a cause of the
contrast, children with ADHD who have a predominantly hyperactive presentation tend
to show impairments in other aspects of executive functioning but not in WM (Cowan &
Alloway, 2009).
Development of WM
Given the long-lasting and wide-ranging impacts that WM deficits can have,
understanding the typical developmental trajectory of WM is essential if teachers, school
psychologists, and other professionals are to recognize and intervene when a child’s WM
development shows signs of delay. In terms of the development of WM abilities, one of
the most important and factors influencing the capacity of WM, and thus one of the most
predictive, is one’s age (Gathercole, 1999). Literature concerning the development of
WM has consistently pointed to a linear increase in WM capacity from early childhood to
adolescence (e.g. Gathercole, 1998; Gathercole, Pickering, Ambridge, & Wearing, 2004;
Goldstein et al., 2014; Thaler et al., 2013). At the age of 5, for example, children are able
to repeat back approximately three words in order, which increases steadily in a linear
fashion, to four words by the age of 9 and five words by the age of 11 (Henry, 2012).
Research regarding the development of WM has typically focused on
developmental increases in WM span. In one of the most comprehensive studies
involving the development of WM across content domains, Gathercole and colleagues
(2004) investigated the structure and development of WM in children and adolescents
aged 4 to 15 years. The authors administered three measures of each of the three
components of the Baddeley and Hitch (1974) WM model (i.e. the phonological loop,
visuospatial sketchpad, and central executive). Verbal storage was measured using digit,
block tapping, mazes, and visual pattern tasks. The central executive functions were
measured using complex memory span tasks, including digits backward, listening recall,
and counting recall, which involve processing via the central executive as well as storage
within the verbal domain (Gathercole et al., 2004). Gathercole and colleagues found
evidence that the basic structure of the Baddeley and Hitch WM model was present in
children from at least 6 years of age. In addition, the authors found linear increases across
each of the short-term and WM components measured from 4 years of age to
adolescence. There was a slight variation in the developmental trajectory of one of the
components within the study (Gathercole et al., 2004), with performance on the visual
pattern span task appearing to level off around 11 years of age. In contrast, the authors
found that development across each of the other tasks appeared to increase linearly from
age 4 to 14 years, leveling off between 14 and 15 years of age. It is notable, however, that
although each of the tasks showed a linear trend in development overall, several showed
periods of decline or plateau before increasing again in subsequent years. Given that
Gathercole and colleagues’ sample did not include individuals above the age of 15, it is
possible that some of these trajectories may have continued to rise throughout later
adolescence.
A more recent study by Goldstein and colleagues (2014) indicated a similar trend,
with verbal WM span increasing linearly from 6 to 14 years of age, though the authors
faced the same limitation regarding the ceiling of their sample’s age range, which
included children only to age 14. Though these findings seem to support the steady
increase of WM through the age of 14, other studies regarding the development of verbal
1998, 1999; Thaler et al., 2013). Still, although there remains some debate regarding the
age at which development levels off, the initially linear trajectory of WM development
from early childhood to adolescence has been well-supported.
In a recent study, Alloway and Alloway (2013) investigated the development of
WM within a broad age range, including individuals from 5 to 80 years of age. Similar to
previous studies, the authors found considerable growth in WM from childhood through
adolescence. However, contrary to the studies described previously (i.e. Gathercole,
1998, 1999; Gathercole et al., 2004; Goldstein et al., 2014; Thaler et al., 2013), the
authors found that WM performance actually peaked in 30-year olds, rather than in
adolescence. A 2015 study by Isbell, Fukuda, Neville, and Vogel reported similar
findings regarding the development of visual WM. The authors investigated visual WM
capacity in 13, 16, and 20 year olds. Results indicated that visual WM capacity did not
reach adult levels in the teenage samples, but continued to develop through adolescence
and into adulthood. Thus, it remains unclear as to when the development of WM capacity
ceases to increase and begins to level off.
Factors Influencing the Development of WM
Many potential explanations for the developmental increase in WM have been
suggested, including an increase in articulation or speech rate, an increase in processing
speed, and an increase in the space or capacity of WM storage itself (Cowan & Alloway,
2009). The development of rehearsal strategies is another possible factor that may
contribute to an increase in WM capacity. Rehearsal strategies involve consciously
repeating information over and over again within your mind in order to maintain the
differences in WM and strategy use are particularly apparent in younger ages, with
rehearsal strategies not appearing to develop until around the age of 7 (Gathercole &
Hitch, 1993). Prior to this age, children do not consistently use rehearsal strategies.
A developmental shift also occurs in children’s visual STM around the age of 7.
Children younger than the age of 7 tend to rely on visual-spatial STM (i.e. the
visuospatial sketchpad) to recall visual information. When recalling items such as
pictures, younger children rely on remembering the physical form of the object, rather
than recoding the information into a verbal form (Palmer, 2000). In contrast, individuals
over the age of 7 are more likely to recode visual information into verbal code, using
verbal STM to store the information, rather than the visuospatial sketchpad (Gathercole et
al., 2004; Henry, 2012; Pickering, 2001).
Different hypotheses exist as to why visual-spatial memory for items that cannot
be verbally recoded also shows steady developmental increases. One possibility
suggested by Isbell and colleagues (2015) is that this increase may be associated with
coinciding changes in brain functioning and development that take place during
adolescence. Others have suggested that the storage capacity of the visuospatial
sketchpad itself may increase, that the increase in visual-spatial memory may be related
to an increase in knowledge within long-term memory, or that it may be due to better
functioning of the central executive (Gathercole et al., 2004). Central executive tasks
have also been found to improve with age, potentially due to a decrease in the processing
demands of memory tasks, which frees resources previously used in processing to be
approaches to aide retention is another possible explanation for the improvement in
central executive tasks (Henry, 2012).
WM Measures
A major confound in exploring the development of WM is the consideration of
how specific aspects of WM measures may impact the outcomes of studies. WM tasks
vary by domain (i.e., visual-spatial or verbal) as well as in the complexity of the task. As
a result, different methods have been devised to measure different aspects of WM.
Traditionally, the phonological loop has been assessed through measures of verbal STM,
which measure the ability to recall speech-based information. These tasks can be
categorized as involving storage alone (typically referred to as STM storage) or storage
plus manipulation (more commonly referred to as WM). The most common measure of
verbal STM storage is the digit span task (Henry, 2012), in which participants are asked
to repeat a series of orally presented numbers. The length of the series is gradually
increased; with the longest list the participant is able to accurately recall representing that
individual’s memory span. Another common measure of verbal STM storage is word
span tasks, which utilize the same procedure described previously, using words rather
than numbers. These tasks are considered “simple span tasks,” as they require only
storage, rather than both storage and manipulation.
Other measures, described as “complex span tasks,” include measures such as
Digit Span, found on the Wechsler Intelligence Scale for Children – Fifth Edition
(WISC-V; Wechsler, 2014), and Numbers Reversed, found on the Woodcock-Johnson IV Tests
of Cognitive Abilities (WJ-IV; Schrank, McGrew, & Mather, 2014). Numbers Reversed
reverse order while Digit Span requires the participant to listen to a series of numbers and
then repeat the numbers back in either the same order, backward, or in ascending order.
Complex span tasks require both storage and manipulation, and are thus considered better
measures of WM, while simple span tasks are typically seen as measuring only STM
storage, rather than tapping the complexity involved in WM.
The visuospatial sketchpad is similarly assessed through measures of
visual-spatial STM. One of the most common measures of visual-spatial STM is block tapping, which
measures spatial span. This task requires participants to watch the examiner tap a series
of blocks and then copy the examiner’s actions, tapping the blocks in the same sequence.
In this instance, the individual’s spatial span is considered the longest sequence that can
be correctly reproduced (Henry, 2012; Pickering, 2001).
A common measure of visual STM is the pattern span task, in which the
participant is shown a grid of boxes depicting a random pattern of shaded and unshaded
boxes. The participant is permitted to view the grid for a short period of time and must
attempt to remember which spaces were shaded and which were not. After exposure, the
grid is removed and the participant has to indicate on a blank grid which spaces had
previously been filled in (Henry, 2012; Pickering, 2001). Difficulty is increased by
increasing the size of the grid and number of boxes to be remembered. The participant’s
score is determined by the highest number they are able to remember correctly. Although
block tapping and pattern-span tasks are commonly used to measure visual-spatial
storage, they are best described as “simple span tasks,” as they require only storage,
Although the importance of WM has been widely acknowledged, few
comprehensive measures of WM exist. Many tests of intellectual abilities include only
verbal WM measures (e.g. Woodcock-Johnson IV Tests of Cognitive Abilities (WJ-IV;
Schrank et al., 2014)). As a result, measures of WM used in research do not
comprehensively measure all of the WM domains (e.g. verbal, visual-spatial, including
static and dynamic visual-spatial sequences) and processing demands (e.g. storage,
storage with manipulation, and interference) that have been identified as important in
contemporary theoretical frameworks (e.g. Baddeley, 2000; Engle, 2002; Englund,
Decker, Woodlief, & DiStefano, 2014; Mammarella, Borella, Pastore, & Pazzaglia).
Unfortunately, this means that researchers often fail to obtain a comprehensive
assessment of an individual’s WM abilities. For example, while the 2004 study by
Gathercole and colleagues described previously provided one of the most comprehensive
examinations of the development of WM across domains, examination of the tasks used
to measure WM reveals weaknesses in the study. While the authors measured verbal,
visual, and spatial STM storage, their measures of complex memory span included tasks
in only the verbal domain (Gathercole et al., 2004). Thus, conclusions can only be made
regarding the development of visual-spatial STM storage in this study, rather than
visual-spatial WM.
In order to address the need for a comprehensive measure of WM, the WM
Battery (WOMBAT) was developed. The WOMBAT is an online, multicomponent
measure of WM developed for use with school-age children, adolescents, and adults
(Englund et al., 2014). The WOMBAT is unique in that it measures multiple components
as other measures do. It includes nine subtests which measure multiple WM content
domains (verbal, static/simultaneous spatial, and dynamic/sequential
visual-spatial), as well as multiple processing demands (e.g. storage-only tasks, storage +
manipulation, and storage + interference) (Englund et al., 2014). Each of the domains
includes three subtests involving different processing demands.
Within the verbal domain, a digit span task, Digits Forward, measures verbal
storage. Digits Backward, which includes verbal storage plus manipulation, is a complex
span task measuring verbal WM, requiring individuals to repeat an increasingly long list
of numbers in reverse order. Finally, Digits Forward-Interference measures verbal WM in
regards to executive attention by assessing verbal storage with interference. In this
subtest, participants hear a series of numbers, followed by an unrelated question which
they must respond yes or no to. After responding to the question, the participants are
asked to repeat the series of numbers in the same order they were presented (Englund et
al., 2014).
Static (simultaneous) visual-spatial WM involves the ability to remember “static,
simultaneously presented spatial locations of static stimuli” (Englund et al., 2014, p.
544). Subtests within this domain include Dots, Dots Up, and Dots-Interference. The first
subtest, Dots, is a variation of the pattern-span task described previously, using dots
rather than shaded squares to measure visual-spatial storage. In the Dots Up subtest, the
task measures visual-spatial WM by requiring participants to remember where the
original dots were and then shifting each dot up one space. Like Digits
Forward-Interference, Dots-Interference is similar to Dots, except that it requires participants to
al., 2014), providing a measure of static visual-spatial WM in regards to
executive-attention.
Finally, the dynamic visual-spatial domain measures the ability to remember
dynamic (sequentially presented) sequences of spatial locations (Englund et al., 2014).
The dynamic visual-spatial domain includes Dots Sequence, Dots Sequence-Backward,
and Dots Sequence-Interference. In order to measure dynamic visual-spatial storage, the
Dots Sequence subtest requires participants to remember the order in which a series of
dots appeared within the grid. In the dynamic visual-spatial WM subtest, Dots
Sequence-Backward again requires participants to remember the order in which dots appeared
within a grid; however, the participants are asked to indicate the order the dots appeared
in reverse order, beginning with the final dot and ending with the first. Finally, Dots
Sequence-Interference is similar to Dots Sequence, but requires the participant to respond
to an unrelated question prior to indicating the order in which the dots moved. Thus, Dots
Sequence-Interference measures dynamic visual-spatial storage with interference, or
dynamic visual-spatial WM-executive attention (Englund et al., 2014).
Purpose of the Present Study
Although previous research has illustrated a linear increase in WM capacity from
childhood to adolescence (e.g. Gathercole, 1998; Gathercole et al., 2004; Goldstein et al.,
2014; Thaler et al., 2013), few studies to date have included samples that extend into the
adult years. In addition, while several studies have suggested that WM capacity increases
linearly until sometime between the ages of 12 - 14 after which it levels off, other studies
have suggested that WM continues to increase into adulthood (e.g. Alloway & Alloway,
as well as the inconsistency of previous results makes it difficult to draw conclusions as
to the developmental trajectory of WM beyond the early teenage years. In addition, the
failure to utilize comprehensive measures of WM in previous studies makes it difficult to
draw conclusions regarding the development of WM across domains.
The primary purpose of this study is to expand upon extant literature by
investigating the developmental trajectory of WM across different WM domains and
processing demands in school age children, adolescents, and young adults from ages 6
through 25 years. This study asks the following questions:
(1) Does the development of various WM domains (i.e. verbal, static
visual-spatial, and dynamic visual-spatial) follow a linear or nonlinear (e.g.
curvilinear) trajectory from childhood through early adulthood (i.e. ages 6 –
25)?
(2) Does the developmental trajectory of these WM domains vary by processing
demand (e.g. verbal STM as compared to verbal WM or verbal STM with
interference)?
In regards to the first research question, based upon previous literature it is hypothesized
that the development of WM will follow a curvilinear (specifically, quadratic) trajectory
across WM domains such that WM development will increase steadily throughout
childhood and adolescence, leveling off in early adulthood. In regards to the second
research question, it is not anticipated that WM development will differ by processing
demand. Thus, it is hypothesized that the development of WM will increase linearly
throughout childhood and adolescence before tapering off in early adulthood, regardless
CHAPTER 2
METHOD
Participants
Participants were selected from a newly developed online measure of WM, the
WM Battery (WOMBAT). Individuals aged six through 25 years were selected from this
dataset in order to assess the development of WM from childhood through adolescence
and early adulthood. The WOMBAT was designed to allow individuals to complete one
subtest or a number of subtests. For the purposes of this study, only those subjects with a
complete profile (i.e., scores for all 9 subtests) were included in the analyses (N = 303,
146 males, 157 females, Mage= 14.82 (5.45), age range = 6 – 25 years). From the original
dataset, a total of 54 cases fell outside of the designated age range and were excluded. An
additional 261 cases were excluded due to incomplete score profiles.
Adult participants included undergraduate and graduate students recruited
primarily from the Psychology department of a large pubic university in the southeast.
Children were recruited from a midsize elementary school in the southeastern United
States, while adolescents attended a midsize suburban high school in the southeast. More
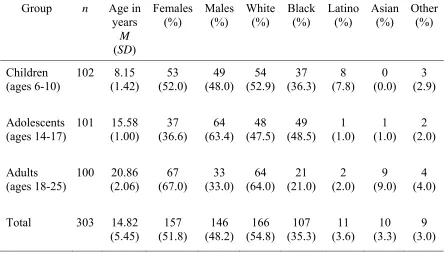
specific demographic information can be found in Table 2.1. Overall, 54.8% of
participants included in the study were White, 35.3% Black, 3.3% Asian, 3.6% Latino,
and 3% other. According to the 2014 U.S. Census, the racial/ethnic composition of the
or more races, with 17.4% identifying as Hispanic or Latino (U.S. Census Bureau, 2015).
Thus, within this sample, white, Asian, and Hispanic/Latino participants were
underrepresented, while black participants were over-represented.
Measures
The WOMBAT is an online measure of WM developed by Julia Englund and
Scott Decker (Englund et al., 2014) at the University of South Carolina. As described
previously, the WOMBAT was designed to measure WM skills using nine subtests:
Digits Forward, Digits Backward, Digits Forward Interference, Dots, Dots Up, Dots
Interference, Dots Sequence, Dots Sequence Backward, and Dots Sequence Interference,
each assessing a different processing demand and content domain associated with WM
(see Table 2.2). The WOMBAT is administered online and has been used by a wide
range of individuals, including children, adolescents, and adults, aged 6 to 77 years.
Administration of the full battery progresses from storage-only tasks of verbal, static
visual-spatial, and dynamic visual-spatial information to storage plus manipulation tasks
in each content domain, and finally to a storage plus interference task in each domain
(Englund et al., 2014). Each subtest consists of 20 items, with a total of 60 items per
content domain. The WOMBAT uses Rasch modeling in order to determine individual
ability level. After four consecutive errors, the subtest ends and the individual proceeds to
the next subtest.
Englund and colleagues (2014) investigated the test-retest reliability, factor
structure and item fit of the WOMBAT using confirmatory factor analyses and Rasch
modeling. Results of the analyses provided support for the three-factor structure of the
and dynamic visual-spatial domains, with more than 98% of items contributing to
measurement of those domains. Test-retest reliability (r = .83, range = .49 (Dots
Interference) - .88 (Dots)) and internal consistency (Chronbach’s α = .90, range = .66
(Dots Sequence) - .85 (Dots Backward)) results indicate that the WOMBAT has adequate
reliability for early-stage research purposes; however, the authors caution that further
refinement of individual items within the test is needed before it can be used for
individual decision making (Englund et al., 2014). Additionally, analyses of the
WOMBAT were conducted using only adolescent and adult samples indicating that
further research is needed in order to ascertain that these results apply to younger
populations.
Data Analyses
For the purposes of this study, a multivariate polynomial regression model was
used in order to determine whether the development of various WM components
follows a linear or curvilinear trajectory from childhood through early adulthood.
Regression techniques are useful in predicting the outcome of one variable (e.g. WM
scores) from another variable (e.g. an individual’s age). Polynomial regression, which
includes higher-order predictor terms in the regression model, can be used to model
curvilinear relationships (Cohen, Cohen, West, & Aiken, 2003). Thus, by employing
polynomial regression we are able to assess whether a nonlinear relationship might be
present. Given the desire to predict multiple correlated outcomes (i.e. the development of
multiple WM components), a multivariate regression model was used in order to address
the primary research question while controlling for the inflation of Type 1 error rates that
Data Inspection
Regression models assume that the relationship between the independent and
dependent variables is linear and that the residuals, or error terms, are independent,
homoscedastic, and normally distributed. Violation of regression assumptions may lead
to biased parameter estimates and/or bias in the standard errors of the regression
coefficients (Cohen et al., 2003). A thorough review of the regression diagnostics was
conducted in order to check for violations of the assumptions associated with multivariate
regression. The data were also inspected for out-of-range values, outliers, and missing
data, as well as multicollinearity and singularity.
In order to check the regression assumptions, the univariate regression model was
run for each subtest with age as a predictor. Linearity and homoscedasticity were
assessed by plotting the residuals against the predicted values of the dependent variables.
If the relationship is linear and homoscedastic the plot of residuals should be randomly
distributed around 0. Outliers were examined using boxplots, with outliers of more than 2
standard deviations away from the mean of each subtest indicated. Independence of
errors was tested by examining the Durbin-Watson statistic of the univariate regression
models. The Durbin-Watson statistic provides a test for residual autocorrelation, which
varies between 0 and 4, with a value of 2 meaning the residuals are uncorrelated. Values
less than 1 and greater than 3 are potentially problematic. Normality was evaluated using
histograms and Q-Q plots of the individual subtests as well as of the residuals.
Histograms should show distributions that approximate the normal curve while Q-Q plots
should show points falling on or near the diagonal line. The data were also assessed for
Table 2.1
Demographic Characteristics
Group n Age in
years M (SD)
Females
(%) Males (%) White (%) Black (%) Latino (%) Asian (%) Other (%)
Children (ages 6-10)
102 8.15
(1.42) 53 (52.0) 49 (48.0) 54 (52.9) 37 (36.3) 8 (7.8) 0 (0.0) 3 (2.9) Adolescents (ages 14-17)
101 15.58
(1.00) 37 (36.6) 64 (63.4) 48 (47.5) 49 (48.5) 1 (1.0) 1 (1.0) 2 (2.0) Adults (ages 18-25)
100 20.86
(2.06) 67 (67.0) 33 (33.0) 64 (64.0) 21 (21.0) 2 (2.0) 9 (9.0) 4 (4.0)
Total 303 14.82
(5.45) 157 (51.8) 146 (48.2) 166 (54.8) 107 (35.3) 11 (3.6) 10 (3.3) 9 (3.0)
Table 2.2
WOMBAT Structure & Subtests
Domains
Demands Verbal Static
Visual-Spatial Visual-Spatial Dynamic
STM Digits Forward Dots Dots Sequence
WM Digits Backward Dots Up Dots Sequence
Backward
WM-Executive
Attention Digits Forward Interference Dots Interference Dots Sequence Interference
CHAPTER 3
RESULTS
Data Inspection
No out-of-range values or missing data were detected during the data inspection
and all means and standard deviations were within reasonable limits. Univariate outliers
(i.e. scores more than 2 standard deviations above the mean) were detected; however,
inspection of the outliers revealed that all scores were within the specified range for each
subtest. No justification to remove the outliers in question could be determined, thus all
cases were included in the analyses.
The data were also assessed for linearity, homoscedasticity, independence, and
normality. As anticipated, results revealed a nonlinear trend in several of the univariate
models, providing additional support for the use of a polynomial regression model.
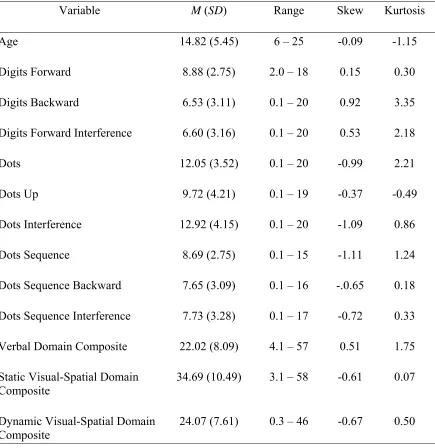
Problems with non-normality in the distribution of the data were also identified and
various transformations were attempted. However, transformation attempts were
unsuccessful in correcting for non-normality and the original, untransformed data were
used in all analyses (see Table 3.1 for descriptive statistics). The presence of multivariate
outliers was also detected; however, as the univariate data could not be corrected, the
multivariate outliers were also retained. No problems with independence were detected.
Values of the Durbin-Watson statistic were all close to 2, with values ranging from 1.77
Regression Results
In order to investigate the developmental trajectory of WM across the specified
age range (i.e. ages 6 – 25 years), multivariate polynomial regression was employed with
the quadratic and cubic terms for age included in the model. In order to explore the
primary research question, composite scores were created by summing each individual’s
subtest scores within each domain (i.e. Verbal, Static Spatial, Dynamic
Visual-Spatial). Composites were then used as the dependent variables for this analysis. The test
of the overall multivariate polynomial regression model, including the full (cubic) model
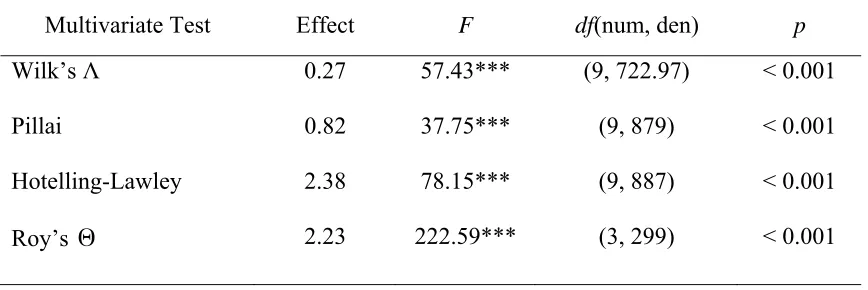
and three domain composites, was significant (Roy’s largest root = 2.23, F(3, 299) =
222.59, p < .01; see Table 3.4), indicating that age is a significant predictor of WM
development. These results provided justification for further analysis of the univariate
regression models.
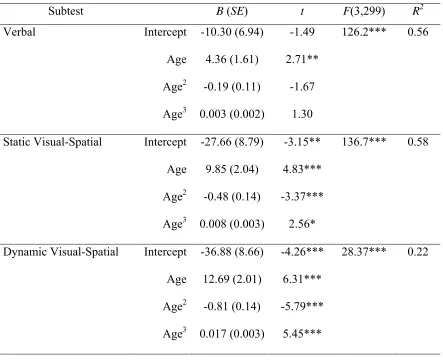
Each of the univariate polynomial regression models investigating the
development of WM across domains was significant (see Table 3.5). Contrary to the
original hypothesis, a linear relationship was indicated between age and verbal WM (t =
2.71, p = .007; Figure 3.1) while the cubic relationship was significant between age and
dynamic visual-spatial WM (t = 5.45, p < .001; Figure 3.2). The relationship between age
and static visual-spatial WM appears to be quadratic (t = -3.37, p < .001; Figure 3.3),
providing tentative support for our original hypothesis. However, the cubic relationship
was also significant in this case (t = 2.56, p = .01), with a second shift in the trajectory
occurring around age 20. Additional research including an expanded age range is needed
In order to test the second research question, multivariate polynomial regression
was again employed, with the nine WOMBAT subtests entered as the dependent
variables. The test of the overall multivariate polynomial regression model, including the
full (cubic) model and all nine subtests, was significant (Roy’s largest root =2.33, F(9,
293) = 75.89, p < .001; see Table 3.6), indicating again that age is a significant predictor
of WM development and providing justification for further analysis of the univariate
regression models across subtests.
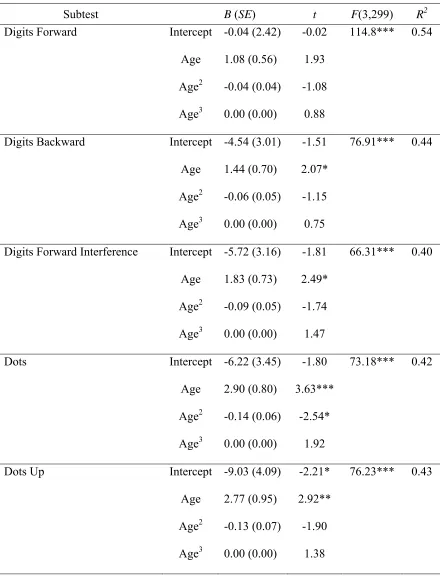
Each of the univariate polynomial regression models was significant (see Table
3.7). However, contrary to the hypothesized curvilinear trajectory across WM content
domains and processing demands, results suggest that many WM components actually
follow a linear trend through childhood, adolescence, and into adulthood. A linear
relationship was indicated between age and Digits Backward (t = 2.06, p = .04; Figure
3.4) as well as Digits Forward Interference (t = 2.49, p = .01; Figure 3.5) and Dots Up (t
= 2.92, p = .004; Figure 3.6). A linear relationship was also suggested between age and
Digits Forward (Figure 3.7); however, the relationship did not reach the .05 level of
significance in this model (t = 1.93, p = .055). It is noteworthy, however, that during
preliminary regression diagnostics, when the quadratic and cubic terms were excluded,
analyses revealed a strong linear relationship between age and Digits Forward (p < .001),
suggesting that the addition of the higher order terms were unnecessary in this instance,
and ultimately masked the linear relationship between age and Digits Forward.
A quadratic relationship was indicated between age and Dots (t = -2.54, p = .01;
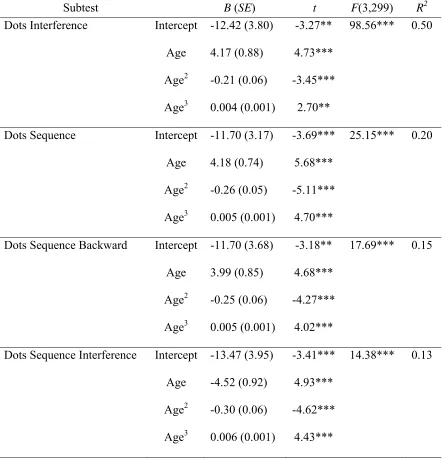
Figure 3.8); however, contrary to the original hypothesis, no other models showed a
Interference (t = 2.70, p = .007; Figure 3.9), Dots Sequence (t = 4.70, p < .001, Figure
3.10), Dots Sequence Backward (t = 4.02, p < .001, Figure 3.11), and Dots Sequence
Interference (t = 4.43, p < .001, Figure 3.12). Complete results for the univariate
polynomial regression models across subtests can be found in Table 3.7.
Overall, results revealed significant relationships with age, including linear,
quadratic, and cubic relationships across both WM domains and processing demands.
Results for the verbal WM components (Digits Forward, Digits Backward, and Digits
Forward Interference) indicated R2 values ranging from .40 - .54, suggesting that age
accounts for a large proportion of the variance in these components. Results for the static
visual-spatial components (Dots, Dots Up, and Dots Interference) indicated R2 values
ranging from .42-.50, again suggesting that differences in age account for a large
proportion of the variance in the components. However, results for the dynamic
visual-spatial WM components (Dots Sequence, Dots Sequence Backward, Dots Sequence
Interference) revealed R2 values ranging from only .13 -.20, suggesting that while age
does account for a significant amount of variance in these components, it is not the
Table 3.1
Descriptive Statistics
Variable M (SD) Range Skew Kurtosis
Age 14.82 (5.45) 6 – 25 -0.09 -1.15
Digits Forward 8.88 (2.75) 2.0 – 18 0.15 0.30
Digits Backward 6.53 (3.11) 0.1 – 20 0.92 3.35
Digits Forward Interference 6.60 (3.16) 0.1 – 20 0.53 2.18
Dots 12.05 (3.52) 0.1 – 20 -0.99 2.21
Dots Up 9.72 (4.21) 0.1 – 19 -0.37 -0.49
Dots Interference 12.92 (4.15) 0.1 – 20 -1.09 0.86
Dots Sequence 8.69 (2.75) 0.1 – 15 -1.11 1.24
Dots Sequence Backward 7.65 (3.09) 0.1 – 16 -.0.65 0.18
Dots Sequence Interference 7.73 (3.28) 0.1 – 17 -0.72 0.33
Verbal Domain Composite 22.02 (8.09) 4.1 – 57 0.51 1.75
Static Visual-Spatial Domain Composite
34.69 (10.49) 3.1 – 58 -0.61 0.07
Dynamic Visual-Spatial Domain Composite
24.07 (7.61) 0.3 – 46 -0.67 0.50
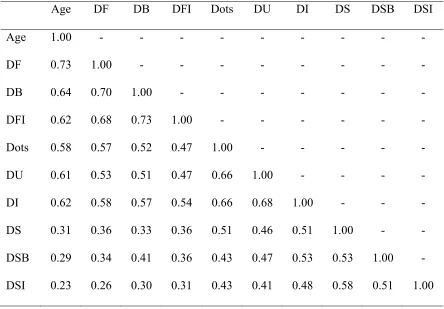
Table 3.2
Correlation Matrix of Subtests with Age
Age DF DB DFI Dots DU DI DS DSB DSI
Age 1.00 - - - -
DF 0.73 1.00 - - - -
DB 0.64 0.70 1.00 - - - -
DFI 0.62 0.68 0.73 1.00 - - - -
Dots 0.58 0.57 0.52 0.47 1.00 - - - - -
DU 0.61 0.53 0.51 0.47 0.66 1.00 - - - -
DI 0.62 0.58 0.57 0.54 0.66 0.68 1.00 - - -
DS 0.31 0.36 0.33 0.36 0.51 0.46 0.51 1.00 - -
DSB 0.29 0.34 0.41 0.36 0.43 0.47 0.53 0.53 1.00 -
DSI 0.23 0.26 0.30 0.31 0.43 0.41 0.48 0.58 0.51 1.00
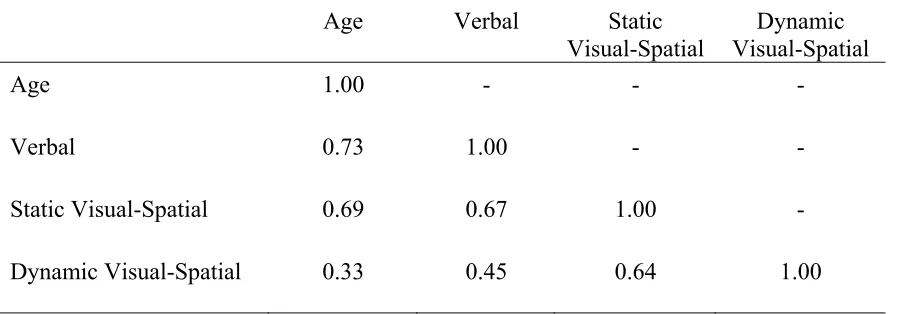
Table 3.3
Correlation Matrix of Domain Composites with Age
Age Verbal Static
Visual-Spatial
Dynamic Visual-Spatial
Age 1.00 - - -
Verbal 0.73 1.00 - -
Static Visual-Spatial 0.69 0.67 1.00 -
Dynamic Visual-Spatial 0.33 0.45 0.64 1.00
Table 3.4
Overall Multivariate Polynomial Regression Results across Domain Composites
Multivariate Test Effect F df(num, den) p
Wilk’s Λ 0.27 57.43*** (9, 722.97) < 0.001
Pillai 0.82 37.75*** (9, 879) < 0.001
Hotelling-Lawley 2.38 78.15*** (9, 887) < 0.001
Roy’s Θ 2.23 222.59*** (3, 299) < 0.001
Table 3.5
Univariate Polynomial Regression Results across Domain Composites
Subtest B (SE) t F(3,299) R2
Verbal Intercept -10.30 (6.94) -1.49 126.2*** 0.56
Age 4.36 (1.61) 2.71**
Age2 -0.19 (0.11) -1.67
Age3 0.003 (0.002) 1.30
Static Visual-Spatial Intercept -27.66 (8.79) -3.15** 136.7*** 0.58
Age 9.85 (2.04) 4.83***
Age2 -0.48 (0.14) -3.37***
Age3 0.008 (0.003) 2.56*
Dynamic Visual-Spatial Intercept -36.88 (8.66) -4.26*** 28.37*** 0.22
Age 12.69 (2.01) 6.31***
Age2 -0.81 (0.14) -5.79***
Age3 0.017 (0.003) 5.45***
Table 3.6
Overall Multivariate Polynomial Regression Results across Subtests
Multivariate Test Effect F df(num, den) P
Wilk’s Λ 0.24 19.49*** (27, 850.51) < 0.001
Pillai 0.89 13.79*** (27, 879) < 0.001
Hotelling-Lawley 2.54 27.30*** (27, 869) < 0.001
Roy’s Θ 2.33 75.82*** (9, 293) < 0.001
Table 3.7
Univariate Polynomial Regression Results across Subtests
Subtest B (SE) t F(3,299) R2
Digits Forward Intercept -0.04 (2.42) -0.02 114.8*** 0.54
Age 1.08 (0.56) 1.93
Age2 -0.04 (0.04) -1.08
Age3 0.00 (0.00) 0.88
Digits Backward Intercept -4.54 (3.01) -1.51 76.91*** 0.44
Age 1.44 (0.70) 2.07*
Age2 -0.06 (0.05) -1.15
Age3 0.00 (0.00) 0.75
Digits Forward Interference Intercept -5.72 (3.16) -1.81 66.31*** 0.40
Age 1.83 (0.73) 2.49*
Age2 -0.09 (0.05) -1.74
Age3 0.00 (0.00) 1.47
Dots Intercept -6.22 (3.45) -1.80 73.18*** 0.42
Age 2.90 (0.80) 3.63***
Age2 -0.14 (0.06) -2.54*
Age3 0.00 (0.00) 1.92
Dots Up Intercept -9.03 (4.09) -2.21* 76.23*** 0.43
Age 2.77 (0.95) 2.92**
Age2 -0.13 (0.07) -1.90
Table 3.7 (continued)
Subtest B (SE) t F(3,299) R2
Dots Interference Intercept -12.42 (3.80) -3.27** 98.56*** 0.50
Age 4.17 (0.88) 4.73***
Age2 -0.21 (0.06) -3.45***
Age3 0.004 (0.001) 2.70**
Dots Sequence Intercept -11.70 (3.17) -3.69*** 25.15*** 0.20
Age 4.18 (0.74) 5.68***
Age2 -0.26 (0.05) -5.11***
Age3 0.005 (0.001) 4.70***
Dots Sequence Backward Intercept -11.70 (3.68) -3.18** 17.69*** 0.15
Age 3.99 (0.85) 4.68***
Age2 -0.25 (0.06) -4.27***
Age3 0.005 (0.001) 4.02***
Dots Sequence Interference Intercept -13.47 (3.95) -3.41*** 14.38*** 0.13
Age -4.52 (0.92) 4.93***
Age2 -0.30 (0.06) -4.62***
Age3 0.006 (0.001) 4.43***
Figure 3.1 Developmental Trajectory of Verbal WM Domain. Possible subtest scores ranged from 0 - 20 possible points. Composite scores indicate the total of the 3 subtests in each domain; thus scores range from 0 – 60 possible points. Scores of 0 were coded as .1 for analyses.
Figure 3.2 Developmental Trajectory of Dynamic Visual-Spatial WM Domain. Possible subtest scores ranged from 0 - 20 possible points. Composite scores indicate the total of the 3 subtests in each domain; thus scores range from 0 – 60 possible points. Scores of 0 were coded as .1 for analyses.
Figure 3.3 Developmental Trajectory of Static Visual-Spatial WM Domain. Possible subtest scores ranged from 0 - 20 possible points Composite scores indicate the total of the 3 subtests in each domain; thus scores range from 0 – 60 possible points. Scores of 0 were coded as .1 for analyses.
Figure 3.4 Developmental Trajectory of Digits Backward (i.e. Verbal WM). Possible subtest scores ranged from 0 - 20 possible points. Scores of 0 were coded as .1 for analyses.
Figure 3.5 Developmental Trajectory of Digits Forward Interference (i.e. Verbal WM-Executive Attention). Possible subtest scores ranged from 0 - 20 possible points. Scores of 0 were coded as .1 for analyses.
Figure 3.6 Developmental Trajectory of Dots Up (i.e. Static Visual-Spatial WM). Possible subtest scores ranged from 0 - 20 possible points. Scores of 0 were coded as .1 for analyses.
Figure 3.7 Developmental Trajectory of Digits Forward (i.e. Verbal STM). Possible subtest scores ranged from 0 - 20 possible points. Scores of 0 were coded as .1 for analyses.
Figure 3.8 Developmental Trajectory of Dots (i.e. Static Visual-Spatial STM). Possible subtest scores ranged from 0 - 20 possible points. Scores of 0 were coded as .1 for analyses.
Figure 3.9 Developmental Trajectory of Dots Interference (i.e. Static Visual-Spatial WM-Executive Attention). Possible subtest scores ranged from 0 - 20 possible points. Scores of 0 were coded as .1 for analyses.
Figure 3.10 Developmental Trajectory of Dots Sequence (i.e. Dynamic Visual-Spatial STM). Possible subtest scores ranged from 0 - 20 possible points. Scores of 0 were coded as .1 for analyses.
Figure 3.11 Developmental Trajectory of Dots Sequence Backwards (i.e. Dynamic Visual-Spatial WM). Possible subtest scores ranged from 0 - 20 possible points. Scores of 0 were coded as .1 for analyses.
Figure 3.12 Developmental Trajectory of Dots Sequence Interference (i.e. Dynamic Visual-Spatial WM-Executive Attention). Possible subtest scores ranged from 0 - 20 possible points. Scores of 0 were coded as .1 for analyses.
CHAPTER 4
DISCUSSION
This study investigated the developmental trajectory of WM across domains,
including verbal WM, static visual-spatial WM, and dynamic visual-spatial WM from
ages 6 through 25 years. The study was designed to contribute to the current literature by
examining the development of WM across a broad age range, utilizing a comprehensive
measure of WM ability which encompassed the full spectrum of the WM domains
identified by current theoretical frameworks. The study also investigated whether the
development of WM varies depending upon the specific processing demand involved in a
given task. Based upon previous literature, it was hypothesized that the development of
WM would show a curvilinear trajectory with WM skills increasing in a linear fashion
across all domains from childhood through adolescence, ultimately tapering off in early
adulthood. It was not anticipated that WM development would differ by processing
demand; thus, a quadratic relationship was anticipated across subtests as well.
Although previous research has investigated the development of WM, results
have been inconsistent due in part to limitations in study design (e.g. inclusion of a
limited sample age range, failure to include a comprehensive array of WM measures).
While previous results have differed regarding the age at which WM ability peaks, they
have typically been in agreement regarding the quadratic nature of WM development.
appears to follow the anticipated quadratic trajectory, the development of verbal WM
follows a linear course through early adulthood. Dynamic/sequential visual-spatial WM
development also deviates from the anticipated quadratic trajectory, appearing to go
through multiple periods of growth and decline. These results were surprising and
contrary to our original hypothesis that WM development would show an initially linear
trajectory before leveling off in early adulthood, regardless of WM domain or processing
demand. Following, we discuss how these results fit within the existing literature, as well
as possible explanations and implications for these findings.
WM Development across Domains
As noted, results of this study reveal that verbal WM follows a linear
developmental trajectory from childhood through at least early adulthood (see Figure
3.1). While this finding coincides with the first part of our hypothesis regarding a linear
increase in WM capacity from childhood through adolescence, the hypothesis that
development would then taper off in early adulthood was not supported. This result
appears to support previous literature indicating a linear trend in WM development from
childhood to adolescence (e.g. Gathercole, 1998; Gathercole et al., 2004; Goldstein et al.,
2014; Thaler et al., 2013). However, contrary to the authors’ conclusions that the
development of WM increases only to approximately age 12 – 14, the results of this study
indicate that Verbal WM continues to develop into early adulthood and possibly beyond.
This finding provides additional support for Alloway and Alloway’s 2013 study, which
found that the development of WM continues to increase well into adulthood.
Results of the investigation regarding the development of static visual-spatial WM
that WM development follows a quadratic/curvilinear trajectory, increasing in a linear
fashion from childhood through adolescence before tapering off in early adulthood. The
strongest relationship in this model appeared to show a quadratic trend, with development
increasing linearly until approximately age 18, at which point it seemed to plateau.
However, the model also suggests the possibility of a cubic relationship, with the
trajectory appearing to increase again sometime after age 20 (see Figure 3.3). Given that
this increase appears to be quite small and the sample included individuals only to age 25,
additional research is needed to confirm whether the development of static visual-spatial
WM is in fact quadratic, or if the cubic model would provide a better fit.
The hypothesis regarding the development of dynamic visual-spatial WM was
also not supported. Rather than the quadratic relationship that was hypothesized, results
indicate that the overall trajectory appears to follow a cubic path. While development did
show an initially linear trend before subsequently dropping off around ages 12 to 13,
development appeared to increase again after age 20 (see Figure 3.2). These results
extend previous findings which have indicated an initially linear trajectory of
visual-spatial WM development until age 11 – 14 (e.g. Gathercole, 1998; Gathercole et al.,
2004), while providing preliminary support for the recent findings by Isbell and
colleagues (2015) which indicated that the development of visual-spatial WM appears to
continue into adulthood. Additional analyses including expanded age ranges are needed
to clarify these results.
There are several possible explanations as to why the results of this study differ
from those reported by previous studies. First, a majority of the literature regarding WM
results of the current study confirm previous findings regarding the initially linear
development of WM from childhood to adolescence. However, it appears that the authors
were premature in concluding that development peaks in adolescence. Given the
restricted age range included in most studies, it is possible that previous studies may have
witnessed similar trends if older adolescents and young adults had been included in the
samples.
Additionally, some studies have included samples with a discrete age group
within each of the developmental phases (i.e. childhood, adolescence, and adulthood),
rather than a comprehensive sample of individuals across all ages. For example, Isbell
and colleagues (2015) investigated visual-spatial WM capacity in individuals aged 13,
16, and 23 years, with results of the study indicating that development appears to
continue into adulthood. Given the discrete age groups utilized, however, it is unlikely
that the authors would have been able to detect subtle shifts in the developmental
trajectory which may have indicated possible quadratic or cubic relationships, as were
found in the current study.
Another explanation for these results relates to the specific domains measured.
Although this study included a comprehensive measure of WM across domains, previous
studies have typically focused on solely on verbal or visual-spatial WM components. Few
studies have investigated static and dynamic visual-spatial WM trajectories
independently. Given that the results of the current study regarding static visual-spatial
WM development were consistent with previous findings regarding a quadratic trend in
research have focused more on static visual-spatial WM than dynamic visual-spatial WM.
The results of this study may begin to fill this gap.
Finally, although the results of the present study show that verbal WM follows a
linear trajectory, it should be noted that our results extend only to age 25. It is possible
that, given a broader age range, the anticipated quadratic relationship may have become
apparent in subsequent years. For instance, while our results provide additional support
for Alloway and Alloway’s (2013) findings regarding the development of verbal WM
into adulthood, the authors noted a peak in development within one’s 30s indicating that
the developmental trajectory of verbal WM was ultimately quadratic, despite its initially
linear trend.
Impact of Processing Demand
A secondary goal of this study was to investigate whether the developmental
trajectory of each WM domain varies by processing demand. It was again hypothesized
that the development of WM would follow a curvilinear (i.e. quadratic) trajectory with
WM skills increasing in a linear fashion from childhood through adolescence, ultimately
tapering off in early adulthood. Results for subtests within the verbal domain were
consistent with those of the overall composite, with both Digits Backward (verbal WM)
and Digits Forward Interference (verbal WM-executive attention) indicating a linear
trend. While the relationship between Digits Forward (verbal STM) and age did not reach
significance at the .05 level, analyses conducted during preliminary data inspection
indicated a strong linear relationship for that component as well, suggesting that the use
verbal WM development follows a linear trajectory through early adulthood, regardless
of processing demand.
In contrast, results for the static visual-spatial subtests varied by processing
demand (i.e. STM, WM, or WM-executive attention). The STM subtest (Dots) showed
the hypothesized quadratic relationship, similar to that seen in the overall domain
composite. However, the WM subtest (Dots Up) followed a linear developmental
trajectory, while the WM-executive attention subtest (Dots Interference) showed a
possible cubic relationship. Thus, the developmental trajectory of static-visual spatial
WM appears to vary substantially depending upon which processing demand is used. The
reason for these differences is unclear. As was noted previously, there were several
potential problems with the data regarding possible outliers and abnormal distributions
that were unable to be corrected prior to analysis. It is possible that the variation seen
across subtests in this domain reflects artifacts of the data. Additional research is needed
to clarify these results.
Investigation of the dynamic visual-spatial subtests revealed results consistent
with those of the overall composite. All three subtests, Dots Sequence (dynamic
visual-spatial STM), Dots Sequence Backward (dynamic visual-visual-spatial WM), and Dots
Sequence Interference (dynamic visual-spatial WM-executive attention), showed
curvilinear trajectories, similar to that seen in the dynamic visual-spatial composite.
Overall, these results suggest that the development of dynamic visual-spatial WM follows
a cubic trajectory, with development appearing to increase from childhood to early
adolescence, then declining in adolescence and increasing again in early adulthood. As
contrary to our original hypothesis that development would approximate a quadratic
relationship. However, as indicated previously, though age accounted for a significant
amount of the variance across the verbal and static visual-spatial tasks, with R2 ranging
from approximately .40 to .50, it did not appear to be highly related to the dynamic
visual-spatial tasks which had R2 values ranging from only .13 to .20. This suggests that
while dynamic visual-spatial WM does vary to some extent by age, age is not the primary
predictor of these abilities.
Implications
Results of this study hold both theoretical and practical implications. From a
theoretical standpoint, the difference in developmental trajectories across WM domains
provides support for theoretical frameworks which have identified multiple related but
distinct components within the WM construct. The differing developmental trajectories
evidenced across verbal, static visual-spatial, and dynamic visual-spatial WM suggest
that these tasks are in fact measuring different abilities. As static and dynamic measures
of visual-spatial WM have not typically been included in developmental research, these
results provide important evidence for the preliminary support for the future inclusion of
static and dynamic visual-spatial WM measures in the comprehensive assessment of WM
ability.
It is unclear what causal mechanism might be at play within WM development
that might predict the variation in developmental trends seen across individual
components. In order to understand and confirm these results, it will be important for
future studies to not only replicate these results, but to investigate potential causal
instance, we know that the brain goes through substantial maturational changes during
childhood and adolescence. Can changes in brain development explain coinciding
changes in the development of WM? Are there other neurological features or cognitive
abilities that show similar patterns of development? What impact, if any, does education
or environment have on the development of WM? These questions will be important to
consider in future research.
The results of this study also have important practical implications in terms of test
development and measurement. These findings provide additional support for the
inclusion of tasks that will assess WM across verbal, static visual-spatial, and dynamic
visual-spatial domains. At present, commonly used measures of cognitive abilities (e.g.
the WISC-V, WJ IV) typically under represent visual-spatial WM, providing an
incomplete picture of an individual’s WM abilities. If static and dynamic visual-spatial
WM abilities continue to be distinct from one another in future research, it will be
important for future measures of WM to include these as individual domains. In addition,
understanding the anticipated developmental trajectory of WM is critical when
conducting norms or calculating standard scores. Thus, confirmation of these results is
needed in order to ensure correct application within future test development.
Finally, these results can help to inform assessment and intervention practices in
schools, leading to more effective interventions and improvements in academic
achievement. As noted previously, WM capacity has been repeatedly shown to have a
substantial impact on learning and educational outcomes, with deficits linked to
impairments in key academic skills such as reading and mathematics. The impact of WM
WM have been linked to difficulties in various types of mathematical skills and problem
solving, while deficits in verbal WM are associated with difficulties in reading and
mathematics as well as disorders such as ADHD and specific language impairment.
Understanding the developmental trajectory of different WM domains is essential not
only to identify children with WM deficits, but also to inform the selection of appropriate
interventions or accommodations.
Limitations and Future Directions
Several limitations regarding this study should be considered when interpreting
these results. As mentioned previously, outliers and violations of normality were present
across the majority of the WM subtests. While useful in modeling curvilinear
relationships, polynomial regression models can be highly influenced by outliers,
particularly when minimal data are available in the tails of the distribution (Cohen et al.,
2003). Unfortunately, the majority of the subtests included outliers and/or skewed
distributions. This suggests the need for additional data collection in order to attempt to
normalize these distributions. Additional studies are needed to confirm these results.
In addition to problems with the distribution of the data, it should be noted that
the sample was obtained primarily from one geographic region. Additional data should be
obtained from a broader geographic area in order to generalize these results. It was also
noted previously that, while initial analyses showed adequate reliability of the WOMBAT
for use with adolescent and adult populations, further analyses are needed to confirm its
reliability in younger populations. Thus, the results for children included in this sample
large (N = 303), unfortunately, no data were available for individuals aged 11-13, thus
additional data is also needed to confirm the results among this age group.
Conclusion
The current study extends previous research which has noted a linear trend in
WM development from childhood through adolescence, and provides further support for
recent studies indicating that WM continues to develop into adulthood (e.g. Alloway &
Alloway, 2013; Isbell et al., 2015). Though WM deficits are common in children with
learning disabilities and pose significant hurdles for these children in terms of their
academic achievement, they are also invisible and may go unnoticed or ignored in the
classroom. In light of the impact of WM capacity on academic achievement, it is
important that children with impairments in WM be identified early so that potential
interventions and/or accommodations can be put into place. Understanding the typical
developmental trajectory is an important component in being able to identify and
intervene when WM deficits arise. In addition, while the development of WM from
childhood through adolescence has consistently pointed to a linear trajectory, the
developmental trajectory of WM from late adolescence and into adulthood remains
unclear. It will be important for future research to attempt to replicate these results with
broader age ranges in order to determine at what point in development, if any, WM truly
plateaus or begins to decline. Understanding the typical trajectory of WM development
and/or decline is essential if we are to employ interventions that attempt to improve WM