https://doi.org/10.5194/nhess-19-2795-2019 © Author(s) 2019. This work is distributed under the Creative Commons Attribution 4.0 License.
Probabilistic modelling of the dependence
between rainfed crops and drought hazard
Andreia F. S. Ribeiro1, Ana Russo1, Célia M. Gouveia1,2, Patrícia Páscoa1, and Carlos A. L. Pires1 1Instituto Dom Luiz (IDL), Faculdade de Ciências, Universidade de Lisboa, 1749-016 Lisbon, Portugal 2Instituto Português do Mar e da Atmosfera, Lisbon, Portugal
Correspondence:Andreia F. S. Ribeiro ([email protected]) Received: 12 February 2019 – Discussion started: 19 February 2019
Revised: 28 September 2019 – Accepted: 9 October 2019 – Published: 11 December 2019
Abstract. Extreme weather events, such as droughts, have been increasingly affecting the agricultural sector, causing several socio-economic consequences. The growing econ-omy requires improved assessments of drought-related im-pacts in agriculture, particularly under a climate that is get-ting drier and warmer. This work proposes a probabilis-tic model that is intended to contribute to the agricultural drought risk management in rainfed cropping systems. Our methodology is based on a bivariate copula approach using elliptical and Archimedean copulas, the application of which is quite recent in agrometeorological studies. In this work we use copulas to model joint probability distributions de-scribing the amount of dependence between drought condi-tions and crop yield anomalies. Afterwards, we use the estab-lished copula models to simulate pairs of yield anomalies and drought hazard, preserving their dependence structure to fur-ther estimate the probability of crop loss. In the first step, we analyse the probability of crop loss without distinguishing the class of drought, and in the second step we compare the probability of crop loss under drought and non-drought con-ditions. The results indicate that, in general, Archimedean copulas provide the best statistical fits of the joint probabil-ity distributions, suggesting a dependence among extreme values of rainfed cereal yield anomalies and drought in-dicators. Moreover, the estimated conditional probabilities suggest that when drought conditions are below moderate thresholds, the risk of crop loss increases between 32.53 % (cluster 1) and 32.6 % (cluster 2) in the case of wheat and be-tween 31.63 % (cluster 2) and 55.55 % (cluster 2) in the case of barley. From an operational point of view, the results aim
to contribute to the decision-making process in agricultural practices.
1 Introduction
Agriculture is one of the activities most directly influenced by climate variability (Lesk et al., 2016; IPCC, 2012) and by extreme weather events in particular (IPCC, 2012). The latter are a major source of risk in agricultural systems, of-ten entailing substantial crop yield losses (Bokusheva et al., 2016; Kogan et al., 2015; Saadi et al., 2015). Despite the con-straints associated with the application of certain governmen-tal policies in agricultural systems, the success of mitigating the consequences of climate extremes is largely dependent on the development of appropriate risk management strate-gies (Paredes et al., 2014; Quiroga et al., 2011). For this pur-pose, probabilistic information of the agricultural risk asso-ciated with certain meteorological conditions is currently a major requirement (Madadgar et al., 2017; Jayanthi et al., 2014; Iglesias and Quiroga, 2007), particularly within the scope of projected climate changes (Hernández-Barrera and Rodríguez-Puebla, 2017; Ferrise et al., 2011).
indexes in the IP, based on long-term time series including the entire 20th century, particularly in southern regions (Pás-coa et al., 2017a; Sousa et al., 2011), and the expected declin-ing of crop yields due to future warmdeclin-ing conditions has also been pointed out (Hernández-Barrera and Rodríguez-Puebla, 2017; Ferrise et al., 2011).
The assessment of yield variability based on crop and me-teorological information is crucial for a more stable farmer income and management (Reidsma et al., 2010). The recently developed drought index SPEI (Standardized Precipitation Evapotranspiration Index; Vicente-Serrano et al., 2010) is found to be particularly suitable for agricultural drought ap-plications in Mediterranean regions (Zampieri et al., 2017) and shows significant correlations with crop yields in the IP (Ribeiro et al., 2019a; Páscoa et al., 2017b). On the other hand, crop models describing the biological processes are one of the existing tools used to assess crop productivity, e.g. CERES (Crop Environment REsource Synthesis) mod-els (Capa-Morocho et al., 2016; Hlavinka et al., 2010) and AquaCrop (Paredes et al., 2016; Vergni et al., 2015). These crop models are important tools in agrometeorological stud-ies as they are able to compute irrigation requirements and yield simulations, and they have been particularly useful for assessing the impacts of climate change on agricultural pro-ductions (Leng and Hall, 2019; Hlavinka et al., 2010). How-ever, such models are limited in their ability to quantify the impact of climate variability on crop yields over larger scales (Estes et al., 2013), and the detailed representation of crop’s biophysical interactions requires demanding parameteriza-tion settings and input data (Giménez et al., 2016; Paredes et al., 2014, 2016). Thus, empirical modelling constitutes an al-ternative for representing the large-scale impacts of drought conditions in the agricultural sector (Bokusheva et al., 2016; Kogan et al., 2015; Matsumura et al., 2015; Vicente-Serrano et al., 2006), requiring lower computation costs than mecha-nistic modelling (Estes et al., 2013; Ferrise et al., 2011).
In addition, the use of satellite-based data is increasing for agricultural purposes (Kogan et al., 2015; Rojas et al., 2011) and considerable correlations between remote sens-ing of vegetation and crop yield are found in the IP (Ribeiro et al., 2019a; Gouveia and Trigo, 2008; Vicente-Serrano et al., 2006). Some studies have considered the use of ent remote sensing drought indicators to account for differ-ent crop sensitivities to drought, such as to moisture and thermal conditions over the vegetative cycle (Ribeiro et al., 2019a; Bokusheva et al., 2016; Zarei et al., 2013; Kogan, 2001). Moreover, the establishment of models for estimat-ing crop yield under drought influence, usestimat-ing the combina-tion of different drought indicators and different timescales of drought occurrence, have shown an added value in the per-formance of the crop yield simulations over the IP (Ribeiro et al., 2019a; Hernandez-Barrera et al., 2017; Vicente-Serrano et al., 2006).
The statistical modelling of crop yield variability under drought conditions has been previously done to estimate
drought-related crop losses (Ribeiro et al., 2019a; Zampieri et al., 2017; Kogan et al., 2015). Some authors have esti-mated crop yield probability distribution functions to find crop-specific risk levels and have applied Monte Carlo meth-ods to generate large sample sizes of yield distributions over Mediterranean areas (Resco et al., 2010; Iglesias and Quiroga, 2007). At the country level in Europe, Naumann et al. (2015) have developed drought damage functions using a single power law dependence between drought severity and the associated damage. At a regional level in the IP, regres-sion techniques (Ribeiro et al., 2019a; Hernandez-Barrera et al., 2017; Hernández-Barrera and Rodríguez-Puebla, 2017) and artificial neural network (ANN) models (Ribeiro et al., 2019a) have been used to model the response of rainfed win-ter cereal yields to drought conditions. A major conclusion in Ribeiro et al. (2019a) was that there are stronger relation-ships between remote sensing indices and cereal yield in the northern sector of the IP and between SPEI and cereal yield in the southern sector of the IP. This character of the response of crop yields to climate conditions highlights how it varies according to the location, type of crop, moment of the vege-tative cycle, drought indicator and temporal scale.
More recently, copula-based models have been applied for agricultural purposes, to model the dependence structures be-tween crop yields and environmental conditions using joint distributions (Ribeiro et al., 2019b; Madadgar et al., 2017; Bokusheva et al., 2016; Li et al., 2015). The concept of cop-ulas is quite popular in financial risk modelling and has been becoming a valuable tool to model the risks associated with climate hazards, such as droughts (Ganguli and Reddy, 2012; Mirabbasi et al., 2012; Serinaldi et al., 2009). Based on the Sklar’s theorem (Sklar, 1959) a copula approach “joins” the probability of drought occurrence and the probability of crop losses caused by the drought event. A detailed description about the use of copulas is provided by Nelsen (2006).
have also used copulas to assess the likelihood of yield loss in response to droughts based on SPI for the a historical (1961– 2016) and a future period (2071–2100) under the RCP8.5 emission scenario to investigate future changes in yield loss risk. The authors found that global wheat is more vulnerable to droughts than maize, rice, and soybeans and that global warming is expected to amplify drought-driven yield loss risk.
In this study, a copula-based approach is adopted to model the joint probability density function of crop yield and the drought conditions for probabilistic yield assessment, based on the data and empirical analysis previously considered in Ribeiro et al. (2019a). This method allows us to estimate the dependence structures between the probability distributions of crop yield and drought indicators using copula functions. The novelty and interest of this approach relates to the fact that this methodology will allow us to estimate the likelihood of crop loss and compare the expected losses under drought conditions and non-drought conditions in the IP. This key question is posed based on the current demand, of the most interest to stakeholders such as farmers and insurance com-panies, to mitigate agricultural drought risk over the major agricultural areas in the IP.
2 Data and methods 2.1 Study area and data
The exposure analysis performed by Ribeiro et al. (2019a) allowed the identification of two clusters of provinces in the IP dominated by rainfed agricultural practices (Fig. 1), located approximately in the regions of Castilla and Léon (cluster 1 – northern region) and Castilla–La Mancha (clus-ter 2 – southern region). Given the suitability of using these two clusters for an agricultural drought analysis at the re-gional level, here we have considered the same area selec-tion criteria: provinces with more than 50 % of the territory occupied by agricultural areas and more than 50 % of rain-fed crops according to the CORINE Land Cover (2012) (for more details please see Ribeiro et al., 2019a). Considering previous requirements, and for sequential purposes, the crop and drought hazard data used in Ribeiro et al. (2019a) have been incorporated in the present study to analyse the dis-tributions of probabilities. Spatial averages of annual yield anomalies (t ha−1) of barley and wheat were computed over the two clusters during the period 1986–2012, based on pro-duction (t) and area (ha) information obtained from the Por-tuguese National Statistics Institute and the Spanish Agricul-ture, Food and Environment Ministry.
Drought conditions were investigated using the hydro-meteorological drought indicator SPEI and three satellite-based indices obtained from NOAA-AVHRR since 1981, namely the VCI (Kogan, 1990), the TCI (Kogan, 1995) and the Vegetation Health Index (VHI) (Kogan, 1995). The
Figure 1.Provinces with more than 50 % of the territory occupied by agricultural areas and more than 50 % of rainfed crops (yel-low), according to CLC (2012), and selected clusters of provinces. Cluster 1 provinces: Zamora (I), Valladolid (II), Palencia (III), Burgos (IV) and Segovia (V). Cluster 2 provinces: Toledo (VI), Cuenca (VII), Ciudad Real (VIII) and Albacete (IX).
monthly drought index SPEI gridded values, with a spa-tial resolution of 0.5◦, were computed based on precipi-tation and temperature values from the Climate Research Unit TS3.21 database (Harris et al., 2014) using a variety of timescales (1 to 12 months). The weekly global maps of VCI, TCI and VHI were retrieved at 4 km spatial resolu-tion from NOAA’s ftp server (ftp://ftp.star.nesdis.noaa.gov/ pub/corp/scsb/wguo/data/VHP_4km/geo_TIFF/, last access: 21 June 2018). While SPEI computation uses climatic water balance anomalies incorporating the role played by the evap-orative demand on the occurrence of dry events (Vicente-Serrano et al., 2010), the remote sensing indices character-ize the moisture, through the VCI, the temperature-induced stress, through the TCI, and health of vegetation, through the VHI.
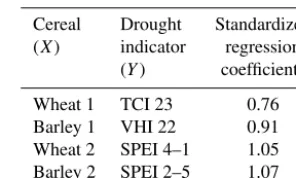
cluster was performed based on the largest absolute value of the standardized regression coefficients from the models de-veloped in Ribeiro et al. (2019a), in order to constitute pairs of cereal yield anomalies and drought indicators. Afterwards, for each cereal time series, the joint probability with drought conditions was estimated using one drought indicator. 2.2 Copula-based method
2.2.1 The concept of copula
Copula functions are powerful tools used to estimate the joint distribution between variables (Madadgar et al., 2017; Boku-sheva et al., 2016; Zhang et al., 2011). The concept of copula was firstly introduced by Sklar (1959) to decompose a joint cumulative distribution function FXY(x, y) into two parts
(Eq. 1): the marginal distribution functions FX(x)=uand
FY(y)=v and the copulaC describing the dependence
be-tweenuandv,
FXY(x, y)=C(u, v), (1)
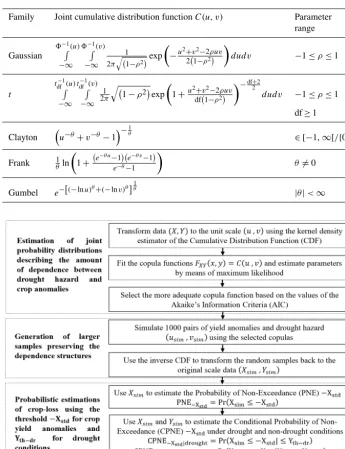
where the marginsuandv are uniformly distributed on the interval [0, 1] (Nelsen, 2006). This study adopts a bivari-ate modelling approach such that for each pair (X, Y) of cereal and drought indicators over each cluster we consid-ered bivariate copula functions to estimate the joint proba-bility distributions. Trivariate copulas have been proposed in the analysis of hydrological extremes (Afshar et al., 2016; Bezak and Brilly, 2014; Saghafian and Mehdikhani, 2014), but the development of higher-dimensional copulas exhibits very complex structures and further studies and evaluations are required. In comparison to high-dimensional copulas, the two-dimensional copulas involve much less computational cost and allow for more easily interpretable and illustratable relationships between the interval margins. For this reason, in the present study we restricted the analysis to the bivariate case using two-dimensional copulas, simplifying the inter-pretation of the results .
There is a range of copula families described in the lit-erature that are able to estimate the dependence between the univariate variables (Nelsen, 2006). The most commonly used copula families focus on the Archimedean and ellipti-cal classes (Maity, 2018). There are three Archimedean copu-las that are particularly popular, given their simple functional form and their different patterns of dependence captures, i.e. Clayton, Gumbel and Frank, while there the two most popu-lar elliptical copulas are derived from elliptical distributions, i.e. Gaussian andt copulas. These five copula functions are well-documented and have been employed in recent agrom-eteorological studies with a number of annual observations similar to our study (Madadgar et al., 2017; Zscheischler et al., 2017; Bokusheva et al., 2016). Table 1 summarizes the mathematical expressions of the referred copula functions considered in the present study.
An important concept for studying extreme events is the tail dependence, whose importance is more critical than the overall dependence structure for risk analysis (Bokusheva, 2014). The joint tail behaviour describes the amount of de-pendence in the corners of upper-right and lower-left quad-rants (i.e. joint extreme events) and its representation de-pends on the type of copula (Nelsen, 2006). The Frank, Gaus-sian andt copulas describe a joint symmetric structure with a symmetric tail dependence, i.e. the same degree of depen-dence in both pairs of extremes. The Clayton and Gumbel copulas have an asymmetric tail dependence with greater de-pendence in the lower or upper tail, suggesting greater prob-abilities of joint lower or upper extremes (i.e. lower or higher values of yield anomalies, given lower or higher values of drought indicators).
2.2.2 Fitting of the copula functions
The estimation of the copula parameters can be performed using different methods based on maximum likelihood, such as maximum likelihood estimate (MLE), inference functions for margins (IFM) or canonical maximum likelihood (CML) (Maity, 2018). With MLE, both individual margins and cop-ula parameters are estimated together, whereas with IFM the marginal parameters are first estimated individually. In this study the statistical inference of the copula functions is per-formed with the CML method, which stands for a nonpara-metric estimation of the margins. In this way, the individ-ual variables were first transformed to the unit scale (pseudo-observations) using the kernel density estimator of the cumu-lated distribution function (CDF) without making assump-tions about the marginal distribuassump-tions (Fig. 2). The drawback of the shorter sample size is surpassed by the nonparametric estimation of the margins, which avoids significant assump-tions about their distribuassump-tions, even when the available sam-ple is rather small (Fahr, 2017; Corder and Foreman, 2011). The fitting of the bivariate copula functions was then applied to the pseudo-observations, and the dependence parameters were estimated by means of maximum likelihood (Fig. 2). Figure 2 summarizes the main steps of the copula-based ap-proach adopted in the present study. For a detailed descrip-tion on fitting methods please see Maity (2018).
Table 1.Equations of the copula functions, whereuandvare univariate variables,8−1is the inverse of standard Gaussian CDF,tdf−1is the inverse Student’stCDF, “df” is the degree of freedom, andρandθare dependence parameters.
Family Joint cumulative distribution functionC(u,v) Parameter range
Gaussian
8−1(u)
R
−∞
8−1(v)
R
−∞ 1
2π
q
1−ρ2exp
−u2+v2−2ρuv
2 1−ρ2
dudv −1≤ρ≤1
t
tdf−1(u)
R
−∞
tdf−1(v)
R
−∞ 1
2π
q 1−ρ2
exp
1+u2+v2−2ρuv
df 1−ρ2
−df+2
2
dudv −1≤ρ≤1
df≥1
Clayton
u−θ+v−θ−1 −1
θ
∈ [−1,∞[/{0}
Frank 1θln
1+ e −θ u−1
e−θ v−1
e−θ−1
θ6=0
Gumbel e−
(−lnu)θ+(−lnv)θ1θ
|θ|<∞
Figure 2.Scheme of the copula-based approach adopted in the present study.
AIC and the cross-validated log-likelihood criteria. For this reason, and given the wide use of the AIC, only the results for model selection based on the AIC will be presented. 2.2.3 Probability of non-exceedance and conditional
probability of non-exceedance
After the estimation of the copula parameters, the established models are used to simulate 1000 pairs of uniformly dis-tributed data (Fig. 2). In the present study, letFXsim(x)=usim denote the simulated CDF of yield x and FYsim(y)=vsim
the simulated CDF of drought indicatory. The data gener-ation using the joint relgener-ationship preserves the dependence structure between the margins. The simulated data in the range [0, 1] are transformed back to the original scale using the kernel estimations of the inverse CDF, providing Xsim andYsim, respectively.
cereal yield anomaly time series, as we are focused on real losses of yield and not just values below the mean (Eq. 2). PNE−XSD=usim(−XSD)=Pr(Xsim≤ −XSD) (2) The PNE gives information about how likely the occurrence of a yield value below a certain threshold is. In other words, it gives the expected chance in percentage that the negative yield anomaly will not exceed (i.e. is not higher than) minus one standard deviation (−1 SD).
Afterwards we partitioned the simulated data points of Xsim into those corresponding to drought (e.g. SPEI<= −0.84; Agnew, 2000, and/or VHI<=40; Ko-gan, 2001) and non-drought conditions (e.g. SPEI>−0.84 and/or VHI>40) (Fig. 2). The respective CDFs were used to estimate the risk of crop loss in terms of the conditional probability of non-exceedance (CPNE) given by Eqs. (3) and (4), where Yth-dr is the drought threshold amounting to −0.84 and 40, respectively, when the SPEI and VHI or TCI are used.
CPNE−XSD|drought=Pr(Xsim≤ −XSD|Ysim≤Yth-dr) (3)
CPNE−XSD|non_drought=Pr(Xsim≤ −XSD|Ysim> Yth-dr) (4)
For the purpose of validation and estimation of confidence intervals, the theoretical values of the above CPNE were in-ferred from the copula functions using the Eqs. (5) and (6) (deduced from the definition of conditional probability),
CPNE−XSD|drought=
C (u−SD, vth-dr)
vth-dr
, (5)
CPNE−XSD|non_drought=
u−SD−C (u−SD, vth-dr)
1−vth-dr
, (6)
where u−SD=FX(−XSD) and vth-dr=FY(Yth-dr) are the marginal probabilities of crop loss and drought occurrence obtained from the kernel-based univariate CDFs. The lower and upper bound of the 95 % confidence interval (ci) of the estimated copula dependence parameters were considered using the Eqs. (5) and (6) in order to obtain the confidence interval of CPNE coming from the inaccuracy of the cop-ula parameter and to address if the CPNE using simcop-ulations (Eqs. 3 and 4) lies within the 95 % confidence level.
In sum, first we describe the joint probability of drought hazard and yield anomalies and simulate pairs of data pre-serving their dependence structure. After that, probability of crop loss (PNE) and conditional probability of crop loss (CPNE) are estimated, addressing whether the proba-bility of crop loss under drought conditions is higher than during non-drought conditions and if distinguishing drought severity is important. The probability distributions (based on a normal kernel function) of the generated yield anomalies are also analysed for graphical visualization of the area cor-responding to crop loss.
Table 2.Variables used for copula application. In the first column, the numbers 1 and 2 correspond to the respective provincial cluster (clusters 1 and 2). In the second column, the numbers correspond to the selected weeks in the case of the remote sensing indices and to the selected months and timescales (in months) in the case of SPEI. The values of the standardized regression coefficients were determined by Ribeiro et al. (2019a).
Cereal Drought Standardized (X) indicator regression
(Y) coefficients
Wheat 1 TCI 23 0.76
Barley 1 VHI 22 0.91
Wheat 2 SPEI 4–1 1.05 Barley 2 SPEI 2–5 1.07
3 Results
3.1 Fitting copula models
The estimates of the dependence between the yield anoma-lies and drought hazard were performed using the selected drought indicators outlined in Table 2. This selection of drought indicators highlights that the response of crop yields to climate conditions varies according to the location, type of crop, moment of the vegetative cycle and chosen tempo-ral scale. While annual yield anomalies in cluster 1 are better characterized by short-term responses to the drought condi-tions based on the weekly values of TCI and VHI, the annual yield anomalies in cluster 2 are better characterized by the monthly response to the dry conditions based on the SPEI. In terms of predictability, the effects of temperature (TCI) and vegetation health (VHI) during late growth stages (weeks 23 and 22 correspond approximately to end of May and begin-ning of June, respectively, for wheat and barley) are the most influential conditions in the northern cluster. On the other hand, the yields in cluster 2 are influenced by drought condi-tions described by SPEI much earlier, in the beginning of the intermediate growth stages (February and April with 5 and 1 month timescales, respectively, for wheat and barley). In this way, the importance of including multiple drought re-sponse timescales is evidenced for predictability purposes and assessment of drought-related crop losses.
di-Figure 3.Empirical cumulative distribution functions (ECDF, blue points), kernel density estimation of the CDF (red line), crop loss and drought thresholds (dotted black vertical line), respective marginal probabilities of crop loss and drought occurrence (dotted black horizontal line), and pseudo-observations (scatter) of the margins on the interval [0, 1].
agonal line (Fig. 3, bottom panels), mainly due to the cor-relations between the yield and selected drought indicators (Ribeiro et al., 2019a). Most of the work based on copulas has estimates of the marginal distribution functions (Afshar et al., 2016; Bokusheva et al., 2016; Mirabbasi et al., 2012), whereas this procedure has no requirement for prior knowl-edge of the marginal distributions, therefore incurring less significant assumptions.
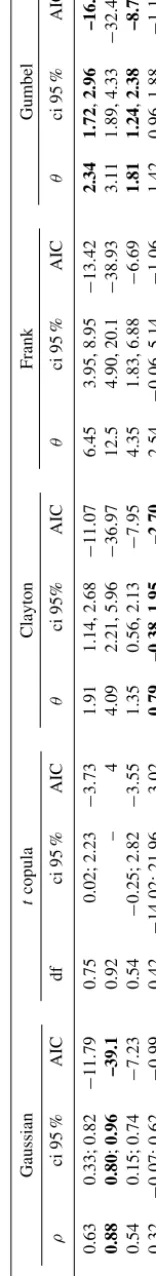
The estimates of the dependence between the yield anoma-lies and drought indicators were performed using the copula functions from Table 1 (Gaussian, t copula, Clayton, Frank and Gumbel). Table 3 indicates each copula dependence pa-rameter estimate (ρ, df or θ) and respective AIC values. Based on the values of AIC, a Gaussian copula, a Clayton copula and two Gumbel copulas were eligible to perform the best fits (Table 3). In general, the Archimedean copulas are better suited to estimate the joint distributions between crop yield and drought indicators in most of the cases (Table 3), with the exception of barley in cluster 1, which is better fit-ted by a Gaussian copula. Given that AIC penalizes the num-ber of estimated parameters (Wilks, 2006),t copulas are not expected to be chosen, since they have two parameters that control the tail dependence.
The selected copula functions (Table 3) suggest that, in general, the relationship between yield and drought condi-tions is described by an asymmetric dependence in the tails of the joint distributions, except in the case of barley in
clus-ter 1. This feature is illustrated in Fig. 4, showing the dif-ferent shapes and contours of the selected copula densities. While wheat in cluster 1 and 2 shows a stronger dependence in the upper tail of the joint distributions based on Gumbel copulas (suggesting higher probability of observing a higher value of yield anomalies given a high value of the drought indicators), barley in cluster 2 shows stronger dependence in the lower-left tail based on a Clayton copula, suggesting higher probability of finding a lower value of yield anomalies given a low value of the drought indicators. The randomly generated yield and drought data were transformed back to the original scales (Fig. 4, bottom row) and the respective scatter plots indicate that more extreme values are generated using the joint distribution relationships. In general, the mod-elling of the joint distributions leads to results close to the real observations (Fig. 4, bottom panel).
3.2 Probability of non-exceedance and conditional probability of non-exceedance using copula simulations
Figure 4.Selected joint probability distribution functions (PDFs) whereuandvare scalar values on the interval [0, 1] (top row), contours showing the two-dimensional view of PDFs (middle row) and observed (red triangles), and copula-based simulation (density squares) scatter plots of crop yields and drought indicators (bottom row).
disregarding a drought threshold (using only simulations of yield) and compare the probability of crop loss under drought and non-drought conditions (by means of both simulations of yield and respective drought indicator). One of the key advantages of estimating the values of PNE and CPNE by means of the copula simulations is the use of larger samples that are comprised of more joint extreme values based on the joint behaviour of crop yields and drought hazard.
Figure 5 shows the PNE curves and the distributions of the simulations of yield anomalies, with the respective crop loss area correspondent to the probability (%) of the yield anomaly not exceeding −1 SD. The PNE curves indicate a more than 19 % chance of having crop losses in all cases. According to Fig. 5, wheat at cluster 1 is the cereal with the highest risk level (22 %), followed by barley in cluster 1 (19.8 %), wheat in cluster 2 (19.4 %) and barley in cluster 2 (19.2 %) (Fig. 5). As mentioned before, the wheat’s left tail area (negative yield anomalies) is slightly higher in cluster 1, suggesting a higher risk of wheat loss in the northern sector of the IP.
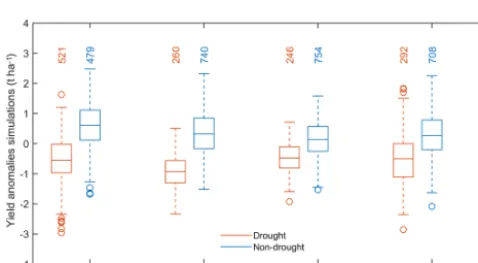
The following target was to compare the likelihood of crop loss under drought and non-drought conditions. Figure 6 shows the simulated crop yield anomalies during drought (or-ange boxplots) and non-drought (blue boxplots) events. As expected, the boxplots show lower (and negative in average) values of yield anomalies during drought events in compari-son with non-drought episodes. Although the number of
sam-ples simulated under drought conditions is smaller than un-der non-drought conditions (Fig. 6), the use of copula simu-lations enhances the amount of simulated joint low extremes (i.e. co-occurrence of crop loss and drought events).
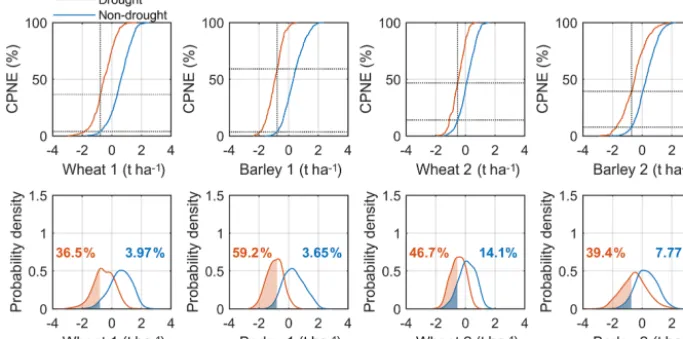
The differences in terms of crop losses between cereals and regions is much evident when differentiating the climatic conditions (Fig. 7), particularly during drought conditions. Figure 7 shows that the values of CPNE under drought (non-drought) conditions are above (below) the values of PNE il-lustrated in Fig. 5. In comparison with the distributions of yield simulations without conditioning to specific thresholds of the drought indicators shown in Fig. 5, in Fig. 7 the distri-butions of the yield simulations during drought events show a shift to the left towards negative values of yield anoma-lies, while the distributions of yield simulations during non-drought events show a shift to the right towards positive val-ues of yield anomalies (Fig. 7). The case of barley in clus-ter 1 is quite distinct exhibiting a drought-related barley loss almost 3 times higher than the value illustrated in Fig. 5 (19.8 %), supporting the importance of conditional probabil-ities for agricultural drought risk purposes. The conditional probability of wheat loss (Fig. 7), is also higher when focus-ing on drought conditions, although it is less than 2 times the values shown in Fig. 5.
Figure 5.Probability of non-exceedance (PNE) function (%) of yield anomalies (top row) in both clusters based on the derived simulations from the estimated copulas and respective probability density estimates (bottom row). In the bottom row, the red values indicate the proba-bility of crop loss, which is also indicated in the top row by the intersected dashed lines, indicating the threshold of crop loss and respective PNE value.
Figure 6. Wheat and barley yield simulations, differentiating drought (orange) and non-drought conditions (blue) according to the respective drought indicator denoted in parenthesis in thextick label. The numbers on top of the boxplots denote the sample size of the simulations under the different climatic conditions.
on cluster 1 (59.2 %) than on cluster 2 (39.4 %), while it is quite similar on both clusters in Fig. 5. While barley suggests higher conditional probabilities of crop loss under drought conditions in cluster 1, wheat suggests higher conditional probabilities of crop loss under drought conditions in clus-ter 2 (46.7 %) in comparison to clusclus-ter 1 (36.5 %). Among all the cases, the highest level of drought-related crop loss is 59.2 %, observed in the case of barley in cluster 1, followed by wheat in cluster 2 with 46.7 % chance of crop loss under dry conditions.
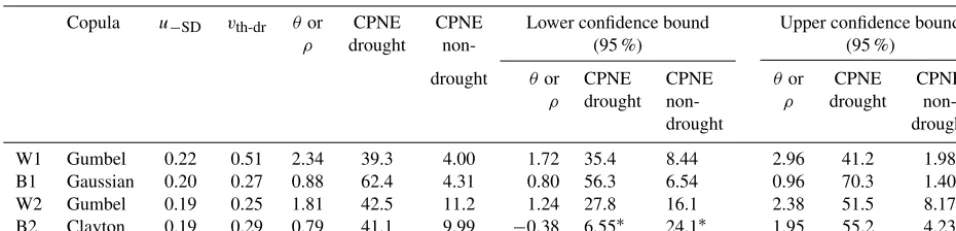
The theoretical CPNE based on Eqs. (5) and (6) (Table 4) agrees quite well with the estimates of the CPNE in Fig. 7, thus corroborating the representativeness of the copula ex-periment using 1000 simulations. Nevertheless, the use of simulations allows us to increase the sample size and to gen-erate more joint extreme values based on the dependence structures characterized by the selected copulas. In addition,
the effect of the copula parameter (ρorθ) inaccuracy due to the finiteness of available sample is considered in Table 4 in terms of the 95 % confidence level interval of CPNE based on the confidence interval of the copula parameters taken from Table 3. Table 4 shows that the theoretical CPNE under drought conditions still remains well above the CPNE un-der non-drought conditions, with their difference taking the smallest value at the lower bound of the copula parameter confidence interval. In most cases, those differences are pos-itive, as expected from the effect of drought on crop yield, despite the relative finiteness of the sample to fit the copula models.
Figure 7.Conditional probability of non-exceedance (CPNE) function (%) based on the derived copula simulations (top row) and respective probability density estimates (bottom row) under drought (orange) and non-drought conditions (blue). In the bottom row, the orange and blue values indicate the probability of crop loss under the different climatic conditions, which is also indicated in the top row by the intersected dashed lines, which indicate the threshold of crop loss and respective CPNE value.
be expected from a Clayton copula (which is known for cap-turing lower tail dependence).
4 Discussion
This study investigated the usefulness of copula methods in estimating the likelihood of drought risk in wheat and bar-ley cropping systems, when applied to two regions in the IP. Here we proposed modelling the joint probability of yield and drought hazard using copulas, based on a prior analysis of the association between drought and crop loss (Ribeiro et al., 2019a). The advantage of using a probabilistic approach is to meet the ambitious challenge of helping farmers and stakeholders in managing their operations by identifying the probability of crop loss under specific drought conditions. Hernández-Barrera and Rodríguez-Puebla (2017) and Fer-rise et al. (2011) have shown that the projected warmer and drier climate will lead to wheat yield shortfall over the IP and Mediterranean, respectively, highlighting the importance of establishing novel statistical approaches for agricultural drought risk analysis. Other crops rather than rainfed cere-als are cere-also expecting significant losses during the next cen-tury in the IP (Saadi et al., 2015; Resco et al., 2010; Quiroga and Iglesias, 2009), and the here-proposed crop-specific ap-proach could be applied to other agricultural systems under drought conditions for different regions around the world.
The novelty of the presented models, in comparison to other works addressing climate risk in the IP (e.g. Ribeiro et al., 2019a; Resco et al., 2010; Iglesias and Quiroga, 2007), is the focus on the impacts associated with droughts and on the joint probability of rainfed yield anomalies and drought hazards. Previous works using copulas in hydro-climatology studies have tended to focus on the joint distribution of
dif-ferent characteristics of the hazardous events, such as fre-quency, intensity, severity, and duration, among others (Li et al., 2015; Chen et al., 2013; Mirabbasi et al., 2012). More-over, the restriction to the bivariate case allowed for a simpler interpretation of the results, in contrast to higher-dimension copulas (Afshar et al., 2016; Ganguli and Reddy, 2013), for instance by adding other factors influencing crop yield be-yond drought as copula variables.
T able 3. Copula dependence parameter estimates ( ρ , df or θ ), with the 95 % confidence interv al (ci) in parenthesis, and AIC v alues. The ci 95 % denoted by “ − ” indicates that the m odel w as unable to compute the ci using the profile lik elihood of the parameter . The selected models according to the lo west v alue of AIC are in bold. Gaussian t copula Clayton Frank Gumbel ρ ci 95 % AIC df ci 95 % AIC θ ci 95% AIC θ ci 95 % AIC θ ci 95 % AIC W1 0.63 0.33; 0.82 − 11 . 79 0.75 0.02; 2.23 − 3 . 73 1.91 1.14, 2.68 − 11 . 07 6.45 3.95, 8.95 − 13 . 42 2.34 1.72 , 2.96 –16.7 B1 0.88 0.80 ; 0.96 –39.1 0.92 – 4 4.09 2.21, 5.96 − 36 . 97 12.5 4.90, 20.1 − 38 . 93 3.11 1.89, 4.33 − 32 . 43 W2 0.54 0.15; 0.74 − 7 . 23 0.54 − 0 . 25; 2.82 − 3 . 55 1.35 0.56, 2.13 − 7 . 95 4.35 1.83, 6.88 − 6 . 69 1.81 1.24 , 2.38 –8.78 B2 0.32 − 0 . 07; 0.62 − 0 . 99 0.42 − 14 . 02; 21.96 3.02 0.79 –0.38 , 1.95 –2.70 2.54 − 0 . 06, 5.14 − 1 . 06 1.42 0.96, 1.88 − 1 . 12
Overall, the results of the estimated copula functions have shown that Archimedean copulas are suitable to model the joint behaviour of yield anomalies and droughts, suggesting a dependence between extreme values of rainfed cereal yield anomalies and drought indicators, and the subsequent simu-lated distributions of crop yield anomalies are quite consis-tent with the observations. The results highlighted that the use of copulas for probabilistic assessment allows the esti-mation of the dependence in the tails of the distribution and was able to give the likelihood of crop loss under drought conditions. This feature is of the most interest in risk anal-ysis given that it models the joint probability of occurrence of crop loss and drier events. Moreover, this study suggests the relevance of impact-centric approaches (also referred to the literature as “bottom-up” approaches; Zscheischler et al., 2018) to identify and characterize the hazards that lead to the larger impacts.
Moreover, it is important to stress that crop anomalies de-cline much more when drought conditions are below the mild or moderate threshold, suggesting a high agricultural drought risk level of wheat and barley in both clusters. While val-ues of PNE in the crop loss threshold were low and similar for wheat in cluster 1 and barley in cluster 2, the values of CPNE in the crop loss threshold during drought years are considerably larger. The higher probability of crop loss ob-tained when analysing only drought conditions agrees with Páscoa et al. (2017b), which show a very high agreement be-tween low wheat yield anomalies and drought conditions in the IP, even on provinces where the linear correlation is not significant.
Although there is a greater risk of crop loss during drought conditions, some losses can still be expected during non-drought events, particularly in cluster 2 (14.1 % and 7.77 % in the cases of wheat and barley, respectively). In the north-ern sector (cluster 1) the probabilities of crop loss under non-drought conditions have the lower values, displaying 3.97 % in the case of wheat and 3.65 % in the case of barley. Some studies point to crop damage attributable to excessively wet soils (Zampieri et al., 2017; Rosenzweig et al., 2002), due to delayed planting or later harvest, nutrient runoff and de-velopment of pests and diseases, among other factors, high-lighting the complexity of quantifying agricultural risk lev-els for management purposes and the non-linear relation be-tween crop yield and climate conditions. The lower values of CPNE under non-drought conditions in cluster 1 support the fact that the slightly high values of PNE in cluster 1 are mainly dominated by drought conditions.
be-Table 4.Theoretical CPNE (%) during drought and non-drought conditions (Eqs. 9 and 10) and respective lower and upper bounds of the 95 % confidence interval, whereu−SDandvth-drare the marginal probabilities of crop loss and drought occurrence andθorρare the estimated copula parameters with 95 % confidence limits (Table 3). The only exception that gives greater values of CPNE during non-drought conditions rather than drought is denoted by “∗”.
Copula u−SD vth-dr θor CPNE CPNE Lower confidence bound Upper confidence bound
ρ drought non- (95 %) (95 %)
drought θor CPNE CPNE θor CPNE CPNE
ρ drought non- ρ drought
non-drought drought
W1 Gumbel 0.22 0.51 2.34 39.3 4.00 1.72 35.4 8.44 2.96 41.2 1.98
B1 Gaussian 0.20 0.27 0.88 62.4 4.31 0.80 56.3 6.54 0.96 70.3 1.40
W2 Gumbel 0.19 0.25 1.81 42.5 11.2 1.24 27.8 16.1 2.38 51.5 8.17
B2 Clayton 0.19 0.29 0.79 41.1 9.99 −0.38 6.55∗ 24.1∗ 1.95 55.2 4.23
tween TCI and wheat yields in Kazakhstan. Madadgar et al. (2017) modelled the conditional probability density func-tions of crop yields under wet and dry condifunc-tions using SPI and SSI and found that a Clayton copula was the best func-tion to model the dependence structures. Similarly, Leng and Hall (2019) have also used the same copula families and found that from 10 countries studied 5 used Clayton copu-las to fit the joint distribution between wheat production and SPI. However, the referred studies were somehow more re-strictive as they do not take advantage of using both remote sensing and hydro-meteorological drought indicators and do not select the most important one a priori.
To further the research, the application of SPEI method-ology to climate projections of precipitation and tempera-ture holds an added value to the estimation of drought risk levels for the next century. Likewise, the use of seasonal drought forecasts is also quite plausible in the approach pre-sented in this study. Nevertheless, the prepre-sented results in-dicated the likelihood of crop loss based on drought condi-tions observed much earlier than the harvest time, particu-larly in cluster 2 using SPEI (February and April with 5 and 1 month timescales). Hence, given the uncertainty associated with the seasonal forecasts for regional drought predictability in the IP, the use of past information for predictability studies is still successfully used (Pires and Ribeiro, 2016) and con-tinues to be a source of information from an operational point of view. Another potential use of this methodology for future research is the evaluation of its suitability at the province level and the assessment of whether other hazards (such as heat waves) are amplifying the impact of droughts on crop harvests.
5 Conclusions
The agricultural drought risk levels estimated in the present work aimed to improve the effectiveness of the agricultural management of rainfed cereals in the major agricultural areas
of the IP. The main findings of this study are summarized below.
– The dependence structure between crop yield anomalies and drought conditions is mainly asymmetrical, sug-gesting the existence of dependence among extreme val-ues of yield anomalies and drought indicators.
– The differences between the unconditional and the con-ditional probability suggest that the risk of wheat loss and barley loss can be underestimated without condi-tioning the probabilities of non-exceedance crop thresh-olds to specific drought levels.
– The conditional probabilities of non-exceedance sug-gest that the risk of wheat loss and barley loss increases when drought events aggravate from normal or wet to moderate or severe conditions.
– The values of conditional probabilities of crop loss un-der dry conditions suggest that the risk of drought-related barley loss is more likely to occur in the northern sector, while the risk of drought-related wheat loss is more likely in the southern sector, suggesting that sow-ing in cluster 1 (cluster 2) could be more focused on wheat (barley).
– The overall results show the importance of the concept of conditional probability for distinguishing different meteorological settings associated with crop losses and the applicability of the copula theory. The use of cop-ula simcop-ulations for the analysis of the co-occurrence of dry and low-yield extreme events has shown the addi-tional value of this methodology for the estimation of drought-related crop failure.
analysis are required, involving the cascading effects of different climate hazards.
Data availability. The Portuguese crop yield database is pub-lished by the Portuguese National Statistics Institute and is avail-able at https://ine.pt/xportal/xmain?xpid=INE&xpgid=ine_base_ dados (last access: 9 November 2019) by selecting “main crops production (t) by geographic localization (Agrarian region) and species; annual (1)” and afterwards by selecting the species of wheat and barley. The Spanish crop yield is published by the Span-ish Agriculture, Food and Environment Ministry in their Statisti-cal Yearbook, which can be consulted at https://www.mapa.gob.es/ es/estadistica/temas/publicaciones/anuario-de-estadistica/ (last ac-cess: 9 November 2019) by selecting the desired year, the chap-ter entitled “surfaces and crop productions”, and the species wheat and barley. The CORINE Land Cover datasets are publicly avail-able at https://land.copernicus.eu/pan-european/corine-land-cover (last access: 9 November 2019). The remote sensing indices (VCI, TCI and VHI) database was accessed for the last time on 21 June 2018 at ftp://ftp.star.nesdis.noaa.gov/pub/corp/scsb/wguo/ data/VHP_4km/geo_TIFF/ and the webpage has recently been updated to ftp://ftp.star.nesdis.noaa.gov/pub/corp/scsb/wguo/data/ Blended_VH_4km/geo_TIFF/. The precipitation- and temperature-gridded values are publicly available from the Climate Re-search Unit (CRU) TS3.21 dataset by Harris et al. (2014) (https://doi.org/10.1002/joc.3711).
Author contributions. AFSR, AR and CMG conceived the idea of the present study. AFSR analysed the data, performed the statistical analysis, produced the figures and drafted the manuscript. AR and CMG supervised the work. CALP verified the analytical methods and designed the estimation of the conditional probabilities’ uncer-tainty. AR performed the computations of SPEI. PP instructed the acquisition and analysis of the crop yield data. CMG instructed the acquisition and analysis of the remote sensing data. All the authors provided helpful insight in the discussion of the results and con-tributed to the design of the research and to the final paper.
Competing interests. The authors declare that they have no conflict of interest.
Special issue statement. This article is part of the special issue “Hydroclimatic extremes and impacts at catchment to regional scales”. It is not associated with a conference.
Acknowledgements. This work was partially supported by national funds through the FCT (Fundação para a Ciência e a Tecnologia, Portugal) under the projects CLMALERT (ERA4CS/0005/2016) and IMPECAF (PTDC/CTA-CLI/28902/2017). Ana Russo and Andreia Ribeiro thank FCT for grants SFRH/BPD/99757/2014 and PD/BD/114481/2016, respectively. The authors are also sin-cerely thankful to Ricardo Trigo (Instituto Dom Luiz) for his valu-able suggestions and support.
Financial support. This research has been supported by the FCT (Fundação para a Ciência e a Tecnologia, Portugal) (grant nos. SFRH/BPD/99757/2014, PD/BD/114481/2016, ERA4CS/0005/2016, WaterJPI/0004/2014 and PTDC/CTA-CLI/28902/2017).
Review statement. This paper was edited by Fernando Domínguez-Castro and reviewed by three anonymous referees.
References
Afshar, M. H., Sorman, A. U., and Yilmaz, M. T.: Conditional copula-based spatial-temporal drought characteristics analysis – A case study over Turkey, Water (Switzerland), 8, 1–16, https://doi.org/10.3390/w8100426, 2016.
Agnew, C. T.: Using the SPI to Identify Drought, Drought Netw. News, 12, 6–12, 2000.
Bezak, N. and Brilly, M.: Applicability of copula functions in anal-ysis of extreme hydrological, in: Proceedings of the Mediter-ranean Meeting on Monitoring, modelling and early warning of extreme events triggered by heavy rainfalls, PON 01_01503 – MED-FRIEND project, University of Calabria, 26–28 June 2014, Cosenza, Italy, 2014.
Bokusheva, R.: Improving the Effectiveness of Weather-based Insurance: An Application of Copula Approach, MPRA Pap. 62339, available at: https://mpra.ub.uni-muenchen.de/ 62339/ (last access: 9 November 2019), 2014.
Bokusheva, R., Kogan, F., Vitkovskaya, I., Conradt, S., and Batyrbayeva, M.: Satellite-based vegetation health in-dices as a criteria for insuring against drought-related yield losses, Agr. Forest Meteorol., 220, 200–206, https://doi.org/10.1016/j.agrformet.2015.12.066, 2016.
Capa-Morocho, M., Ines, A. V. M., Baethgen, W. E., Rodriguez-Fonseca, B., Han, E. and Ruiz-Ramos, M.: Crop yield out-looks in the Iberian Peninsula: Connecting seasonal climate fore-casts with crop simulation models, Agric. Syst., 149, 75–87, https://doi.org/10.1016/j.agsy.2016.08.008, 2016.
Chen, L., Singh, V. P., Chen, L., Singh, V. P., Asce, F., Guo, S., Mishra, A. K., and Guo, J.: Drought Anal-ysis using copulas, J. Hydrol. Eng., 18, 797–808, https://doi.org/10.1061/(ASCE)HE.1943-5584.0000697, 2013. CLC 2012: Copernicus Programme Land Monitoring
Ser-vice, available at: https://land.copernicus.eu/pan-european/ corine-land-cover/clc-2012 (last access: 9 November 2019), 2012.
Corder, G. W. and Foreman, D. I.: Nonparametric Statistics: An Introduction, in: Nonparametric Statistics for Non-Statisticians: A Step-by-Step Approach, John Wiley & Sons, Inc., 1–11, https://doi.org/10.1002/9781118165881, 2011.
Fahr, A.: Nonparametric Analysis, Int.
En-cycl. Commun. Res. Meth., 3, 1297–1303,
https://doi.org/10.1002/9781118901731.iecrm0168, 2017. Ferrise, R., Moriondo, M., and Bindi, M.: Probabilistic
assess-ments of climate change impacts on durum wheat in the Mediter-ranean region, Nat. Hazards Earth Syst. Sci., 11, 1293–1302, https://doi.org/10.5194/nhess-11-1293-2011, 2011.
Ganguli, P. and Reddy, M. J.: Risk Assessment of Droughts in Gu-jarat Using Bivariate Copulas, Water Resour. Manage., 26, 3301– 3327, https://doi.org/10.1007/s11269-012-0073-6, 2012. Ganguli, P. and Reddy, M. J.: Probabilistic assessment of flood risks
using trivariate copulas, Theor. Appl. Climatol., 111, 341–360, https://doi.org/10.1007/s00704-012-0664-4, 2013.
Giménez, L., Petillo, M. G., Paredes, P., and Pereira, L. S.: Predict-ing Maize Transpiration , Water Use and Productivity for De-veloping Improved Supplemental Irrigation Schedules in West-ern Uruguay to Cope with Climate Variability, Water, 8, 1–22, https://doi.org/10.3390/w8070309, 2016.
Gouveia, C. and Trigo, R. M.: Influence of climate variability on European agriculture-analysis of winter wheat production, in: geoENV VI – Geostatistics Environ. Appl., Springer Nether-lands, 27, 335–345, https://doi.org/10.3354/cr027135, 2008. Harris, I., Jones, P. D., Osborn, T. J. and Lister, D. H.:
Up-dated high-resolution grids of monthly climatic observations – the CRU TS3.10 Dataset, Int. J. Climatol., 34, 623–642, https://doi.org/10.1002/joc.3711, 2014.
Hernández-Barrera, S. and Rodríguez-Puebla, C.: Wheat yield in Spain and associated solar radiation patterns, Int. J. Climatol., 37, 45–58, https://doi.org/10.1002/joc.4975, 2017.
Hernandez-Barrera, S., Rodriguez-Puebla, C., and Challinor, A. J.: Effects of diurnal temperature range and drought on wheat yield in Spain, Theor. Appl. Climatol., 129, 503–519, https://doi.org/10.1007/s00704-016-1779-9, 2017.
Hlavinka, P., Trnka, M., Eitzinger, J., Smutný, V., Thaler, S., Žalud, Z., Rischbeck, P., and Kˇren, J.: The performance of CERES-Barley and CERES-Wheat under various soil conditions and tillage practices in Central Europe, Bodenkultur, 61, 5–17, 2010. Iglesias, A. and Quiroga, S.: Measuring the risk of climate vari-ability to cereal production at five sites in Spain, Clim. Res., 34, 47–57, https://doi.org/10.3354/cr034047, 2007.
IPCC: Managing the risks of extreme events and disasters to advance climate change adaptation, Cambridge University Press, available at: https://www.ipcc.ch/site/assets/uploads/2018/ 03/SREX_Full_Report-1.pdf (last access: 9 November 2019), 2012.
Jayanthi, H., Husak, G. J., Funk, C., Magadzire, T., Adoum, A., and Verdin, J. P.: A probabilistic approach to as-sess agricultural drought risk to maize in Southern Africa and millet in Western Sahel using satellite esti-mated rainfall, Int. J. Disast. Risk Reduct., 10, 490–502, https://doi.org/10.1016/j.ijdrr.2014.04.002, 2014.
Kogan, F., Guo, W., Strashnaia, A., Kleshenko, A., Chub, O., and Virchenko, O.: Modelling and prediction of crop losses from NOAA polar-orbiting operational satellites, Geomatics, Nat. Hazards Risk, 7, 886–900, https://doi.org/10.1080/19475705.2015.1009178, 2015. Kogan, F. N.: Remote sensing of weather impacts on vegetation in
non-homogeneous areas, Int. J. Remote Sens., 11, 1405–1419, https://doi.org/10.1080/01431169008955102, 1990.
Kogan, F. N.: Application of vegetation index and brightness tem-perature for drought detection, Adv. Space Res., 15, 91–100, https://doi.org/10.1016/0273-1177(95)00079-T, 1995.
Kogan, F. N.: Operational space technology for global vegetation assessment, B. Am. Meteorol. Soc., 82, 1949–1964, 2001. Leng, G. and Hall, J.: Crop yield sensitivity of global
ma-jor agricultural countries to droughts and the projected changes in the future, Sci. Total Environ., 654, 811–821, https://doi.org/10.1016/j.scitotenv.2018.10.434, 2019.
Lesk, C., Rowhani, P., and Ramankutty, N.: Influence of extreme weather disasters on global crop production, Nature, 529, 84–87, 2016.
Li, Y., Gu, W., Cui, W., Chang, Z., and Xu, Y.: Exploration of copula function use in crop meteorological drought risk analysis: a case study of winter wheat in Beijing, China, Nat. Hazards, 77, 1289– 1303, https://doi.org/10.1007/s11069-015-1649-2, 2015. Madadgar, S., AghaKouchak, A., Farahmand, A., and Davis,
S. J.: Probabilistic estimates of drought impacts on agri-cultural production, Geophys. Res. Lett., 44, 7799–7807, https://doi.org/10.1002/2017GL073606, 2017.
Maity, R.: Statistical Methods in Hydrology and Hydroclimatology, Springer, https://doi.org/10.1007/978-981-10-8779-0, 2018. Martin-Vide, J. and Lopez-Bustins, J.: The Western Mediterranean
Oscillation and rainfall in the Iberian Peninsula, Int. J. Climatol., 26, 1455–1475, 2006.
Matsumura, K., Gaitan, C. F., Sugimoto, K., Cannon, A. J., and Hsieh, W. W.: Maize yield forecasting by linear regression and artificial neural networks in Jilin, China, J. Agric. Sci., 153, 399– 410, https://doi.org/10.1017/S0021859614000392, 2015. Mirabbasi, R., Fakheri-Fard, A., and Dinpashoh, Y.: Bivariate
drought frequency analysis using the copula method, Theor. Appl. Climatol., 108, 191–206, https://doi.org/10.1007/s00704-011-0524-7, 2012.
Naumann, G., Spinoni, J., Vogt, J., and Barbosa, P.: Assess-ment of drought impacts and their uncertainties in Europe, Environ. Res. Lett., 10, 124013, https://doi.org/10.1088/1748-9326/10/12/124013, 2015.
Nelsen, R. B.: An introduction to copulas, Springer Series in Statis-tics, 1–269, 2006.
Paredes, P., Rodrigues, G. C., Alves, I., and Pereira, L. S.: Partitioning evapotranspiration, yield prediction and eco-nomic returns of maize under various irrigation man-agement strategies, Agric. Water Manage., 135, 27–39, https://doi.org/10.1016/j.agwat.2013.12.010, 2014.
Paredes, P., Rodrigues, G. C., Cameira, M. do R., Torres, M. O., and Pereira, L. S.: Assessing yield, water productivity and farm eco-nomic returns of malt barley as influenced by the sowing dates and supplemental irrigation, Agric. Water Manage., 179, 132– 143, https://doi.org/10.1016/j.agwat.2016.05.033, 2016. Páscoa, P., Gouveia, C. M., Russo, A., and Trigo, R. M.: Drought
trends in the Iberian Peninsula over the last 112 years, Adv. Me-teorol., 2017 4653126, https://doi.org/10.1155/2017/4653126, 2017a.
Páscoa, P., Gouveia, C. M., Russo, A., and Trigo, R. M.: The role of drought on wheat yield interannual variability in the Iberian Peninsula from 1929 to 2012, Int. J. Biometeorol., 61, 439–451, https://doi.org/10.1007/s00484-016-1224-x, 2017b.
two rainfed crops in Spain, Nat. Hazards Earth Syst. Sci., 19, 1215–1234, https://doi.org/10.5194/nhess-19-1215-2019, 2019. Pires, C. A. L. and Ribeiro, A. F. S.: Separation of the atmospheric
variability into non-Gaussian multidimensional sources by pro-jection pursuit techniques, Springer, Berlin, Heidelberg, 2016. Quiroga, S. and Iglesias, A.: A comparison of the climate risks of
cereal, citrus, grapevine and olive production in Spain, Agric. Syst., 101, 91–100, https://doi.org/10.1016/j.agsy.2009.03.006, 2009.
Quiroga, S., Fernández-Haddad, Z., and Iglesias, A.: Crop yields response to water pressures in the Ebro basin in Spain: Risk and water policy implications, Hydrol. Earth Syst. Sci., 15, 505–518, https://doi.org/10.5194/hess-15-505-2011, 2011.
Reidsma, P., Ewert, F., Lansink, A. O., and Leemans, R.: Adapta-tion to climate change and climate variability in European agri-culture: The importance of farm level responses, Eur. J. Agron., 32, 91–102, https://doi.org/10.1016/j.eja.2009.06.003, 2010. Resco, P., Quiroga, S., Iglesias, A., and Sotés, V.: Risk of Climate
Change for Grapevine Production in Mediterranean Areas, Le Bull. l’OIV, 83, 1–8, 2010.
Ribeiro, A. F. S., Russo, A., Gouveia, C. M., and Páscoa, P.: Mod-elling drought-related yield losses in Iberia using remote sensing and multiscalar indices, Theor. Appl. Climatol., 136, 203–220, https://doi.org/10.1007/s00704-018-2478-5, 2019a.
Ribeiro, A. F. S., Russo, A., Gouveia, C. M., and Pás-coa, P.: Copula-based agricultural drought risk of rain-fed cropping systems, Agric. Water Manage., 223, 105689, https://doi.org/10.1016/j.agwat.2019.105689, 2019b.
Rojas, O., Vrieling, A., and Rembold, F.: Assessing drought proba-bility for agricultural areas in Africa with coarse resolution re-mote sensing imagery, Rere-mote Sens. Environ., 115, 343–352, https://doi.org/10.1016/j.rse.2010.09.006, 2011.
Rosenzweig, C., Tubiello, F. N., Goldberg, R., Mills, E., and Bloomfield, J.: Increased crop damage in the US from excess precipitation under climate change, Global Environ. Change, 12, 197–202, https://doi.org/10.1016/S0959-3780(02)00008-0, 2002.
Saadi, S., Todorovic, M., Tanasijevic, L., Pereira, L. S., Pizzigalli, C., and Lionello, P.: Climate change and Mediterranean agricul-ture: Impacts on winter wheat and tomato crop evapotranspira-tion, irrigation requirements and yield, Agric. Water Manage., 147, 103–115, https://doi.org/10.1016/j.agwat.2014.05.008, 2015.
Saghafian, B. and Mehdikhani, H.: Drought characterization using a new copula-based trivariate approach, Nat. Hazards, 72, 1391– 1407, https://doi.org/10.1007/s11069-013-0921-6, 2014. Serinaldi, F., Bonaccorso, B., Cancelliere, A., and Grimaldi,
S.: Probabilistic characterization of drought proper-ties through copulas, Phys. Chem. Earth, 34, 596–605, https://doi.org/10.1016/j.pce.2008.09.004, 2009.
Sklar, A.: Fonctions de Répartition à n Dimensions et Leurs Marges, Inst. Stat. l’Université Paris, 8, 229–231, 1959.
Sousa, P. M., Trigo, R. M., Aizpurua, P., Nieto, R., Gimeno, L., and Garcia-Herrera, R.: Trends and extremes of drought indices throughout the 20th century in the Mediterranean, Nat. Hazards Earth Syst. Sci., 11, 33–51, https://doi.org/10.5194/nhess-11-33-2011, 2011.
Vergni, L., Todisco, F., and Mannocchi, F.: Analysis of agricultural drought characteristics through a two-dimensional copula, Water Resour. Manage., 29, 2819–2835, https://doi.org/10.1007/s11269-015-0972-4, 2015.
Vicente-Serrano, S. M., Cuadrat-Prats, J. M., and Romo, A.: Early prediction of crop production using drought indices at differ-ent timescales and remote sensing data: application in the Ebro Valley (north-east Spain), Int. J. Remote Sens., 27, 511–518, https://doi.org/10.1080/01431160500296032, 2006.
Vicente-Serrano, S. M., Begueria, S., and Lopez-Moreno, J. I.: A multiscalar drought index sensitive to global warming: The stan-dardized precipitation evapotranspiration index, J. Climate, 23, 1696–1718, https://doi.org/10.1175/2009JCLI2909.1, 2010. Vicente-Serrano, S. M., Lopez-Moreno, J.-I., Beguería, S.,
Lorenzo-Lacruz, J., Sanchez-Lorenzo, A., García-Ruiz, J. M., Azorin-Molina, C., Morán-Tejeda, E., Revuelto, J., Trigo, R., Coelho, F., and Espejo, F.: Evidence of increasing drought sever-ity caused by temperature rise in southern Europe, Environ. Res. Lett., 9, 044001, https://doi.org/10.1088/1748-9326/9/4/044001, 2014.
Wilks, D. S.: Statistical Methods in the Atmospheric Sciences, 2nd Edn., Academic Press, Oxford, UK, 2006.
Zampieri, M., Ceglar, A., Dentener, F., and Toreti, A.: Wheat yield loss attributable to heat waves, drought and water excess at the global, national and subnational scales, Environ. Res. Lett., 12, 064008, https://doi.org/10.1088/1748-9326/aa723b, 2017. Zarei, R., Sarajian, M., and Bazgeer, S.: Monitoring
Meteorologi-cal Drought in Iran Using Remote Sensing and Drought Indices, Desert, 18, 89–97, 2013.
Zhang, Q., Chen, Y. D., Chen, X., and Li, J.: Copula-Based Analysis of Hydrological Extremes and Implications of Hydrological Be-haviors in the Pearl River Basin, China, J. Hydrol. Eng., 16, 598– 607, https://doi.org/10.1061/(asce)he.1943-5584.0000350, 2011. Zscheischler, J., Orth, R., and Seneviratne, S. I.: Bivariate return periods of temperature and precipitation explain a large frac-tion of European crop yields, Biogeosciences, 14, 3309–3320, https://doi.org/10.5194/bg-14-3309-2017, 2017.

![Figure 3. Empirical cumulative distribution functions (ECDF, blue points), kernel density estimation of the CDF (red line), crop loss anddrought thresholds (dotted black vertical line), respective marginal probabilities of crop loss and drought occurrence (dotted black horizontalline), and pseudo-observations (scatter) of the margins on the interval [0, 1].](https://thumb-us.123doks.com/thumbv2/123dok_us/8313989.1379303/7.612.126.468.69.326/cumulative-distribution-anddrought-respective-probabilities-occurrence-horizontalline-observations.webp)
![Figure 4. Selected joint probability distribution functions (PDFs) where u and v are scalar values on the interval [0, 1] (top row), contoursshowing the two-dimensional view of PDFs (middle row) and observed (red triangles), and copula-based simulation (density squares) scatterplots of crop yields and drought indicators (bottom row).](https://thumb-us.123doks.com/thumbv2/123dok_us/8313989.1379303/8.612.128.468.66.326/selected-probability-distribution-contoursshowing-dimensional-simulation-scatterplots-indicators.webp)