FULL PAPER
Geophysical imaging of subsurface
structures in volcanic area by seismic
attenuation profiling
Tetsuro Tsuru
1*, Tetsuo No
2and Gou Fujie
2Abstract
Geophysical imaging by using attenuation property of multichannel seismic reflection data was tested to map spatial variation of physical properties of rocks in a volcanic area. The study area is located around Miyakejima volcanic island, where an intensive earthquake swarm was observed associated with 2000 Miyakejima eruption. Seismic reflection survey was conducted five months after the swarm initiation in order to clarify crustal structure around the hypocent-ers of the swarm activity. However, the resulting seismic reflection profiles were unable to provide significant informa-tion of deep structures around the hypocenters. The authors newly applied a seismic attribute method that focused seismic attenuation instead of reflectivity to the volcanic area, and designed this paper to assess the applicability of this method to subsurface structural studies in poorly reflective volcanic areas. Resulting seismic attenuation profiles successfully figured out attenuation structures around the Miyakejima volcanic island. Interestingly, a remarkable high-attenuation zone was detected between Miyakejima and Kozushima islands, being well correlated with the hypocenter distribution of the earthquake swarm in 2000. The high-attenuation zone is interpreted as a fractured area that was developed by magma activity responsible for the earthquake swarms that have been repeatedly occurring there. The present study can be one example showing the applicability of seismic attenuation profiling in a volcanic area. Keywords: Seismic attenuation, Poorly reflective, Volcanic, Earthquake swarm, Miyakejima
© The Author(s) 2017. This article is distributed under the terms of the Creative Commons Attribution 4.0 International License (http://creativecommons.org/licenses/by/4.0/), which permits unrestricted use, distribution, and reproduction in any medium, provided you give appropriate credit to the original author(s) and the source, provide a link to the Creative Commons license, and indicate if changes were made.
Background
As a high-resolution geophysical imaging technique to figure out subsurface structures, seismic reflection sur-vey has been widely used in the areas of oil and gas explo-rations and crustal studies. Seismic reflection profiles are the most general product, enabling us to visually recog-nize formation boundaries as continuous reflections. Moreover, the seismic reflection amplitude provides the physical properties of rocks such as acoustic impedance as well as type of pore fluid in subsurface.
However, it is difficult to deduce the subsurface struc-tures from reflection profiles collected in less reflective areas: volcanic area and highly faulted area where con-tinuous reflections are inherently difficult to be observed.
Therefore, several techniques, but not many, have been tested: seismic attribute analysis (e.g., Tokuyama et al.
1988), seismic scattering analysis (Mikada et al. 1997). These methods focused on some attributes other than reflection amplitude and successfully detected subsurface information. From the same point of view, we applied a seismic attribute using attenuation property, “seismic attenuation profiling (SAP)” (Tsuru and No 2011; Tsuru et al. 2014), in a volcanic area between Miyakejima, Kozushima and Niijima island volcanos in Japan.
The objective of the present study is to image a highly fractured zone that was possibly caused by earthquake swarm activity associated with Miyakejima eruption in 2000. Although seismic attenuation is well investigated in studies using VSP data (e.g., Hauge 1981; Worthing-ton and Hudson 2000), well log data (e.g., Matsushima
2006) and core samples (e.g., Tompkins and Christensen
2001; Tsuji and Iturrino 2008), it is rarely applied to sur-face seismic reflection data except previous studies on
Open Access
*Correspondence: [email protected]
a direct hydrocarbon indication (Dasgupta and Clark
1998), a fault seal ability evaluation (Tsuru et al. 2014) and Q tomography/migration for oil and gas industry (e.g., Zhou et al. 2011).
Methods
The SAP method is a technique to image seismic attenua-tion structure from seismic reflecattenua-tion data (Tsuru and No
2011; Tsuru et al. 2014). The method has an advantage in application to geophysical imaging or rock property estimation of less reflective areas such as volcanic area and highly faulted area, because it does not require con-tinuous reflections. On the other hand, the present SAP method using spectral ratio has a disadvantage in reso-lution because it requires an averaging process to miti-gate the influences from abnormal values caused by local noises: About 100 samples and 15 traces are used in ver-tical direction and horizontal direction, respectively, in the present study.
In the present study, the assumption that Q is constant over the seismic frequency band was adopted as many previous authors did (e.g., Knopoff 1964), although some other studies found indications for frequency-dependent
Q (e.g., Mavko and Nur 1979). From the viewpoint of investigating attenuation effect from seismic field data, one should remove other effects in advance: geometri-cal spreading, scattering, noises and so on. However, it is actually impossible to remove them completely. Moreo-ver, Q values computed in the present study is the so-called effective Q (Qeff), which is the sum of the inelastic absorption Qi and the apparent attenuation Qa (Spencer et al. 1982) given by
Namely, the SAP method is not capable of separating Qi and Qa. Although a direct correlation between Qeff and a special rock type is difficult, Qeff gives information about changes in lithology and fluid property, being a valuable aid in geological interpretation (Tonn 1991; Dasgupta and Clark 1998; Zhou et al. 2011).
First we calculated average Q value by the spectral ratio method, which is known as one of the most gen-eral methods to estimate Q (e.g., Hauge 1981; Tonn 1991; Dasgupta and Clark 1998). Temporal decay in amplitude of a propagating seismic wave of frequency f from travel-time t1 to traveltime t2 can be written by a function of Q:
where δt = t2 − t1. At1 and At2 are amplitude spectrum of wavelet at t1 and that at t2, respectively. By adding geometrical spreading effect G and reflection coefficient
(1)
Taking the logarithm of both sides:
where
Since the logarithm of spectral ratio of a wavelet at t2 and that at t1 is a linear function of frequency f as expressed in Eq. (5), an effective Q can be computed from its gradi-ent “p” by Eq. (6).
In general, the spectral ratio method uses two each of amplitude spectrums that are calculated in two each of time windows consecutively set on seismic records. How-ever, this method is very sensitive to noise (Tonn 1991). Previous authors therefore coped with this issue by some ways. For example, Dasgupta and Clark (1998) used only limited area of seismic reflection data around the area of interest in Q calculation. Tsuru et al. (2014) used a stacked seismic record and adopted amplitude spectrums of seafloor reflections as the denominator of the left side of Eq. (5). In the present study, amplitude spectrums of the uppermost part of the area of interest were used as the denominator (Appendix Fig. 12). On the other hand, the numerator spectrums were calculated in time win-dows set from top to bottom of seismic reflection profile.
As another step to cope with noise, we selected a fre-quency band for the gradient “p” computation by the fol-lowing criterion.
(1) Effective frequency band of input data
Prior to SAP calculation, a band-pass filter of 5–50 Hz was applied in the data processing. Therefore, the fre-quency band width for “p” computation must be set within the pass band of 5–50 Hz.
(2) Ghost notch
Ghost notch is one of the obstacles that should be taken care in computing “p” because of lower signal level at notch frequency. In the present study, the input seismic data were collected with a streamer cable of 20 m towing
depth and an air-gun array of 10 m towing depth. Conse-quently, the ghost notches were caused at the frequencies of 0, 37.5, 75 Hz and so on. Therefore, 5–37.5 Hz and/or 37.5–50 Hz are candidates for the frequency band width for the “p” computation.
(3) Dominant frequency range of reflections
Dominant frequency range of the input seismic reflec-tion data is 20–30 Hz. Therefore, the frequency band of 5–37.5 Hz is more appropriate than 37.5–50 Hz.
(4) Frequency dependency of attenuation
Seismic wave attenuates more largely in proportion to the increase of frequency. In other words, attenuation can be easily detected with higher frequency. Therefore, we finally selected 21–37.5 Hz, which is higher half of the 5–37.5 Hz, as the “p” computation band. Thus, we assumed that Q was constant within such a narrow fre-quency band.
Within the frequency band of 21–37.5 Hz, average Q
values were computed along a stacked seismic trace at every CDP. Spectrum of the denominator of the left side of Eq. (5) was computed within a time window of the traveltime between 2.5 and 3.0 s at every CDP, which approximately corresponds to the uppermost part of the volcanic rocks in the study area. Spectrum of the numer-ator was computed within each time window, which was set on the seismic trace one by one from top to bottom. Then a seismic attenuation profile (SAP) was created.
Furthermore, interval Q can be calculated from average
Q by the following equation (e.g., Tonn 1991):
where Qint,k is interval Q of kth time window and tk−1,k is
two-way traveltime between kth and k − 1th time win-dows. Qave,I,k is average Q between the uppermost part of
the area of interest and kth time window, and tI,k is
two-way traveltime between them. Subsequently, a seismic attenuation profile of interval Q was produced.
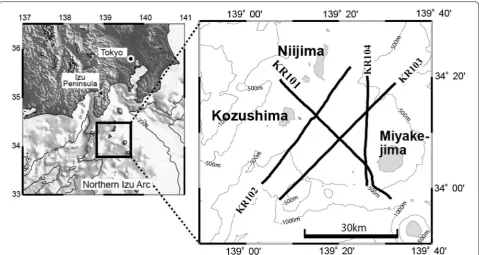
Study area and data specifications
The study area is located around Miyakejima and Kozush-ima volcanic islands about 170 km south of Tokyo, Japan (Fig. 1). The volcanic islands belong to the Izu islands, where volcanic activities accompanied by earthquake swarms have been repeatedly occurring (Mogi 1963;
(7)
Tsukui and Suzuki 1998; Hamada 2001). Regarding hypo-center depths of the earthquake swarms before 2000, Hamada et al. (1985) reported that the hypocenters of the 1962 swarm between Miyakejima and Kozushima were distributed around 20 km in depth. However, they also noted a possibility of 10 km. Due to limited observa-tion networks, firm hypocenter depths were not clarified between the two islands until 2000.
On June 26, 2000, small volcanic earthquakes began to be recorded at observation stations west of the sum-mit of the Miyakejima volcano, and subsequently an earthquake swarm initiated (Sakai et al. 2001). The swam migrated northwestward toward the direction of Kozush-ima and NiijKozush-ima and then developed the most intense earthquake swarm ever observed in and around Japa-nese archipelago (Japan Meteorological Agency 2000; Uhira et al. 2005). The main eruption of the Miyakejima volcano occurred at the summit on July 8, 2000 (e.g., Sakai et al. 2001). A number of earthquakes occurred during a period of these two months (Nishizawa et al.
2002). The hypocenter depths of the 2000 swarm activity between Miyakejima and Kozushima were clearly shown by several studies: 2–13 km determined by Ocean Bot-tom Seismometers (OBS) for the time period between 08/07/2000 and 02/08/2000 (Sakai et al. 2001), 5–20 km by OBS for 11/07/2000 and 31/07/2000 (Nishizawa et al.
2002), 3–20 km by OBS for 21/01/2001 and 13/02/2001 (Nishizawa et al. 2002) and 5–22 km by land networks for 26/06/2001 and 15/07/2001 (Uhira et al. 2005).
Wide-angle seismic refraction surveys, which were conducted four months after the swarm initiation, dis-covered relatively low P-wave velocity zones in the upper crust between Kozushima and Miyakejima (Kodaira et al.
2002; Nishizawa et al. 2002) and an intra-crustal reflec-tion phase immediately below the swarm (Kodaira et al.
2002).
estimate attenuation property by spectral ratio method because frequency distortions caused by NMO correc-tions become large as offset length increases.
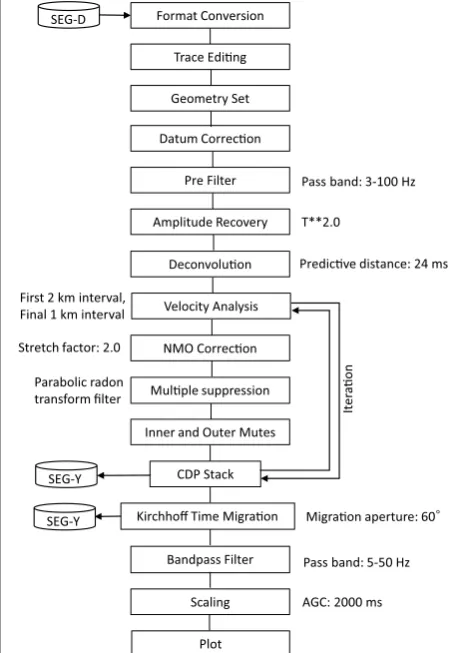
The streamer cable was towed 20 m below the sea sur-face to avoid the effect of sea-wave noise by seasonal wind that was blowing during the whole survey period. Figure 2 shows a post-stack time migrated profile of the line KR101, which was produced by careful trace edit-ing, deconvolution, NMO correction, multiple suppres-sion, CDP stacking, post-stack time migration and so on (Appendix Fig. 11). As a result, stratified continu-ous reflections can be observed in the shallowest part of the line. Almost energy of multiples appears to be sup-pressed. These processing results indicate that the pro-cessing was successful. However, almost all parts of the reflection profile below the shallowest stratified reflectors are less reflective, except a chain of intermittently contin-uous reflectors with strong amplitude in about 2.5–3.0 s of two-way traveltime at shot point (SP) 1300–1500 on the line KR101.
Results of SAP application
As input data of SAP calculation, post-stack migrated records were used in the present study. Post-stack data have an advantage from the viewpoint of S/N ratio because random noise and remaining multiples are strongly suppressed by stacking effect, and reversely it has a disadvantage in preservation of original frequency contents because NMO correction distorts frequency of reflection even if the NMO velocity is correct. On the other hand, pre-stack data have a disadvantage in S/N
ratio, and reversely it has an advantage in frequency pres-ervation. S/N ratio of the seismic reflection data from
KR00-08 Cruise is not so high due to the seasonal wind
as mentioned in “Study area and data specifications” sec-tion, and therefore, the post-stack data were selected as the input data for SAP computation in the present study. Also, frequency distortion caused by NMO correction is not so large in the depths below 10 km (Appendix 2).
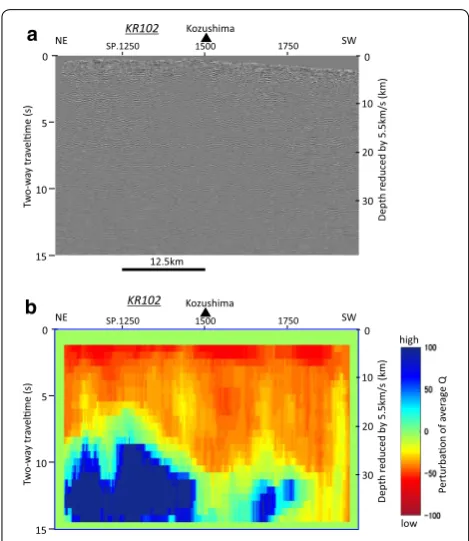
SAP profiles were computed for all the seismic lines. As shown in Figs. 3, 4, 5 and 6, a common attenuation feature
can be seen in all of the SAP profiles: The shallower parts show relatively high attenuation, while the deeper parts relatively low attenuation. However, this common feature does not fit with attenuation feature in the depths below approximately 35 km, which may be a limitation of SAP application to the present dataset. Among them, the SAP profile of average Q on the line KR101 indicates the most remarkable feature: a down-warping high-attenuation zone shown by red-to-yellow colors (Fig. 3a). Comparing Figs. 2 and 3a, it is clearly understood that a remarkable spatial variation in attenuation property showed up on the poorly reflective area below the shallowest stratified layers. Figure 3b shows SAP profile of interval Q, which came out of the average Q values of Fig. 3a. Abnormally large interval Q values can be recognized locally along the lower boundary of the down-warping high-attenuation zone detected on the average Q SAP profile. Drastic change in the average Q near the lower boundary of the high-attenuation zone caused the abnormally large inter-val Q values. This result indicates difficulty in the conver-sion from average Q to interval Q by SAP for the seismic reflection data used in the present study, and we therefore use average Q SAP profiles in the following discussions. 0
Base of strafied layer
Fig. 2 Post-stack time migrated section of KR101. Stratified continu-ous layers can be seen in the shallowest part of the line. Beneath the stratified layers, only a chain of intermittently continuous reflectors with strong amplitude is recognized in about 2.5–3.0 s of two-way
traveltime at shot point (SP) 1300–1500, which are marked by dotted
circles
Base of strafied layer
Fig. 3 Seismic attenuation profiling (SAP) of KR101. Perturbations
of average Q (a) and interval Q (b) are shown by color scale: red (low
Q) to blue (high Q). Vertical scales are represented in time at the left
side and in depth at the right side. The depth axis was converted from
time axis by a reduction velocity of 5.5 km/s referring the previous
OBS refraction study in the study area (Kodaira et al. 2002). A
down-warping low-Q feature is clearly demonstrated in the average Q SAP.
The color scale shows percentage deviation from the mean (42) in the whole profile NE SP.1250 1500 1750
0 NE SP.1250 1500 1750
Kozushima
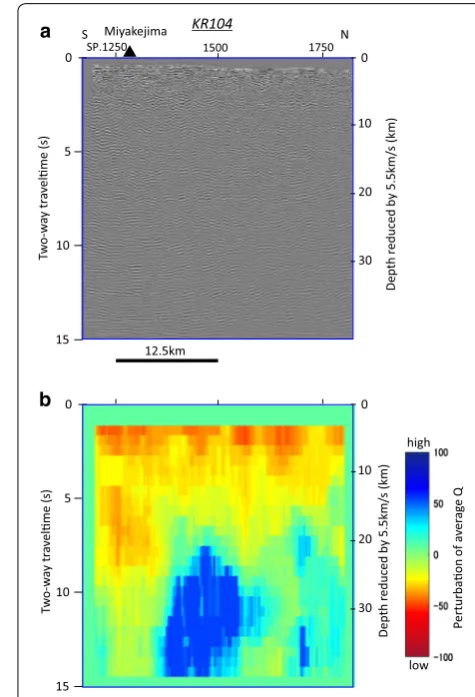
Figures 4, 5 and 6 show both the reflection profiles and average Q SAP profiles of KR102-KR104, and every SAP profile does not show such a remarkable variation in attenuation as that of KR101 has demonstrated. How-ever, although it is a little vague, down-warping high-attenuation features seem to be imaged on both KR102 and KR103. Regarding KR104 and KR101, relatively high-attenuation areas can be seen in the southern half of the line and in the southeast end of the line, respectively, which are segments that pass near the volcanic edifice of the Miyakejima.
Discussion
Here we discuss whether or not SAP method is applica-ble to tectonic study in volcanic area and whether or not the down-warping high-attenuation feature reflects any subsurface structures. In the present study, we assumed that spatial variation in reflectivity is so small over the poorly reflective area that the spatial variation in reflec-tivity does not affect that in attenuation. In a drastic way
of expression, the reflectivity can be assumed almost uni-form within the poorly reflective area, for wavelength used in the seismic reflection survey. It is therefore con-sidered that the observed down-warping high-atten-uation feature has no relationship with variation in reflectivity.
As shown in Figs. 3, 4, 5 and 6, every SAP profile shows a trend that the uppermost part has the highest attenuation. Although the top of each SAP profile was placed by zeros due to the unsuitable condition of spec-tral ratio computation in water layer, the areas of the highest attenuation can be correlated with the lower half of the stratified layers on the reflection profiles. 0
SW SP.1250 1500 1750
Depth
SW SP.1250 1500 1750
Depth
deviation from the mean (41)
0
The areas can be interpreted as volcaniclastic layers from the sedimentological point of view around the study area. Moreover, every SAP profile has a common attenuation feature that the shallower parts show rela-tively high attenuation while the deeper parts relarela-tively low attenuation, which is consistent to a general atten-uation structure in the crust. The above-mentioned characteristics commonly observed on every SAP pro-file can be considered to be one of the evidences that this method is applicable to tectonic study in poorly reflective area, in addition to previous studies in the oil industry (e.g., Tsuru et al. 2014; Zhou et al. 2011), if the down-warping high-attenuation feature were reason-ably explained.
Regarding the down-warping feature of high-attenu-ation zone along the line KR101, the following two tec-tonic factors would be considered as candidates of the possible causes:
1. sedimentary rocks such as volcaniclastic rocks that deposited between two volcanos: Miyakejima and Kozushima,
2. relatively porous and/or fractured zones within vol-canic basement.
As for the former, no reflections can be seen on the rel-evant part of the reflection profile (Fig. 2). Moreover, no volcaniclastic layers that reach 20 km in thickness have been observed on any seismic lines in the study area. Therefore, we eliminate the former from discussion and examine possibility of the latter below.
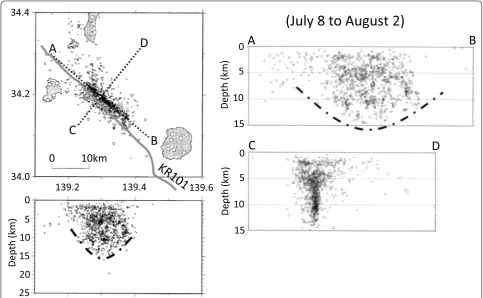
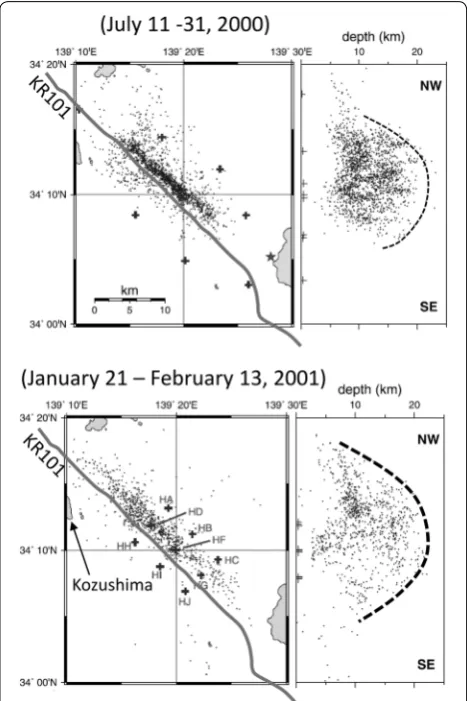
As mentioned above, the largest earthquake swarm ever recorded in Japan occurred between Miyakejima and Kozushima during the two months from June 26, 2000. The swam initiated beneath the southwest flank of Miyakejima and then migrated northwestward toward the direction of Kozushima. Sakai et al. (2001) reported the hypocenter distribution determined by both land stations and Ocean Bottom Seismometers (OBS) dur-ing the period of time from July 8 to August 2, 2000 (Fig. 7). Nishizawa et al. (2002) showed the hypocenters determined by OBS from July 11 to 31 in 2000 and from January 21 to February 13 in 2001 (Fig. 8). Uhira et al. (2005) reported the hypocenters relocated by a station
A
Fig. 7 Hypocenter distributions by Sakai et al. (2001). The hypocenters determined by both land stations and OBS during the time range from July
8 to August 2 in 2000 are shown in the left side. The right figures indicate the hypocenters projected to the cross sections of A–B and C–D. A thick
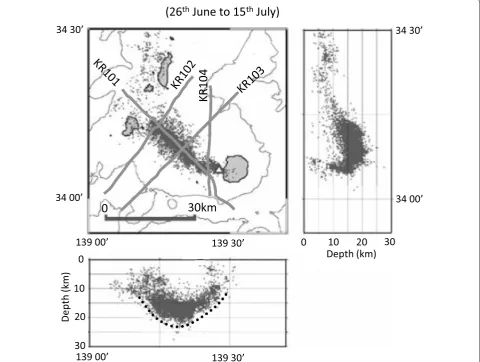
correction method and a double-difference method for earthquakes determined by land stations from June 26 to July 15 in 2000 (Fig. 9). Strike-slip focal mechanism with NW–SE compression axis is predominant for the swarm earthquakes (Sakai et al. 2001; Uhira et al. 2005).
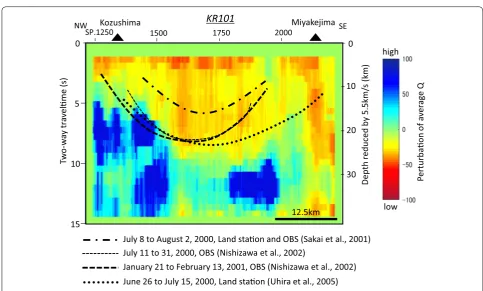
Here we compared the hypocenter distributions with the down-warping high-attenuation zone on SAP profile of KR101 in Fig. 10. The lower boundaries of the above-mentioned four kinds of hypocenter distributions are indicated as a thick chain line, a thin dashed line, a thick dashed line and a dotted line, respectively.
As shown in Fig. 10, every hypocenter distribution indicates a down-warping feature on the NW–SE sec-tion, which is similar in shape with that of high-atten-uation zone on the SAP profile of KR101. Particularly, those features resulted from OBS networks deployed above the earthquake swarm (Sakai et al. 2001; Nishi-zawa et al. 2002) are important in evaluating the shape and depth of hypocenter distribution. On the other hand, the hypocenter distribution of Uhira et al. (2005) may be strictly inappropriate to evaluate the shape and depth of the swarm activity because it was determined by land network. However, its distribution is indispensable to investigate the early stage of the 2000 swarm activity that initiated from the Miyakejima side.
Thus, the down-warping high-attenuation zone on the SAP profile is appeared to reflect the 2000 swarm area, which would be dominated by fractures, from the simi-larity in shape. However, considering the difference in depth between the high-attenuation zone and the hypo-center distributions from OBS networks, it would be impossible that the high-attenuation zone is explained by only the 2000 swarm. Accordingly, we concluded that the down-warping high-attenuation zone observed on the SAP profile of KR101 reflects a fractured area that were developed by magma activity responsible for the earthquake swarms that have been repeatedly occurring between Miyakejima and Kozushima.
This conclusion can be supported by the low-veloc-ity zones that were specified by the wide-angle seismic refraction surveys (Kodaira et al. 2002; Nishizawa et al.
2002), because seismic attenuation is correlated with seismic velocity (Tompkins and Christensen 2001; Tsuji and Iturrino 2008). However, why is not the dominant down-warping high-attenuation feature observed on the lines KR102-104? Although this issue is difficult to be
revealed due to the limited data, we interpret that this may be caused by the difference in distance of ray paths that have influence on attenuation. As shown in Fig. 7, the deeper events (>7 km) of the swarm form a very thin (2 km thick) plane of a NW–SE strike and a vertical dip (Sakai et al. 2001), like a flower structure consisting of strike-slip faults. The seismic reflection waves collected on the lines KR102-104 should get across the plane, while those on the KR101 should propagate through the plane.
Fig. 8 Hypocenter distributions by Nishizawa et al. (2002). The hypocenters determined by OBS during the time rage from July 11
to 31 in 2000 (top figure) and from January 21 to February 13 in 2001
(bottom figure) are shown. Thin and thick dashed lines indicate the
lower boundaries of the earthquake activities of the top and bottom
Accordingly, the most predominant high-attenuation fea-ture would be shown up on a seismic line running over and along the thin plane.
Conclusions
The present study suggested a possibility that the seismic attenuation profiling (SAP) can map physical properties
of rocks in poorly reflective area such as volcanic area, where seismic reflection profile is difficult to provide structural information or physical properties because of very few reflections.
The down-warping high-attenuation zone was mapped by SAP between Miyakejima and Kozushima. This would reflect a fractured area that was developed
KR10
4
(26
thJune to 15
thJuly)
34 30’
34 00’
34 30’
34 00’
139 00’
139 30’
0
10
20
30
Depth (km)
0
10
20
30
139 00’
139 30’
Depth
(km)
0
30km
Fig. 9 Hypocenter distributions by Uhira et al. (2005). They applied a station correction and double-difference method to relocate hypocenters
by magma activity responsible for the earthquake swarms that have been repeatedly occurring there. The zone is also consistent with the low-velocity zone deduced from the previous wide-angle seismic refrac-tion studies.
Authors’ contributions
TT is responsible in the whole part of the manuscript. TN conducted a part of the data processing of the seismic reflection data and contributed to the interpretation and the discussions. GF contributed to the data acquisition of the seismic reflection data, a part of the SAP calculation procedure and the discussions. All authors read and approved the final manuscript.
Author details
1 Academic Assembly, Tokyo University of Marine Science and Technology (TUMSAT), 5-7, Konan 4-chome, Minato-ku, Tokyo 108-8477, Japan. 2 Research and Development Center for Earthquake and Tsunami, Japan Agency for Marine-Earth Science and Technology (JAMSTEC), 3173-25 Showa-machi, Kanazawa-ku, Yokohama 236-0001, Japan.
Acknowledgements
Thanks are due to JAMSTEC for disclosure of the seismic reflection data of KR00-08 survey and Captains, Seismic Party, and the crew of the R/V KAIREI for their efforts to acquire data of good quality in difficult weather condi-tions. We are deeply grateful for Editor Dr. Yosuke Aoki and two anonymous
0
July 8 to August 2, 2000, Land staon and OBS (Sakai et al., 2001) July 11 to 31, 2000, OBS (Nishizawa et al., 2002)
January 21 to February 13, 2001, OBS (Nishizawa et al., 2002) June 26 to July 15, 2000, Land staon (Uhira et al., 2005)
Depth
Fig. 10 Hypocenter distributions by previous studies were compared with the down-warping high-attenuation zone specified on SAP of KR101. The color scale shows percentage deviation from the mean. The lower boundaries of the hypocenter distributions of Sakai et al. (2001), the 1st
observation of Nishizawa et al. (2002), 2nd observation of Nishizawa et al. (2002) and Uhira et al. (2005) are indicated as a thick chain line, a thin
dashed line, a thick dashed line and a dotted line, respectively
referees whose comments and suggestions helped to improve and clarify the manuscript. The survey was conducted as JAMSTEC Frontier Research Program for Subduction Dynamics and a research program supported Special Coordination Funds of the Ministry of Education, Culture, Sports, Science and Technology of Japan.
Competing interests
The authors declare that they have no competing interests.
Appendix 1
Appendix 2
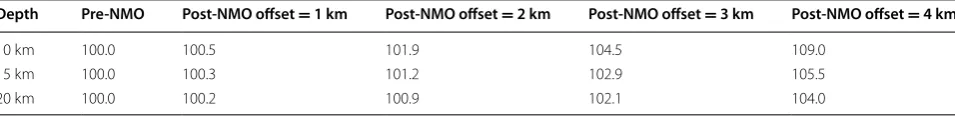
Spectrum distortion by NMO correction is exam-ined in this “Appendix.” Errors in average Q values for several source–receiver offsets due to frequency distortion are examined by using pre- and post-NMO traces under the data acquisition geometry of the pre-sent study, assuming a constant velocity of 5 km/s. As shown in Table 2, the errors are less than 9% in 10 km depth, 5.5% in 15 km depth and 4% in 20 km depth. Since the errors on pre-NMO traces are averaged by CDP stacking, those of post-NMO (stacked) traces would be estimated 5% or less in case of the present study.
Received: 22 August 2016 Accepted: 20 December 2016 Table 1 Seismic line specifications and data acquisition parameters
Line name Line length Direction Shot point
KR101 50.0 km NW → SE 1250–2250
KR102 44.7 km NE → SW 1082–1976
KR103 52.25 km SW → NE 1045–2090
KR104 30.65 km S → N 1207–1820
Observation period November 21–27, 2000
Vessel R/V Kairei
Source Air-gun array, 8 × 1500 cu. in., 2000 psi, towing depth 10 m
Shot spacing 50 m
Receiver Streamer cable, 156 channel, array hydrophones (32 phones/channel), towing depth 20 m
Receiver spacing 25 m
Source–receiver offset length 200–4100 m
Sampling rate 4 ms
Record length 15 s
SEG-D Format Conversion
Trace Eding
Geometry Set
Datum Correcon
Pre Filter
Amplitude Recovery
Deconvoluon
Velocity Analysis
NMO Correcon
Mulple suppression
Inner and Outer Mutes
CDP Stack
Kirchhoff Time Migraon SEG-Y
Bandpass Filter
Scaling
Plot SEG-Y
Iter
aon
Pass band: 3-100 Hz
T**2.0
Predicve distance: 24 ms
Stretch factor: 2.0
Parabolic radon transform filter
Migraon aperture: 60
Pass band: 5-50 Hz
AGC: 2000 ms First 2 km interval,
Final 1 km interval
Fig. 11 Data processing flow and processing parameters
References
Dasgupta R, Clark RA (1998) Estimation of Q from surface seismic reflection data. Geophysics 63:2120–2128
Hamada N (2001) A history of seismic activity around Miyakejima, Kozushima and Niijima, the northern Izu islands. J Geogr 110:132–144 (in Japanese with English abstract)
Hamada N, Tanaka Y, Nishide N (1985) Detailed comparison of seismic activi-ties associated with the 1962 and the 1983 eruption of Miyake-jima. Bull Volcanol Soc Jpn 30:147–160
Hauge PS (1981) Measurements of attenuation from vertical seismic profiles. Geophysics 46:1548–1558
Japan Meteorological Agency (2000) Recent seismic activity in the Miyakejima and Niijima–Kozushima region, Japan: the largest earthquake swarm ever recorded. Earth Planets Space, 53(8):i–viii. doi:10.1186/BF03351657 Knopoff L (1964) Q. Rev Geophys 2:625–660. doi:10.1029/RG002i004p00625 Kodaira S, Uhira K, Tsuru T, Sugioka Y, Suyehiro K, Kaneda Y (2002) Seismic
image and its implications for an earthquake swarm at an active volcanic region off the Miyake-jima–Kozu-shima, Japan. Geophys Res Lett 29:43.1–43.4
Matsushima J (2006) Seismic wave attenuation in methane hydrate-bearing sediments: vertical seismic profiling data from the Nankai Trough explor-atory well, offshore Tokai, central Japan. Geophys Res Lett 32:L03306. doi:10.1029/2005GL024466. [Correction, Geophys Res Lett 33:L02305. doi:10.1029/2005GL024466, 2006]
Mavko GM, Nur A (1979) Wave attenuation in partially saturated rocks. Geo-physics 44:161–178
Mikada H, Watanabe H, Sakashita S (1997) Evidence for subsurface magma bodies beneath Izu-Oshima, volcano inferred from a seismic scattering analysis and possible interpretation of the magma plumbing system of the 1986 eruptive activity. Phys Earth Planet Inter 104:257–269 Mogi K (1963) Some discussion of after shocks, fore shocks and earthquake
swarms. Bull Earthq Res Inst Univ Tokyo 41:615–618
Nishizawa A, Ono T, Otani Y (2002) Seismicity and crustal structure related to the Miyake-jima volcanic activity in 2000. Geophys Res Lett 29:12.1–12.4 Sakai S, Yamada T, Ide S, Mochizuki M, Shiobara H, Urabe T, Hirata N, Shinohara
M, Kanazawa T, Nishizawa A, Fujie G, Mikada H (2001) Magma migration from the point of view of seismic activity in the volcanism of Miyake-jima island in 2000. J Geographys 110:145–155 (in Japanese with English abstract)
Spencer TW, Sonnad JR, Butler TM (1982) Seismic Q-stratigraphy or dissipation. Geophysics 47:16–24
Tokuyama H, Suyehiro K, Watanabe H, Ohnishi M, Takahashi A, Ikawa T, Asada M, Fujioka K, Ashi J, Kuramoto S, Soh W, Ogawa Y (1988) Multichannel seismic reflection profile from south of the Izu Oshima. Kazan 33:67–77 (in Japa-nese with English abstract)
Tompkins MJ, Christensen NI (2001) Ultrasonic P- and S-wave attenuation in oceanic basalt. Geophys J Int 145:172–186
Tonn R (1991) The determination of seismic quality factor Q from VSP data: a comparison of different computational methods. Geophys. Prosp. 39:1–27
Tsuji T, Iturrino GJ (2008) Velocity-porosity relationships in oceanic basalt from eastern flank of the Juan de Fuca Ridge: the effect of crack closure on seismic velocity. Explor Geophys 39:41–51
Tsukui M, Suzuki Y (1998) Eruptive history of Miyakejima volcano during the last 7000 years. Bull Volcanol Soc Jpn 43:149–166 (in Japanese with English abstract)
Tsuru T, Fujie G (2006) Reflective body observed by multi-channel reflection survey off Niijima and Kozushima, Japan. JAMSTEC R&D 3:53–60
Tsuru T, No T (2011) Seismic attenuation attribute and its implication to physi-cal property analyses in less-reflective areas. In: Proceedings of the 10th SEGJ international symposium, pp 151–154
Tsuru T, Sasaki A, Urabe S (2014) Fault seal evaluation by using attenuation effects of seismic reflection data. J Jpn Assoc Petrol Technol 79:54–62 (in Japanese with English abstract)
Uhira K, Baba T, Mori M, Katayama H, Hamada N (2005) Earthquake swarms preceding the 2000 eruption of Miyakejima volcano. Jpn Bull Volcanol 67:219–230
Worthington MH, Hudson JA (2000) Fault properties from seismic Q. Geophys J Int 143:937–944
Zhou J, Birdus S, Hung B, Teng KH, Xie Y, Chagalov D, Cheang A, Wellen D, Garrity J (2011), Compensating attenuation due to shallow gas through Q tomogra-phy and Q-PSDM, a case study in Brazil. Expanded abstract, 2011 SEG annual meeting
Table 2 Average Q values calculated by spectral ratio using pre- and post-NMO traces
Depth Pre-NMO Post-NMO offset = 1 km Post-NMO offset = 2 km Post-NMO offset = 3 km Post-NMO offset = 4 km
10 km 100.0 100.5 101.9 104.5 109.0
15 km 100.0 100.3 101.2 102.9 105.5