FULL PAPER
Visualization of attenuation structure
and faults in incoming oceanic crust of the
Nankai Trough using seismic attenuation
profiling
Tetsuro Tsuru
1*, Jin‑Oh Park
2, Tetsuo No
3, Yukari Kido
4and Kazuo Nakahigashi
1Abstract
Seismic attenuation properties were tested as indicators of lateral variation in geological structures and detection of faults within poorly reflective oceanic crust, on a seismic survey line along the Nankai Trough. We can specify both sedimentary structures by configuration of reflections and faults by offsetting of reflections on seismic reflection pro‑ files. This procedure is often applied to analyze geological structures and existence of faults within sedimentary layers; however, it is almost impossible to analyze them within igneous oceanic crust because seismic reflections are inher‑ ently invisible there. Therefore, we applied seismic attenuation profiling to visualize geological structures and faults within poorly reflective oceanic crust. As a result, oceanic crust altered by late‑coming volcanisms as well as damaged by intraplate earthquakes was imaged as extremely high‑attenuation property, which was clearly distinguished from normal oceanic crust. Many faults were observed in the sedimentary unit on the seismic reflection profile, whereas possible lower segments of the faults were imaged as high‑attenuation stripes in the oceanic crust on the seismic attenuation profile. Thus, the effectiveness of seismic attenuation profiling to structural and fault imaging within poorly reflective oceanic crust was successfully demonstrated.
Keywords: Seismic attenuation, Fault, Oceanic crust, Earthquake, Nankai Trough
© The Author(s) 2018. This article is distributed under the terms of the Creative Commons Attribution 4.0 International License (http://creativecommons.org/licenses/by/4.0/), which permits unrestricted use, distribution, and reproduction in any medium, provided you give appropriate credit to the original author(s) and the source, provide a link to the Creative Commons license, and indicate if changes were made.
Open Access
*Correspondence: [email protected]
1 Academic Assembly, Tokyo University of Marine Science and Technology (TUMSAT), 5‑7, Konan 4‑chome, Minato‑ku, Tokyo 108‑8477, Japan Full list of author information is available at the end of the article Introduction
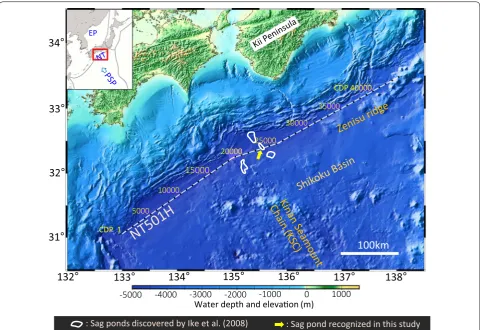
The Nankai Trough (NT) is located at the northern mar-gin of the Philippine Sea Plate (PSP) subducting below
the Eurasian Plate (EP) (Fig. 1), where large earthquakes
with Mw > 8 have occurred with a recurrence interval
of 100–200 years (Ando 1975). Seismic reflection
stud-ies have been carried out in the landward slope of the NT to reveal the geologic structures of this seismogenic
plate boundary (e.g., Moore et al. 1990; Park et al. 2002a).
However, only a few seismic reflection studies (e.g., Ike
et al. 2008) have been conducted in the seaward slope of
the NT.
The seaward slope of the NT is located on the Shikoku Basin, which is a backarc basin developed in the northern part of PSP. Detailed mapping of magnetic anomalies and
topography (e.g., Okino et al. 1994) revealed its
compli-cated basin-evolution process from ca. 30–15 Ma: rifting, NNW–SSE opening, N–S opening, NW–SE opening and post-opening volcanism of the Kinan Seamount Chain (KSC) trending NNW-SSE. KSC can be interpreted to be created from upwelling of magma at the cross-point of remnant spreading center and fracture zones (Okino
et al. 1994). Ike et al. (2008) revealed regional and local
variations in basement relief, sediment thickness and sediment type in the Shikoku Basin by using 40 lines of seismic reflection data. The authors also detected deep
basement lows (sag ponds) along the KSC (Fig. 1).
Regarding fault imaging study in the oceanic crust
in the NT, Tsuji et al. (2013) identified widely
subducting PSP off the Kii Peninsula based on 2D and 3D seismic reflection data and indicated that these faults cut the oceanic Moho and act as conduits for transport of water into the crust and upper mantle. However, intracrustal faults within the incoming PSP in areas other than off the Kii Peninsula have not previously been discussed because seismic reflections have rarely been observed in such locations. Poor reflectivity may lead to failure to recognize the existence of active faults until they are revealed by sudden earthquakes and sub-sequent aftershocks, if they were active faults. Therefore, it is important to identify the presence, size and activity extent of seismic faults for prevention and mitigation of earthquake-related disasters. Investigation of intrac-rustal faults is important not only to understand their relationships with intracrustal earthquakes (e.g., Yadav
et al. 2013) but also the contribution of fluid interactions
between the mantle and crust in generating earthquakes
(e.g., Sano et al. 2014).
The past activity of a fault is recorded as offsets of geo-logical formations at the fault’s location. Therefore, the location, size, timing, type and displacement of the fault can be analyzed from seismic reflection profiles based on the offsets of reflections (e.g., Mansfield and Cartwright
1996; Kattenhorn and Pollard 2001). However, analyzing
past fault activity in this manner is impossible in poorly reflective areas, such as igneous oceanic crust where seis-mic reflections are inherently invisible. Therefore, alterna-tive methods to those conventionally applied are required.
Worthington and Hudson (2000) showed that a fault
zone can be characterized as a high-attenuation zone using vertical seismic profiling (VSP) data in the North
Sea. An abrupt increase in attenuation to a Q value of
45, which is associated with a region between 1000 and 2000 m depth where the borehole intersects a major fault zone dipping at approximately 50 degrees, was observed
in the previous study (Harris et al. 1997). Based on a
lin-ear slip theory of fault, Worthington and Hudson (2000)
considered that the increase in attenuation was caused by fractures imperfectly bonded the fault interfaces.
Tsuru et al. (2014) showed negative correlation between
seismic attenuation and fault sealing ability for hydro-carbons using 3D seismic reflection data. The authors
computed Q by spectral ratio method in the small study
area, where two kinds of faults exist: a fault that seals hydrocarbon and a fault that seals no hydrocarbon. As a result, the former was imaged as low-attenuation zone, whereas the latter as high-attenuation zone. Given that the former has strong fault coupling and the later has weak fault coupling at the interfaces, the result (negative correlation between seismic attenuation and fault sealing
ability) can be well explained. Nagata et al. (2008)
dem-onstrated a clear relationship between fault friction and
seismic attenuation based on laboratory measurements. In this paper, seismic waves, which propagated across the fault interface having week friction, strongly attenuated. Reversely, seismic waves, which propagated across the fault interface having strong friction, did not show much attenuation. For seismogenic depths, Blakeslee et al.
(1989) developed a technique to measure seismic
attenu-ation within an active fault zone along the San Andreas Fault and suggested that seismic attenuation is a valua-ble indicator of the mechanical behavior and rheology of
fault zones. Tsuru et al. (2017) delineated an earthquake
swarm zone in a volcanic area using seismic attenuation profiling (SAP), in which seismic attenuation is mapped instead of reflection amplitude. The seismic reflection data used in the study were collected immediately after the eruption of Miyakejima island volcano in 2000. The earthquake swarm initiated from the Miyakejima soon after the eruption and migrated westward with a dike shape. The swarm zone was imaged as high-attenuation zone. Thus, attenuation properties may have a potential in identifying not only the presence but also the present activity of faults. This paper presents the results of visu-alization of lateral variation in geological structure and fault, constructed using the SAP method, within poorly reflective oceanic crust of the seaward slope of the NT.
Seismic reflection data and methods
Seismic reflection survey was conducted from onboard the R/V Kairei of the Japan Agency for Marine-Earth Science and Technology (JAMSTEC) along the seismic line NT501H in 2005, which followed the axis of the NT
southwest of Japan (Fig. 1). In this survey, a total of ca.
552 km of seismic reflection records with very-high ver-tical-resolution were collected using two GI guns (with a total volume of 12 L). As a receiver, a 5100-m streamer cable was used. The shot, receiver and common depth point (CDP) intervals were 50, 25 and 12.5 m, respec-tively. The GI guns and the streamer cable were towed at depths of 5 and 8 m below sea level, respectively; these towing depths are shallower than those of conventional Kairei seismic reflection surveys (10 and 15 m) and pro-vide broader frequency bandwidth because of higher ghost-notch frequencies. Broader frequency bandwidth is advantageous for not only analyzing fault characteristics with high resolution but also estimating seismic attenu-ation, especially for methods in the frequency domain such as the spectral ratio method.
Standard data processing was applied with sampling rate of 2 ms, including trace editing, deconvolution, mul-tiple removal, NMO correction with stretching factor of 1.5, CDP stacking and post-stack time migration with maximum dip of 60 degree; these methods are described
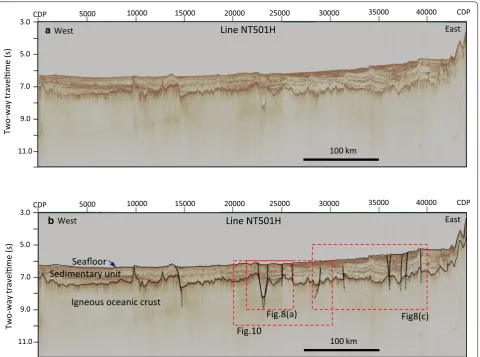
time-migrated seismic reflection profile is shown in
Fig. 2. Continuous reflections, as well as the faults that
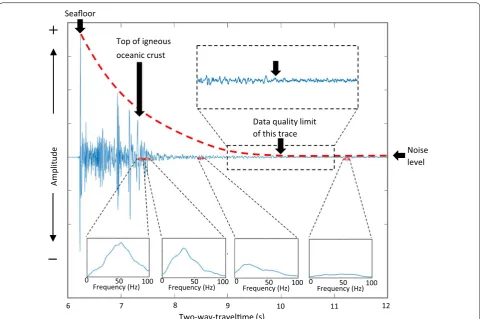
cut them, are clearly visible in the profile. Based on noise
level analysis using the amplitude decay curve (Fig. 3),
the trace length applicable to SAP analysis is about 10 s in two-way travel time; amplitude decreases with increasing travel time and asymptotically approaches a flat level at about 10 s, which represents the level of noise in the data acquisition system.
To estimate spatial variation of the attenuation struc-ture in the oceanic crust, SAP was applied. Here, we used the spectral ratio method to calculate seismic attenu-ation properties from multichannel seismic reflection data, because this method is one of the most widely used
methods to estimate the value of Q (e.g., Tonn 1991). The
temporal decay in amplitude of a propagating seismic
wave of frequency f from travel time t1 to travel time t2
can be expressed as a function of Q:
are the geometrical spreading and reflection coefficients, respectively. Taking the spectral ratio and then the loga-rithms of both sides:
Because the logarithm of the spectral ratio is a linear
function of frequency f, as expressed in Eq. (2), Q can be
computed from its gradient p using Eq. (3) for the time
window between t1 and t2. Prior to the amplitude
spec-trum computation, we made subsampling of the sam-pling rate of the input seismic data from 2 to 0.5 ms.
As shown in Fig. 4, we computed the gradient p by
linear approximation with the least squares method. To
evaluate reliability of the gradient p determination,
cor-relation coefficient of the linear approximation was (2)
Water depth and elevaon (m)
: Sag ponds discovered by Ike et al. (2008) : Sag pond recognized in this study
34
°
calculated at every location and then mapped on the
profile, as seen in Fig. 5. Almost of the correlation
coeffi-cients are smaller than − 0.8, showing high negative
cor-relation in the gradient p determination.
To avoid influence from sediments and to detect spa-tial variation in attenuation properties only within the
igneous oceanic crust, Q was calculated only for depths
of the crust and the uppermost mantle. The amplitude
spectrum At1 was computed in the time window set on
the top of the crust, and the amplitude spectrum At2 was
computed in every time window within the crust.
Result-ing Q represents so-called average Q (not interval Q),
which shows average Q value between t1 and t2. Here
we adopted a constant time-window length of 128 ms and a frequency band of 10–70 Hz for the calculation of
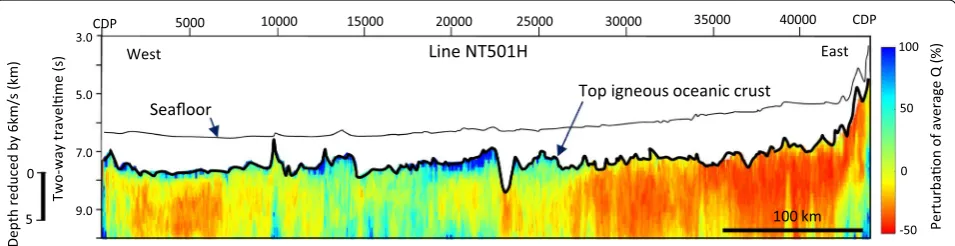
the gradient p in Eq. (3). This calculation was repeated
trace by trace, and every average Q value was mapped
as seismic attenuation profile in Fig. 6. The color scale
from red (high attenuation) to blue (low attenuation) represents the percentage deviation from the median
value (13.4) of the average Q for the entire profile. Here,
the resulting percentage deviations of average Q values
were mapped on the time windows of the denominator of
Eq. (2) on every trace: the uppermost percentage
devia-tion of average Q represents that from the spectral ratio
of At2/At1 of Eq. (2), the second uppermost percentage
deviation of average Q represents that from the spectral
ration of At3/At1 and so on.
In the present study, moving-average filters both in the vertical direction with a sliding window of 3 time dows and in the horizontal direction with a sliding win-dow of 51 traces (CDPs), were applied to mitigate the influences of abnormal values caused by local noise. The lengths of the vertical 384-ms sliding time window and
5000 10000 15000 20000 25000 30000 35000 40000
Igneous oceanic crust
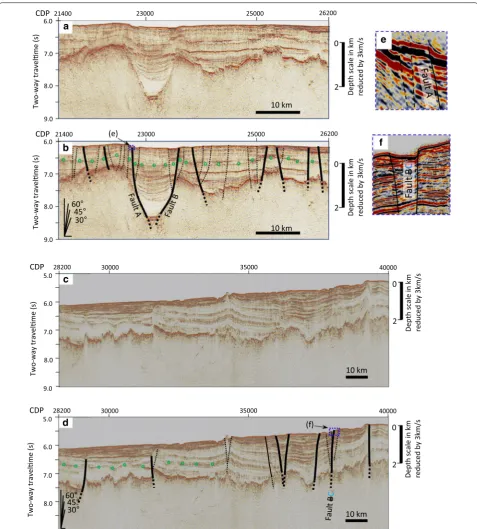
Fig. 2 Seismic reflection profile of the NT501H line. The post‑stack time migration profile is shown in the top panel (a), and the profile with fault
interpretation in the bottom panel (b). The horizontal axes of the figures represent CDP numbers, and the vertical axes indicate two‑way travel time
in seconds. Rectangles with red broken lines mark the areas expanded in Figs. 8a, c and 10. Several faults can be interpreted by offsetting of reflec‑
the horizontal 1275-m sliding trace window represent the vertical and horizontal resolutions of the present SAP analysis, respectively.
As input data of SAP calculation, we used a post-stack time migration record in the present study, because post-stack data have an advantage in S/N ratio because random noise and remaining multiples are strongly suppressed by stacking effect. However, it has a disad-vantage in preservation of original frequency contents because NMO correction distorts frequency of reflec-tion. Reversely, pre-stack data have also been used (e.g.,
Dasgupta and Clark 1998), because the pre-stack data
have an advantage in frequency preservation. However, it has a disadvantage in S/N ratio. Therefore, pre-stack data
would be used to estimate absolute Q values in a limited
area, where variety of random noise as well as remaining
multiples are limited, as Dasgupta and Clark (1998) did
around a gas reservoir. Post-stack data would rather be
appropriate to estimate relative variation in Q over a wide
area than pre-stack data because of higher S/N ratio.
Moreover, there is no large lateral variation in velocity within the igneous oceanic crust, so lateral variation in frequency distortion by NMO stretching is not so large there.
Amplitude
Two-way-travelme (s)
8 9
6 7 10 11 12
Seafloor
Data quality limit of this trace
Noise level Top of igneous
oceanic crust
0 50 100
Frequency (Hz) 0 Frequency (Hz) 50 100 0 Frequency (Hz) 50 100 0 Frequency (Hz) 50 100
Fig. 3 Amplitude decay curve of a representative trace. The representative trace was computed by averaging 11 traces from CDPs 24,000 to 24,010. The red broken line shows amplitude decay curve of the representative trace, whose amplitude has the maximum value at the seafloor, decreases with increasing travel time and reaches a flat noise level at around 10 s. Amplitude spectra were shown at several time windows, which enables us to understand attenuation effects in frequency domain and frequency contents of noise
Correlaon coefficient = - 0.983
P = - 0.0564
Frequency (HZ)
Leg
alism
of
spect
ra
l ra
o 0
-1 -2 -3
10 20 30 40
-4
50 60 70
Fig. 4 An example of gradient p computation and correlation coefficient on linear approximation. Black solid curve shows the logarithm of spectral ratio function of frequency (10–70 HZ) in a time window 8.960–9.088 s at a location of CDP24000. Orange broken line
is approximate straight line with gradient p, which was computed by
linear approximation with the least squares method. The correlation
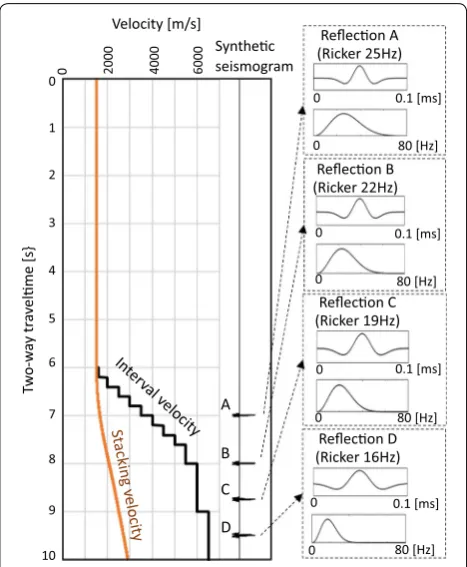
Here we examine the Q estimation errors based on frequency distortion by NMO stretching effect at NMO correction in the present seismic data. The NMO stretch-ing is a frequency distortion in which reflection waves are shifted to lower frequencies, being a function of source-receiver offset, travel time and NMO velocity. The stretching is confined mainly to large offsets and shallow
travel times (Yilmaz and Doherty 1987). Because there is
no large lateral variation in velocity within the igneous oceanic crust, a representative velocity function in the
study area was used in the modeling (Fig. 7). First, the
NMO stretching effects are calculated using a synthetic seismogram that consists of Ricker wavelets with central frequencies of 25, 22, 19 and 16 Hz, for the offsets from 0 to 5100 m and for travel time from 0 to 10 s using the velocity function. Second, spectra of the NMO-stretched
reflections (A-D) were calculated and then Q values were
estimated using the spectral ratio. Here, the spectrum of reflection A was used for the denominator of the left
side of Eq. (2) and that of the other reflections were used
for the numerator. The resulting percentage errors in
Q estimation are summarized in Table 1. All the errors
are less than 1.5%, which would bring no significant
misunderstanding of attenuation structure. In the pre-sent study, therefore, we used post-stack seismic data for
Q computation by spectral ratio method and discuss
lat-eral variation in attenuation property in the igneous oce-anic crust.
Interpretation of seismic reflection and attenuation profiles
The seismic reflection profile clearly shows sedimentary layers overlying the igneous oceanic crust, as well as
many faults cutting through the strata, as shown in Fig. 2.
A deep basement low (sag pond) can be observed in the central part of the NT501H line: around CDP23000. The oceanic crust shows gentle topography in the western side of the line, excluding two locations: CDPs 10,000 and 14,500. Conversely, it shows jaggy topography, associ-ated with faulted and folded structures in the sedimen-tary unit, in the eastern side. A part of profile is enlarged
in Fig. 8 to illustrate faults identified in the sedimentary
unit. Most of those faults have displacements on the
sea-floor (Fig. 8e, f), which indicates that they are presently
active. Moreover, those faults show tectonic features as follows:
Igneous oceanic crust
-1.0
Fig. 5 Mapping of correlation coefficient on linear approximation to compute gradient p in the Eq. (3). Almost all of the correlation coefficients are
smaller than − 0.8, showing high negative correlation. Only a very few locations have around − 0.6, but still being moderate negative correlation
5000 10000 15000 20000 25000 30000 35000 40000
3.0
5.0
7.0
9.0
Two-way travelme (s)
Line NT501H
CDP CDP
100 km
Depth reduced by 6km/s (km)
0
5
West East
Seafloor Top igneous oceanic crust
0
-50 50 100
Perturbaon of average Q (%)
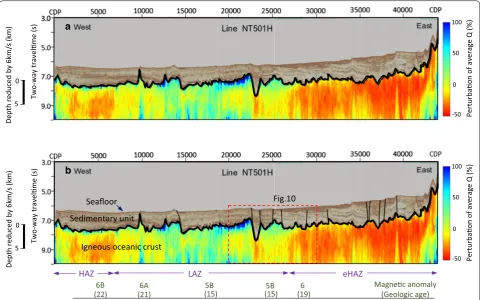
Fig. 6 Seismic attenuation profile of the NT501H line. The numerals on the top horizontal axis of the figure represent CDP numbers, and the vertical axes indicate two‑way travel time in seconds. Left side depth scale is computed from the two‑way travel time with reduction velocity of 6 km/s. The
• Ambiguous stratigraphic correlation or inconsistency of fault-displacement accumulation on both sides of the dominant faults.
• Flower-structure-like reflection patterns (around CDP 23,500–24,000).
These features are consistent with those of strike-slip fault.
Figure 9 shows a composite profile of seismic
reflec-tion and seismic attenuareflec-tion. A part of the composite
profile is enlarged in Fig. 10. The seismic reflection
pro-file shows sedimentary layers, folding structures and faults above the igneous oceanic crust. Meanwhile, the seismic attenuation profile shows lateral variation in
attenuation structure and near-vertical high-attenuation
stripes within the crust (Fig. 10). These high-attenuation
stripes extend downward from immediately beneath the faults specified within the sedimentary unit on the seis-mic reflection profile. Therefore, the high-attenuation stripes were interpreted as faults, as mentioned in the next Chapter. In the present study, we defined the average
Q values having negative percentage perturbation
(yel-low to red) as ‘high-attenuation’ and those having posi-tive percentage perturbation (yellowish green to blue) as ‘low-attenuation.’
Discussion
Type and present activity of faults
Many faults were observed in the sedimentary unit on
the reflection profile (Figs. 2 and 8). The faults appear
to be presently active and can be interpreted as those of strike-slip type. Although it is difficult to identify this fault type based only on a 2D seismic profile because of the limited lateral extent of apparent vertical displace-ment, this interpretation on fault activity and type may be supported by the repeated long-term ocean-bottom seismometer (OBS) observations by Mochizuki et al.
(2010). The authors detected high seismicity in the
down-dip extension of the KSC beneath the landward slope, and most of the focal mechanisms of the earthquakes observed were of strike-slip type. In terms of fault type, almost all of those faults may have been originally formed as normal faults because their dips range from 30 to 60 degrees, which are consistent with the typical dip angles of normal faults. Namely, those faults would have been reactivated after the oblique subduction (e.g., Seno et al.
1993) as strike-slip faults (Tsuji et al. 2014).
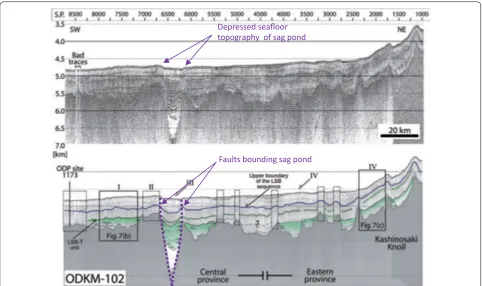
Here we discuss present activity of the faults A and B, which bound the sag pond around CDP 23,000 on line
NT501H (Fig. 7b). Although the previous study (Ike et al.
2008) has not discussed about the present activity of the
faults bounding the sag pond, the depressed seafloor
implies that they are presently active (Fig. 11). Moreover,
the displacements of the faults A and B are significantly
larger than those of the others (Fig. 8b). Those
observa-tions suggest that the present activity of the faults A and
B are most predominant among the faults imaged around
the sag pond.
Fig. 7 Velocity model and synthetic seismogram for testing Q esti‑ mation errors caused by frequency distortion associated with NMO stretching. The orange solid curve is the stacking velocity function used for NMO correction. The synthetic seismogram contains four Ricker wavelets of center frequency of 25, 22, 19 and 16 Hz
Table 1 Percentage errors in Q estimation caused by frequency distortion at NMO correction
Offset 0 (m) 100 (m) 1100 (m) 2100 (m) 3100 (m) 4100 (m) 5100 (m)
Q errors at 8.0 s 0.0 0.0 0.0 0.1 0.4 0.6 1.4
Q errors at 8.75 s 0.0 0.0 0.1 0.0 0.2 0.2 0.5
Fault
Two-way travelme (s)
26200
Depth scale in km reduced by 3km/s
0
Two-way travelme (s)
Depth scale in km reduced by 3km/s
0
Two-way travelme (s)
Depth scale in km reduced by 3km/s
0
Two-way travelme (s)
CDP (e)
b
30°
45°
60°
Depth scale in km reduced by 3km/s
0
2
Fig. 8 Enlarged seismic reflection sections. A basement depression and surrounding many faults are visible in the panels (a) and (b). Both folding
structures and faults are observable in the panels (c) and (d). Fault displacements at and immediately below the seafloor are enlarged in the top‑
right panels (e) and (f), suggesting that those faults are presently active. Green open circles in (b) and (d) show the upper boundary of the lower
Lateral variation in attenuation structure
Figure 9 shows lateral variation in attenuation structure
within the igneous oceanic crust: high-attenuation zone in the west of CDP 7000 (HAZ), low-attenuation zone between CDP 7000 and CDP 27000 (LAZ), extremely high-attenuation zone in the east of CDP 27000 (eHAZ). First, we discuss about the contrast between HAZ and LAZ. What does the contrast reflect; variation in devel-opment degree of normal faults primarily formed at the ocean floor spreading or late-coming structural activity such as volcanism after the spreading?
If the development degree of the normal faults is the case, there should be significant change in the spread-ing rate between ca 22 Ma (magnetic anomaly 6B) and ca
21 Ma (magnetic anomaly 6A), as seen in Fig. 12.
How-ever, no such change has been reported by previous
stud-ies (e.g., Okino 2015). In case that their spreading rates
were same, the direction of line NT501H to the mag-netic lineation may be influenced to attenuation property imaged on the line. The line NT501H perpendicularly crosses the magnetic anomaly 6B in the HAZ, whereas the line obliquely crosses the magnetic anomaly 6A in the LAZ. Since the direction of the normal faults formed at
the spreading is parallel to the magnetic anomaly, seismic waves passing perpendicularly to the magnetic anomaly have apparently larger attenuation than those passing obliquely to the anomaly. The effect by the crossing angle difference appears to be consistent with the attenuation contrast between HAZ and LAZ.
Volcanic activities after the spreading have been
reported at some seamounts in KSC (Ishii et al. 2000),
but not in the HAZ. Therefore, the late-coming volcan-ism cannot be a candidate of the attenuation contrast between HAZ and LAZ. Thus, the lateral variation in attenuation between HAZ and LAZ may have been observed by the difference of crossing angle between the seismic line and the magnetic lineation. However, fur-ther studies or observations are required to reveal this contrast.
Next, we discuss about the contrast between LAZ and eHAZ. It is difficult to explain this contrast unifiedly by the same reason as that between HAZ and LAZ, because the NT501H obliquely crosses the magnetic anomaly on the eastern Shikoku Basin (CDPs 30,000–44,000) where eHAZ was imaged. Therefore, we discuss two possibilities
Magnec anomaly
Perturbaon of average Q (%)
Two-way
Perturbaon of average Q (%)
Fig.10 Seafloor
Sedimentary unit
Igneous oceanic crust
b a
Fig. 9 Composite profile of conventional seismic reflection and attenuation profiles without fault interpretation (a) and with fault interpretation (b).
A rough scale of magnetic anomalies and corresponding geologic ages from Kido and Fujiwara (2004) is provided at the bottom horizontal axis of
to cause this attenuation contrast below: development of intraplate faults or widely spread over porous lithology.
Many intraplate earthquakes in the incoming oceanic crust off the Kii Peninsula have been recorded by OBS
(e.g., Obana et al. 2005) as seen in Fig. 13, and several
intraplate faults have been identified in seismic reflection
profiles off the Kii Peninsula (Tsuji et al. 2013). Those
many intraplate earthquakes would have brought about many structural movements. Actually, the sedimen-tary unit records the trace of the movements as folding
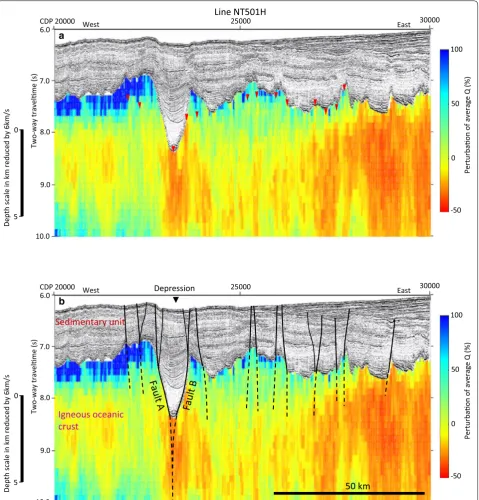
CDP 20000 West Line NT501H 25000 East 30000
a
Depth scale in km reduced by 6km/s
0
5 9.0
Two-way travelme (s)
7.0
8.0
10.0 6.0
Perturbaon of average Q (%)
-50 100
0 50
CDP 20000 West 25000 East 30000
b
Depth scale in km reduced by 6km/s
0
5 9.0
Two-way travelme (s)
7.0
8.0
10.0 6.0
Perturbaon of average Q (%)
-50 100
0 50
50 km
Sedimentary unit
Igneous oceanic crust
Depression
Fig. 10 Enlarged composite profile of conventional seismic reflection and attenuation profiles without fault interpretation (a) and with fault inter‑
pretation (b). Seismic reflectivity is effective for imaging geologic structures and faults in the sediments, whereas seismic attenuation is effective for
structures and the structures are left most evidently in
the sedimentary unit on eHAZ (Fig. 9). Even if the fault
shear zones of the intraplate earthquakes have high-attenuation property, more enormous number of faults than ever recognized would be required to explain the extremely high attenuation that spread all over the eHAZ.
Late-coming volcanism may be the other candidate because it brings about porous lithology. Looking at the location of the eHAZ, it is roughly consistent with that of
the Zenisu Ridge (Fig. 1). The normal oceanic crust was
identified beneath the Zenisu Ridge by a velocity
struc-ture study using OBS (Nakanishi et al. 2002), and the
magnetization highs associated with the ridge topogra-phy were identified by a magnetic inversion study (Kido
and Fujiwara 2004). Thus, if volcanic activity associated
with the ridge formation (e.g., Bandy and Hilde 1983)
overprinted normal oceanic crust, more porous volcanic rocks should be contained in the overprinted crust than in the normal one. The extremely high attenuation of the eHAZ may have been also influenced by such late-com-ing volcanic activity beneath the Zenisu Ridge. Thus, the SAP distinguished the oceanic crust altered by the vol-canism as well as damaged by the intraplate earthquakes from the normal oceanic crust.
High‑attenuation stripes in the igneous oceanic crust Many normal faults and transform faults formed dur-ing the several stages of evolution of the Shikoku Basin have been observed in previous bathymetric, geomag-netic and seismic reflection surveys (e.g., Chamot-Rooke
et al. 1987; Okino et al. 1994). In the present study, many
faults were identified in the sedimentary unit and some of them can be interpreted as active faults by offsetting
of reflections at the seafloor (Figs. 2 and 8). However,
no faults have been imaged in the igneous oceanic crust on the seismic profile. Since the faults cut the top of the
igneous oceanic crust as seen in Fig. 10, the faults must
cut into the crust. Based on high-attenuation property of fault zones from VSP data (Worthington and Hudson
2000) and 3D seismic data (Tsuru et al. 2014), the
pos-sible downward extension segments of the faults may be imaged as high attenuation. The relationship between the high-attenuation property and fault zone is also sup-ported by the laboratory measurement (Nagata et al.
2008) and the seismological study (Blakeslee et al. 1989).
The high-attenuation stripes observed in the attenua-tion profile indicate this expected behavior, which is also supported by previous geological studies from the view point of resolution of seismic reflection data: whether or not seismic wave having several hundred meter of
Depressed seafloor topography of sag pond
Faults bounding sag pond
Fig. 11 Activity of faults bounding the sag pond based on Ike et al. (2008). Although present activity of the sag pond was not mentioned by Ike
wavelength is able to detect physical property of fault
zone. For example, Niwa et al. (2015) showed that fault
zone consists of a fault core zone (primary slip zone) and fracture zones on both sides of the core zone. The total width of the zones extends several tens meters, being suf-ficient for seismic reflection survey to observe physical property of the fault zone. Thus, the above geophysical and geological findings are consistent with the interpre-tation that the high-attenuation stripes represent the downward segments of the faults that were identified within the sedimentary layers. Therefore, using SAP in
conjunction with conventional methods, more complete pictures of faults can be visualized.
The most predominant high-attenuation stripe can be
seen beneath the sag pond that was bounded by faults A
and B (Fig. 10). Why does the stripe there have the most
predominant high-attenuation property? If the faults around the sag pond were originally formed as normal faults at the ocean floor spreading and then reactivated as strike-slip faults after the oblique subduction of PSP, all of the faults would show almost uniform attenuation property because those faults were formed by region-ally consistent tectonics such as the spreading and the
Magnec anomaly (Geologic age) 6A
6B 5B 5B 6
(19) (21)
(22) (15) (15)
HAZ LAZ eHAZ
b
Two-way
travelme (s)
0
-50 50 100
Perturbaon of average Q (%)
Seafloor Sediments
Igneous oceanic crust
a
6
6A
6B
Deformaon front
DSR
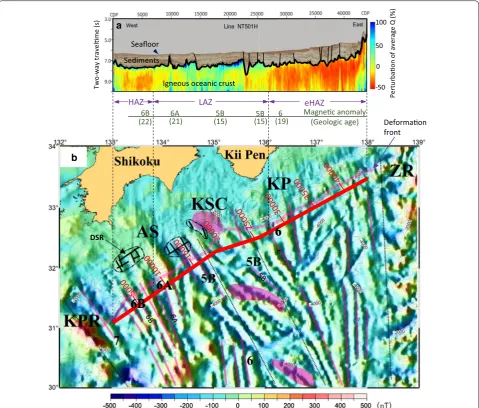
Fig. 12 Comparison between magnetic anomaly and seismic attenuation structure. The boundary of attenuation properties HAZ and LAZ is well
correlated to that of the magnetic anomalies 6B and 6A by Kido and Fujiwara (2004). KPR, AS, KSC and KP represent Kyushu paleo ridge, Ashizuri,
Kinan seamount chain and Kii peninsula, respectively. These five regions are divided by thin dotted lines. Pink solid lines indicate magnetic linea‑
b a
Magnec anomaly (Geologic age) 6
(19)
eHAZ
Two-way
travelme (s)
0
-50 50 100
Perturbaon of average Q (%)
Seafloor
Sediments
Igneous oceanic crust
West East
35000 40000
CDP 30000 3.0
5.0
7.0
9.0
Line NT501H
Fig. 13 Intraplate earthquakes in the incoming oceanic crust off Kii Peninsula based on Tsuji et al. (2009). Yellow solid line represents NT501H. The
focal mechanisms of mainshocks and aftershocks of the 2004 off the Kii Peninsula earthquake by Ito et al. (2005) are shown on the bathymetry map.
The epicenters of the aftershocks determined from a dense array of ocean‑bottom seismometers (Sakai et al. 2005) and the epicenters of micro‑
earthquakes during the inter‑seismic period (Obana et al. 2005) are mapped with red circles and red crosses, respectively. The active seismicity can
be seen on the extremely high‑attenuation zone (eHAZ). The orange rectangle shows the previous 3D seismic survey area. The red‑shaded area
subduction. However, the high-attenuation stripe below the sag pond is outstanding among those around the sag pond. If this outstanding high-attenuation property was caused by weaker fault friction based on the previous
laboratory measurement (Nagata et al. 2008), the faults
A and B may be interpreted more active than the others
at present. Our observation on the seismic profile, which
the faults A and B are most predominant active faults
around the sag pond, would support this interpretation. Thus, seismic attenuation property might be useful in discussing present activity of fault.
Conclusions
SAP was evaluated to investigate lateral variation in geo-logical structure and fault development within the poorly reflective incoming oceanic crust of the NT. Here are the results:
The oceanic crust altered by volcanism as well as dam-aged by intraplate earthquakes was visualized as the extremely high-attenuation zone (eHAZ), being distin-guished from the normal oceanic crust (HAZ and LAZ).
Faults were imaged as high-attenuation stripes, dem-onstrating that SAP may contribute to detection of faults in the igneous section of oceanic crust where faults are rarely imaged by conventional seismic reflection methods.
Authors’ contributions
TT is responsible in the whole part of the manuscript. JOP contributed to the data acquisition of the seismic reflection survey and the interpretation of attenuation structure. TN contributed the data processing of the seismic reflection data. YK contributed to the correlation between magnetic anomaly and seismic attenuation structure. KN contributed to the interpretation of high‑attenuation stripe. All authors read and approved the final manuscript.
Author details
1 Academic Assembly, Tokyo University of Marine Science and Technology (TUMSAT), 5‑7, Konan 4‑chome, Minato‑ku, Tokyo 108‑8477, Japan. 2 Atmos‑ phere and Ocean Research Institute, The University of Tokyo, 5‑1‑5, Kashiwan‑ oha, Kashiwa‑shi, Chiba 277‑8564, Japan. 3 Research and Development Center for Earthquake and Tsunami, Japan Agency for Marine‑Earth Science and Tech‑ nology (JAMSTEC), 3173‑25 Showa‑machi, Kanazawa‑ku, Yokohama 236‑0001, Japan. 4 Center for Deep Earth Exploration, Japan Agency for Marine‑Earth Science and Technology (JAMSTEC), 3173‑25 Showa‑machi, Kanazawa‑ku, Yokohama 236‑0001, Japan.
Acknowledgements
Thanks are due to JASMTEC for disclosure of the seismic reflection data of NT501H line and Captains, Seismic Party, and the crew of the R/V KAIREI for their efforts to acquire data of good quality. This study was supported by a Grant‑in‑Aid for Scientific Research from the Japan Society for the Promotion of Science (No. JP15H05717). We would like to express sincere thanks for the two anonymous reviewers whose comments/suggestions helped improve and clarify this manuscript.
Competing interests
The authors declare that they have no competing interests.
Publisher’s Note
Springer Nature remains neutral with regard to jurisdictional claims in pub‑ lished maps and institutional affiliations.
Received: 27 November 2017 Accepted: 9 February 2018
References
Ando M (1975) Source mechanisms and tectonic significance of his‑ torical earthquake derived from tsunami data. Phys Earth Planet Inter 28:320–336
Bandy WL, Hilde TWC (1983) Structural features of the Bonin Arc: implications for its tectonic history. Tectonophysics 99:331–353
Blakeslee S, Malin P, Alvarez M (1989) Fault‑zone attenuation of high‑frequency seismic waves. Geophys Res Lett 16:1321–1324
Chamot‑Rooke N, Renard N, Le Pichon X (1987) Magnetic anomalies in the Shikoku Basin: a new interpretation. Earth Planet Sci Lett 83:214–218 Dasgupta R, Clark RA (1998) Estimation of Q from surface seismic reflection
data. Geophysics 63:2120–2128
Harris PE, Kerner C, White RE (1997) Multichannel estimation of frequency‑ dependent Q from VSP data. Geophys Prospect 45:87–109
Ike T, Moore GF, Kuramoto S, Park JO, Kaneda Y, Taira A (2008) Variations in sedi‑ ment thickness and type along the northern Philippine Sea Plate at the Nankai Trough. Island Arc 17:342–357
Ishii T, Sato H, Machida S, Haraguchi S, Usui A, Ishizuka O, Taniguchi H, Yagi K (2000) Geological and petrological studies of the Kinan and Izu‑Ogasa‑ wara‑back arc‑echelon Seamount Chains. Bull Geol Surv Jpn 51:615–630 (in Japanese with English abstract)
Ito Y, Ito Y, Matsumoto T, Kimura H, Matsubayashi H, Obara K, Sekiguchi S (2005) Spatial distribution of centroid moment tensor solutions for the 2004 off Kii Peninsula earthquakes. Earth Planets Space 57:351–356.
https://doi.org/10.1186/BF03352575
Kattenhorn A, Pollard D (2001) Integrating 3‑D seismic data, field analogs, and mechanical models in the analysis of segmented normal faults in the Wytch Farm oil field, southern England, United Kingdom. AAPG Bull 85:1183–1210
Kido Y, Fujiwara T (2004) Regional variation of magnetization of oceanic crust subducting beneath the Nankai Trough. Geochem Geophys Geosyst.
https://doi.org/10.1029/2003GC000649
Mansfield C, Cartwright J (1996) High resolution fault displacement mapping from three‑dimensional seismic data: evidence for dip linkage during fault growth. J Struct Geol 18:249–263
Mochizuki K, Nakahigashi K, Kuwano A, Yamada T, Shinohara M, Sakai S, Kanaz‑ awa T, Uehira K, Shimizu H (2010) Seismic characteristics around the fault segment boundary of the historical great earthquakes along the Nankai Trough revealed by repeating long‑term OBS observations. Geophys Res Lett 37:L09304
Moore GF, Shipley TH, Stoffa PL, Karig DE, Taira A, Kuramoto S, Tokuyama H, Suyehiro K (1990) Structure of the Nankai Trough accretionary zone from multichannel seismic reflection data. J Geophys Res 95:8753–8765 Nagata K, Nakatani M, Yoshida S (2008) Monitoring frictional strength
with acoustic wave transmission. Geophys Res Lett. https://doi. org/10.1029/2007gl033146
Nakanishi A, Shiobara H, Hino R, Mochizuki K, Sato T, Kasahara J, Takahashi N, Suyehiro K, Tokuyama H, Segawa J, Shinohara M, Shimaharu H (2002) Deep crustal structure of the eastern Nankai trough and Zenisu ridge by dense airgun‑OBS seismic profiling. Mar Geol 187:47–62
Niwa M, Mizuochi Y, Tanase A (2015) Changes in chemical composition caused by water‑rock interactions across a strike‑slip fault zone: case study of the Atera Fault, Central Japan. Geofluids 15:387–409. https://doi.org/10.1111/ gfl.12096
Obana K, Kodaira S, Kaneda Y (2005) Seismicity in the incoming/subducting Philippine Sea plate off the Kii Peninsula, central Nankai trough. J Geo‑ phys Res. https://doi.org/10.1029/2004JB003487
Ogg JG (2012) Geomagnetic polarity time scale. In: Gradstein FM, Ogg JG, Schmitz MD, Ogg GM (eds) The geologic time scale 2012, vol 2. Elsevier, Amsterdam, pp 85–114
Okino K (2015) Magnetic anomalies in the Philippine Sea: implications for regional tectonics. J Geogr 124:729–747 (in Japanese with English abstract)
Park J‑O, Tsuru T, Kodaira S, Cummins PR, Kaneda Y (2002a) Splay fault branch‑ ing along the Nankai subduction zone. Science 297(5584):1157–1160 Park J‑O, Tsuru T, Takahashi N, Hori T, Kodaira S, Nakanishi A, Miura S,
Kaneda Y (2002b) A deep strong reflector in the Nankai accretionary wedge from multichannel seismic data: implications for underplat‑ ing and interseismic shear stress release. J Geophys Res. https://doi. org/10.1029/2001JB000262
Sakai S, Yamada T, Shinohara M, Hagiwara H, Kanazawa T, Obana K, Kodaira S, Kaneda Y (2005) Urgent aftershock observation of the 2004 off the Kii Peninsula Earthquake using ocean bottom seismometers. Earth Planets Space 57:363–368. https://doi.org/10.1186/BF03352577
Sano Y, Hara T, Takahata N, Kawagucci S, Honda M, Nishio Y, Tanikawa W, Hasegawa A, Hattori K (2014) Helium anomalies suggest a fluid pathway from mantle to trench during the 2011 Tohoku‑Oki earthquake. Nat Com‑ mun 5:3084. https://doi.org/10.1038/ncomms4084
Seno T, Stein S, Gripp AE (1993) A model for the motion of the Philippine Sea Plate consistent with NUVEL‑1 and geological data. J Geophys Res 98:17941–17948. https://doi.org/10.1029/93JB00782
Tonn R (1991) The determination of seismic quality factor Q from VSP data: a comparison of different computational methods. Geophys Prospect 39:1–27
Tsuji T, Park JO, Moore G, Kodaira S, Fukao Y, Kuramoto S, Bangs N (2009) Intraoceanic thrusts in the Nankai Trough off the Kii Peninsula: implica‑ tions for intraplate earthquakes. Geophys Res Lett 36:L06303. https://doi. org/10.1029/2008GL036974
Tsuji T, Kodaira S, Ashi A, Park JO (2013) Widely distributed thrust and strike‑slip faults within subducting oceanic crust in the Nankai Trough off the Kii Peninsula, Japan. Tectonophysics 600:52–62. https://doi.org/10.1016/j. tecto.2013.03.014
Tsuji T, Ashi J, Ikeda Y (2014) Strike‑slip motion of a mega‑splay fault system in the Nankai oblique subduction zone. Earth Planets Space. https://doi. org/10.1186/1880‑5981‑66‑120
Tsuru T, Sasaki A, Urabe S (2014) Fault seal evaluation by using attenuation effects of seismic reflection data. J. Jpn Assoc Pet Technol 79:54–62 (in Japanese with English abstract)
Tsuru T, No T, Fujie G (2017) Geophysical imaging of subsurface structures in volcanic area by seismic attenuation profiling. Earth Planets Space.
https://doi.org/10.1186/s40623‑016‑0592‑0
Worthington MH, Hudson JA (2000) Fault properties from seismic Q. Geophys J Int 143:937–944
Yadav RK, Kundu B, Gahalaut K, Catherine J, Gahalaut VK, Ambikapthy A, Naidu MS (2013) Coseismic offsets due to the 11 April 2012 Indian Ocean earthquakes (Mw 8.6 and 8.2) derived from GPS measurements. Geophys Res Lett 40:3389–3393