Experiments in Evaluating
Interactive Spoken Language Systems 1
Joseph Polifroni, Lynette Hirschman, Stephanie Seneff, and Victor Zue
Spoken Language Systems Group
L a b o r a t o r y f o r C o m p u t e r S c i e n c e M a s s a c h u s e t t s I n s t i t u t e o f T e c h n o l o g yC a m b r i d g e , M a s s a c h u s e t t s 0 2 1 3 9
A B S T R A C T
As the DARPA spoken language community moves to- wards developing useful systems for interactive problem solv- ing, we must explore alternative evaluation procedures that measure whether these systems aid people in solving problems within the task domain. In this paper, we describe several experiments exploring new evaluation procedures. To look at end-to-end evaluation, we modified our data collection pro- cedure slightly in order to experiment with several objective task completion measures. We found that the task completion time is well correlated with the number of queries used. We also explored log file evaluation, where evaluators were asked to judge the clarity of the query and the correctness of the re- sponse based on examination of the log file. Our results show that seven evaluators were unanimous on more than 80% of the queries, and that at least 6 out of 7 evaluators agreed over 90% of the time. Finally, we applied these new procedures to compare two systems, one system requiring a complete parse and the other using the more flexible robust parsing mecha- nism. We found that these metrics could distinguish between these systems: there were significant differences in ability to complete the task, number of queries required to complete the task, and score (as computed through a log file evaluation) between the robust and the non-robust modes.
I N T R O D U C T I O N
For the first two years of the D A R P A Spoken Lan- guage P r o g r a m , c o m m o n evaluation in the ATIS d o m a i n has been performed solely with the C o m m o n Answer Specification (CAS) protocol [4], whereby a s y s t e m ' s per- formance is determined by comparing its o u t p u t , ex- pressed as a set of d a t a b a s e tuples, with one or more p r e d e t e r m i n e d reference answers [1]. T h e CAS protocol has the advantage t h a t s y s t e m evaluation can be car- ried out automatically, once the principles for generating the reference answers have been established and a cor- pus has been a n n o t a t e d accordingly. Since direct com- parison across s y s t e m s can be performed relatively easily with this procedure, we have been able to achieve cross fertilization of research ideas, leading to rapid research progress.
1This research was s u p p o r t e d by D A R P A u n d e r Contract N000] 4-89-J-1332, m o n i t o r e d t h r o u g h t h e Office of Naval Research.
28
QUERY 1:
RESPONSE I:
QUERY 2:
RESPONSE 2:
PLEASE LIST THE FLIGHT FROM PITTSBURGH TO BALTIMORE THAT WILL HE MADE BY SIX SEAT AIRPLANE ON JUNE TWENTIETH
There are no flights from p i t t s b u r g h to Baltimore leaving before 6:00 a.m. on Saturday June 20.
LIST THE NUMBER OF FIRST CLASS FLIGHTS AVAILABLE ON DELTA AIRLINES
279
T a b l e 1: Two examples of queries from the February '92 Evaluation for which the CAS evaluation gives a misleading assessment of the system's ability to understand.
However, CAS evaluation is not without its share of shortcomings. One u n f o r t u n a t e outcome of evaluat- ing systems based on answers retrieved f r o m the flight d a t a b a s e is t h a t we cannot separately assess the s y s t e m ' s understanding of the query f r o m its ability to retrieve the correct information and to conform to the prescribed o u t p u t format. In the best case, researchers m a y end up spending a considerable a m o u n t of time worrying a b o u t the f o r m and substance of the answer, which has little to do with language understanding. In the worst case, the results of the evaluation m a y be down right mislead- ing. Consider the two examples f r o m the February 1992 test-set shown in Figure 1. For Q u e r y 1, the s y s t e m misunderstood the phrase "by six" as m e a n i n g "before 6:00 a.m." Nonetheless, the answer is judged correct, because b o t h the hypothesized and reference answers are the N U L L set, i.e., no flights satisfy the set of constraints. For Query 2, the s y s t e m found 279 flights, b u t the cor- rect answer is 278. T h e erroneous e x t r a flight is the one connecting flight in the d a t a b a s e shared by two airlines, Delta and USAIR.
m a n / c o m p u t e r dialogue can vary widely from system to system, it is impossible to use the data collected from one system to evaluate another system without making avail- able the computer's half of the conversation. Even then, the system being tested becomes an observer analyzing two sides of a conversation rather than a participant.
II
Measurements I[ Mean [Std. Dev. I[Total ~ of Queries Used 4.8 1.6
# of Queries with Error Messages 1.0 1.4 Time to Completion (S.) 166.1 66.0
To be sure, the current evaluation protocol has served the community well. The refinements made during the last year have significantly improved its ability to pro- vide an objective benchmark. However, as we continue to press forward in developing
useful
spoken language systems that can help us solve problems, we must cor- respondingly expand the b a t t e r y of evaluation protocols to measure the effectiveness of these systems in accom- plishing specific tasks.At the March 1991 meeting of the SLS Coordinating Committee, a working group was formed with the specific goal of exploring methodologies that will help us evaluate if, and how welt, a spoken language system accomplishes its task in the ATIS domain. The consensus of the work- ing group was that, while we may not have a clear idea about how to evaluate overall system performance, it is appropriate to conduct experiments in order to gain ex- perience. The purpose of this paper is to describe three experiments conducted at MIT over the past few months related to this issue. These experiments explored a num- ber of objective and subjective evaluation metrics, and found some of t h e m to be potentially helpful in deter- mining overall system performance and usefulness.
E N D - T O - E N D
E V A L U A T I O N
In order to carry out end-to-end evaluation, i.e., eval- uation of overall task completion effectiveness, we must be able to determine precisely the task being solved, the correct answer(s), and when t h e s u b j e c t is done. Once these factors have been specified, we can then compute some candidate measures and see if any of t h e m are appropriate for characterizing end-to-end system perfor- mance.While true measures of system performance will re- quire a (near) real-time spoken language system, we felt that some preliminary experiments could be conducted within the context of our ATIS data collection effort [3,2]. In our data collection paradigm, a typist types in the subject's queries verbatim, after removing disfluencies. All subsequent processing is done automatically by the system. To collect d a t a for end-to-end evaluation, we modified our standard data collection procedure slightly, by adding a specific scenario which has a unique answer. For this scenario, the subjects were asked to report the answer explicitly.
As a preliminary experiment, we used two simple sce- narios. In one of them, subjects were asked to determine
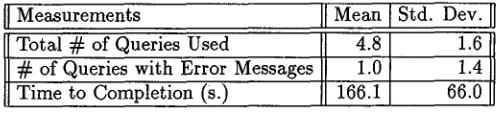
Table 2: Objective end-to-end measures.
the type of aircraft used on a flight from Philadelphia to Denver that makes a stop in Atlanta and serves break- fast. Subjects were asked to end the scenario by saying "End scenario. The answer is" followed by a statement of the answer, e.g., "End scenario. T h e answer is Boe- ing 727." From the log files associated with the session scenario, we computed a number of objective measures, including the success of task completion, task completion time, the number of successful and the number of unsuc- cessful queries (producing a "no answer" message) 2.
We collected d a t a from 29 subjects and analyzed the data from 24 subjects 3. All subjects were able to com- plete the task, and statistics on some of the objective measures are shown in Table 2.
Figure 1 displays scatter plots of the number of queries used by each subject as a function of the task completion time. A least-square fit of the d a t a is superimposed. The number of queries used is well correlated with the task completion time (R = 0.84), suggesting that this measure may be appropriate for quantifying the usefulness of sys- tems, at least within the context of our experiment. Also plotted are the number of queries that generated a "no answer" message. The correlation of this measure with task completion time is not as good (R = 0.66), possibly due to subjects' different problem solving strategies and abilities.
L O G F I L E E V A L U A T I O N
We also conducted a different set of experiments to explore subject-based evaluation metrics. Specifically, we extracted from the log files pairs of subject queries and system responses in sequence, and asked evaluators to judge the clarity of the query (i.e., clear, unclear, or un- intelligible) and the correctness of the response (correct, partially correct, incorrect, or "system generated an error message"). A program was written to enable evaluators to enter their answers on-line, and the results were tab- ulated automatically. We used seven evaluators for this experiment, all people from within our group. Four peo- ple had detailed knowledge of the system and the desig-2 T h e s y s t e m g e n e r a t e s a r a n g e of diagnostic m e s s a g e s , r e p o r t i n g t h a t it c a n n o t parse, or t h a t it c a n n o t f o r m u l a t e a retrieval query, etc.
[image:2.612.318.566.63.120.2]1 0 '
2,
• # o f q u e r i e s •
n # o f e r r o r m e s s a g e s
• lid • •
@11 []
• f ' . : . .
i 0 0 2 0 0 3 0 0 4 0 0
T i m e t o C o m p l e t i o n
F i g u r e 1: Relationship beween task completion time and the total number of queries used, and the number of queries that generated a "no answer" message.
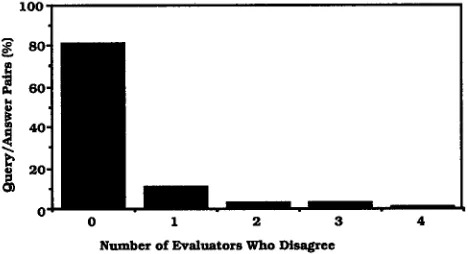
nated correct reference answers. Three of the evaluators were familiar with the ATIS system capabilities, but did not have a detailed knowledge of what constituted a cor- rect reference answer for the comparator. Our anedyses, based on d a t a from 7 evaluators, indicate that 82% of the time there was unanimous agreement among the evalua- tors, and there were 1 or fewer disagreements 92% of the time.
ii!
A2°:
0 I 2 3 4
N u m b e r o f E v a l u a t o r s W h o D i s a g r e e
F i g u r e 2: Consistency of the 7 evaluators' answers during log file evaluation. The data are based on 115 query/answer pairs.
These results suggest t h a t reasonable agreement is possible using humans to evaluate log files. Such on-line evaluation is also quite cost effective; the evaluators were each able to check the 115 query/answer pairs in 30-45 minutes.
S Y S T E M C O M P A R I S O N
E X P E R I M E N T
Building on the results of the pilot experiments on end-to-end and log file evaluation, we designed an exper- iment to test whether these metrics would be useful in distinguishing the performance of two systems on a more complex set of tasks.
E x p e r i m e n t a l D e s i g n
We decided to compare the performance of two M I T systems: the "full parse" system and the "robust parse" system [5]. These two systems contrast a conservative approach that only answers when it is confident (the full parse system) against a more aggressive approach t h a t is willing to make mistakes by answering much more often, based on partial understanding (the robust parse sys- tem). These systems had very measurably different per- formance in terms of the CAS metric, and our hypothesis was t h a t the metrics would show t h a t the robust-parsing system outperformed the full-parsing system. To try to capture a broader range of user behavior, we decided to vary the difficulty of the scenarios; we used two pairs of scenarios, where each pair consist of an "easy" scenario followed by a "hard" scenario. T h e scenarios were chosen to have a single correct answer. T h e easy scenarios were scenarios adapted from our previous d a t a collection and could be solved with around three queries. T h e more dif- ficult scenarios were constructed to require more queries (10-15) to solve them. T h e four scenarios are shown in Table 3.
T h e experiment used a within-subject design, with each subject using b o t h systems. In order to neutral- ize the effects of the individual scenarios and the order of scenarios, all subjects were presented with the same scenarios, in the same order. We alternated sessions in which the robust parser was used for scenarios one and two with sessions in which the robust parser was used for scenarios three and four. Subjects were given no prior training or warm-up exercises.
As of this writing, we have collected d a t a from fifteen subjects. Eight of these subjects used a version of the system with the robust parser t u r n e d on for the first two scenarios and turned off for the second two; seven used the opposite configuration of full-parsing followed by ro- bust parsing. All but two of the subjects had not used the system before.
We used our standard subject instructions, slightly modified to inform the subject that s/he would be us- ing two distinct systems. T h e subjects were drawn from the same pool as in our previous d a t a collection efforts, namely M I T students and Staff. Each subject was given a $10 gift certificate for a local store. T h e subjects were not given any special incentive for getting correct answers, nor were they told t h a t they would be timed. Each sub- ject was asked to fill out a version of our debriefing ques- tionnaire, slightly modified to include a specific question asking the subject which system s/he had preferred.
[image:3.612.64.307.49.187.2] [image:3.612.65.299.375.502.2]1. Find a flight from Philadelphia to Dallas that makes a stop in Atlanta. The flight should serve breakfast. Identify the type of aircraft that is used on the flight to Dallas. (Information requested: aircraft type)
2. You want to fly from Boston to San Francisco on the last weekend in April (Saturday, April 25 or Sunday, April 26). You'd like to return to Boston on the following Wednesday in the evening, if possible. Your main concern is that all flights be on Continental since you are trying to maximize your frequent flyer miles. Identify one flight in each direction (by number) that you can take. (Information requested: flight number)
3. Find a flight from Atlanta to Baltimore. The flight should be on a Boeing 757 and arrive around 7:00 P.M. Identify the flight (by number) and what meal is served on this flight. (Information requested: flight number, meal type)
4. You live in Pittsburgh. You want to combine a vacation trip to Atlanta with business and take a friend along. You will receive a fixed travel allowance, based on a first-class ticket. Identify a coach class fare (dollar amount) that comes closest to allowing you to cover the expenses of both you and your friend based on the regular first class fare. Choose a date within the next seven days and make sure the fare does not have a restriction that disallows this. (Information requested: fare amount (in dollars) for coach class fare)
Table 3: The four scenarios used by subjects in the second MIT end-to-end experiment.
kind of answer they should provide, subjects did not al- ways read or follow the scenarios carefully. We wanted to avoid prompting the subjects with phrases that we knew the system understood. We therefore tried to word the scenarios in such a way that subjects would not be able to read from their instructions verbatim and ob- tain a response from the system. We also wanted to see what problem-solving strategies subjects would use when various options were presented to them, only one of which could solve their scenario. In Scenario 2, for ex- ample, there are no Continental flights on the Saturday or Wednesday evening in question. There are, however, Continental flights on Sunday and on Wednesday during the day.
R e s u l t s a n d A n a l y s e s
From the collected data, we made a number of mea- surements for each scenario, and examined how the two systems differed in terms of these measures. The mea- surements that we computed are:
• Scenario completion time; • Existence of a reported solution; • Correctness of the reported solution; • Number of queries;
• Number of queries answered; number resulting in a "no answer" message from the system;
• Logfile evaluation metrics, including queries judged to be correctly answered, incorrectly answered, par- tially correct, and out of domain(class X); also score, defined as % Correct - % Incorrect;
• User satisfaction from debriefing questionnaire.
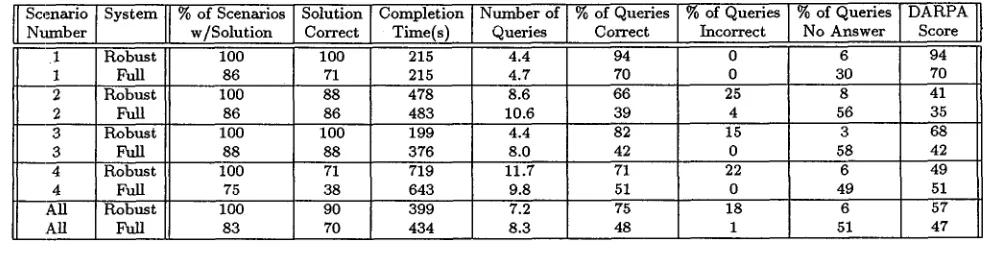
Table 4 summarizes some of the results comparing the two systems across all scenarios. For the remainder of this section, we will try to analyze these results and reach some tentative conclusions.
31
Task Completion The first column of Table 4 shows that the subjects were able to provide an answer in allthe
scenarios when the system was in robust mode, whereas only 83% of the scenarios were completed in non-robust mode. Interestingly, a detailed examination of the data shows that, for the 5 cases in the non-robust mode when users gave up, there was never an incorrectly answered query, but the number of unanswered queries was ex- tremely high. From a problem-solving standpoint, we can tentatively conclude that a system that takes chances and answers more queries seems to be more successful than a more conservative one.
Finding the Correct Solution Our experimental pa- radigm allowed us to determine automatically, by pro- cessing the log files, whether the subject solved the sce- nario correctly, incorrectly, or not at all. A much larger percentage of the scenarios were correctly answered with the robust system than with the non-robust system (90% vs. 70%). Measured in terms of the percent of scenar- ios correctly solved, the robust system outperformed the non-robust system in all scenarios.
[
Scenario System % of Scenarios Solution [ Completion Number w/Solution Correct [ Time(s)1 Robust 100 100
1 Full 86 71
2 Robust 100 88
2 Full 86 86
3 Robust 100 100
3 Full 88 88
4 Robust 100 71
4 Full 75 38
All Robust 100 90
ALl FuU 83 70
Number of
Queries
% of Queries
Correct
% of Queries
Incorrect
215 4.4 94 0
215 4.7 70 0
478 8.6 66 25
483 10.6 39 4
199 4.4 82 15
376 8.0 42 0
719 11.7 71 22
643 9.8 51 0
399 434
75 48 7.2
8.3
18 1
% of Queries ] DARPA No Answer ] Score
6 94
30 70
8 41
56 35
3 68
58 42
6 49
49 51
6 57
51 47
T a b l e 4: Mean metrics for robust and full parse systems, shown by scenario
in these experiments.
T h e next column of the same table shows the average n u m b e r of queries for each scenario. Since these numbers a p p e a r to be well correlated with task completion time, they suffer f r o m some of the same deficiencies.
Log File Score In order to measure the n u m b e r of queries correctly answered by the system, two s y s t e m de- velopers independently examined each q u e r y / a n s w e r pair and judged the answer as correct, partially correct, incor- rect, or unanswered, based on the evaluation p r o g r a m de- veloped for the logfile evaluation. T h e s y s t e m developers were in complete agreement 92% of the time. T h e cases of disagreement were examined to reach a compromise rating. This provided a quick and reasonably accurate way to assess whether the subjects received the informa- tion they asked for. T h e percentages of queries correctly answered, incorrectly answered, and unanswered, and the resulting D A R P A score (i.e., % correct - % incorrect) are shown in the last four columns of Table 4.
Although not shown in Table 4, the overall ratio of correctly answered queries to those producing no an- swer was an order of m a g n i t u d e higher for the robust parser (148:13) t h a n for the non-robust parser (118:125). This was associated with an order-of-magnitude increase in the n u m b e r of incorrect answers: 32 vs. 3 for the non-robust parser. However, the percentage of "no an- swer" queries seemed to be more critical in determining whether a subject succeeded with a scenario t h a n the percentage of incorrect queries.
Debriefing Questionnaire Each subject received a de- briefing questionnaire, which included a question asking for a comparison of the two systems used. Unfortunately, d a t a were not obtained from the first five subjects. O f the ten subjects t h a t responded, five preferred the ro- bust system, one preferred the non-robust system, and the remaining ones expressed no preference.
Difficulty of Scenarios T h e r e was considerable vari- ability a m o n g the scenarios in terms of difficulty. Sce- nario 4 turned out to be by far the most difficult one to
32
solve, with only a little over half of the sessions being successfully completed 4. Subjects were asked to "choose a date within the next week" and to be sure t h a t the restrictions on their fare were acceptable. We intention- ally did not expand the s y s t e m to u n d e r s t a n d the phrase "within the next week" to m e a n "no seven-day advance purchase requirement," b u t instead required the user to determine t h a t information t h r o u g h some other means. Also in Scenario 4, there were no available first class fares t h a t would exactly cover two coach class fares. Scenarios 2 and 4 were intended to be more difficult t h a n 1 and 3, and indeed they collectively had a substantially lower percentage of correct query answers t h a n the other two scenarios, reflecting the fact t h a t subjects were groping for ways to ask for information t h a t the s y s t e m would be able to interpret.
T h e r e was a wide variation across subjects in their ability to solve a given scenario, and in fact, subjects de- viated substantially f r o m our expectations. Several sub- jects did not read the instructions carefully and ignored or misinterpreted key restrictions in the scenario. For in- stance, one subject t h o u g h t the "within the next week" requirement in Scenario 4 m e a n t t h a t he should return
within a week of his departure. Some subjects had a weak knowledge of air travel; one subject assumed t h a t the return trip would be on the same flight as the forward leg, an assumption which caused considerable confusion for the system.
T h e full parser and robust parser showed different strengths and weaknesses in specific scenarios. For ex- ample, in Scenario 3, the full parser often could not parse the expression "Boeing 757", b u t the robust parser had no trouble. This accounts in p a r t for the large "win" of the robust parser in this scenario. Conversely, in Sce- nario 4, the robust parser misinterpreted expressions of the t y p e " a b o u t two hundred dollars", treating " a b o u t two" as a time expression. This led the conversation badly astray in these cases, and p e r h a p s accounts for the
[image:5.612.62.563.47.175.2]fact that subjects took more time solving the scenario in robust mode. The lesson here is that different scenarios may find different holes in the systems under compari- son, thus making the comparison extremely sensitive to the exact choice and wording of the scenarios.
Performance Comparison The robust parser performed better than the non-robust parser on all measures for all scenarios except in Scenario 4. In Scenario 4, the per- centage of sessions resulting in a correct solution favored robust parsing by a large margin (71% vs. 38%), but the robust parser had a longer time to completion and more queries to completion than the non-robust system, as well as a worse DARPA score (51% to 49%). The ro- bust parser gave a greater percentage of correct answers (71% vs. 51%), but its incorrect answers were signif- icant enough (22% to 0%) to reverse the outcome for the DARPA score. Thus DARPA score seems to be cor- related with time to completion, but percent of correct answers seems to be correlated with getting a correct so- lution.
We feel that the d a t a for Scenario 4, when used t o make comparisons between the robust and non-robust parser, are anomalous for several reasons. The scenario itself confused subjects, some of whom incorrectly as- sumed that the correct fare was one which was exactly
one-half of the first class fare. Furthermore, fare restric- tions are not as familiar to subjects as we previously as- sumed, leading to lengthy interactions with the system. These difficulties led to differences in performance across systems that we feel are not necessarily linked directly to the systems themselves but rather to the nature of the scenario being solved. In summary, our data show the following salient trends:
1. Subjects were always able to complete the scenario for the robust system.
2. Successful task completion distinguished the two systems: full parse system succeeded 70% of the time, compared with 90% for the robust system. 3. Percent of correctly answered queries followed the
same trend as completion time and number of over- all queries; these may provide a rough measure of task difficulty.
4. Scores for the performance on individual queries were not necessarily consistent with overall success in solving the problem.
5. Users expressed a preference for the robust system.
CONCLUSIONS
The results of these experiments are very encourag- ing. We believe that it is possible to define metrics that measure the performance of interactive systems in the context of interactive problem solving. We have had con- siderable success in designing end-to-end task completion tests. We have shown that it is possible to design such scenarios, that the subjects can successfully perform the
designated task in most cases, and that we can define ob- jective metrics, including time to task completion, num- ber of queries, and number of system non-responses. In addition, these metrics appear to be correlated. To as- sess correctness of system response, we have shown that evaluators can produce b e t t e r than 90% agreement eval- uating the correctness of response based on examination of query/answer pairs from the log file. We have im- plemented an interactive tool to support this evaluation, and have used it in two separate experiments. Finally, we demonstrated the utility of these metrics in charac- terizing two systems. T h e r e was good correspondence between how effective the system was in helping the user arrive at a correct answer for a given task, and metrics such as time to task completion, number of queries, and percent of correctly answered queries (based on log file evaluation). These metrics also indicated that system behavior may not be uniform over a range of scenarios - the robust parsing system performed b e t t e r on three scenarios, but had a worse DARPA score on the fourth (and probably most difficult) scenario. Based on these experiments, we believe that these metrics provide the basis for evaluating spoken language systems in a realis- tic interactive problem solving context.
A C K N O W L E D G E M E N T S
.~Ve would like to thank several people who made sig- nificant contributions to this work. David Goodine de- signed and implemented the interactive log file evalua- tion interface which greatly facilitated running the log file evaluation experiments. Christie Winterton recruited the subjects for the various data collection experiments and served as the wizard/transcriber for many of the sub- jects in our end-to-end evaluation experiment. We would also like to thank Nancy Daly, James Glass, Rob Kassel and Victoria Palay for serving as evaluators in the log file evaluation.
R E F E R E N C E S
[1] Bates, M., Boisen, S., and Makhoul, J., "Developing an Evaluation Methodology for Spoken Language Systems,"
Proc. DARPA Speech and Natural Language Workshop,
pp. 102-108, June, 1990.
[2] MADCOW, "Multi-Site Data Collection for a Spoken Language Corpus," MADCOW, These Proceedings.
[3] Polifroni, J. Seneff, S., and Zue, V., "Collection of Spontaneous Speech for the sc Atis Domain and Com- parative Analyses of Data Collected at MIT and TI,"
Proc. DARPA Speech and Natural Language Workshop,
pp.360-365, February 1991.
[4] Ramshaw, L. A. and S. Boisen, "An SLS Answer Com- parator," SLS Note 7, BBN Systems and Technologies Corporation, Cambridge, MA, May 1990.