Abstract—Curved trajectories of traditional navigation satellites limit their performance in bistatic radar imaging system. Instead of using common Inclined Geosynchronous Orbit (IGSO)/Medium Earth Orbit (MEO) satellites in motion, a new global navigation satellite system (GNSS) imaging system based on Beidou geo synchronous orbit (GEO) satellites is presented to deal with this problem. The most prominent feature of GEO satellites is that they are still relative to the earth. This work includes three parts. First, a reasonable parallel assumption is provided to simplify the geometric topology of the imaging system, and the relevant path delay formula is deduced. Second, the principle of imaging based on multiple GEO satellites is proposed, and the simulation result is presented. Third, the entire signal processing, which uses a multi-correlator, is designed to improve the range resolution. Two imaging experiments targeting at the trees are described and conducted in Wuhan University to verify the imaging system. The first experiment is targeted at isolated trees, and the second experiment is focused on groves along the road. Conclusion can be obtained: the imaging result is highly consistent with the imaging area, which validates the feasibility of the method and confirms the potential use of GNSS imaging system in forest monitoring.
1. INTRODUCTION
Over the last few years, the imaging capability of space-surface bistatic radar has been studied in depth by different research groups. For instance, the synthetic-aperture radar (SAR) image based on TerraSAR-X was obtained with fixed receiver in 2016 [1], and the elevation pattern of passive bistatic radar was analyzed [2]. Besides, a resolution enhancement method has been proposed for bistatic imaging in burst-mode [3]. In this radar’s configuration, the transmitter is located on the satellites, and the receiver can be set upon an aircraft, a ground moving vehicle, or fixed on the ground. In addition to traditional dedicated SAR radar satellites, communication satellites [4], TV station [5], or Global Navigation Satellite System (GNSS) [6] can also be transmitters of opportunity. For example, using navigation satellites as transmitter has advantages in power budget and global and permanent coverage. In addition, GNSS is designed to ensure that at least four to six satellites illuminate every point on earth from different angles, and hence the imaging results formed from different satellites can be used for image fusion to provide more information.
The researchers from the University of Birmingham first proposed the concept of GNSS-BSAR (Bistatic SAR) system and conducted experiments using global navigational satellite system (GLONASS) to obtain remote sensing imaging results [7]. They also studied the feasibility of improving range resolution by joint Galileo E5 signals [8], multistatic acquisitions and feature extraction [9–11]. In addition, they discussed spatial decorrelation in GNSS-based SAR coherent change detection [12] and performed coherent change detection experiments [13]. Other research teams including Beihang
Received 25 March 2018, Accepted 6 June 2018, Scheduled 18 June 2018
* Corresponding author: Songhua Yan ([email protected]).
1 School of Electronic Information, Wuhan University, Wuhan, China. 2 State Key Laboratory of Information Engineering in
University, Collaborative Innovation Center of Geospatial Technology, University of Sheffield and University of New South Wales proposed a new imaging algorithm for GNSS-based bistatic SAR, which relies on the point target spectrum model of the echo and makes the echo data focused more accurately and efficiently [14]. The research team from the Beijing Institute of Technology conducted imaging experiments based on Beidou Medium Earth Orbit (MEO) satellites [15, 16] to detect corner reflector and transponder with strong scattering coefficients. They also proposed repeat-pass coherent fusion for image enhancement [17] and carried out experiments for China railway High-Speed (CRH) railway bridge imaging based on IGSO satellites, and besides, a new platform for larger scene images has been undergoing construction [18].
In these studies, in order to use the trajectories of the navigation satellites to form a long synthetic aperture, the navigation satellites in motion were employed, and their civil signals, e.g., GPS L1 signals, were used as radar wave sources, which has gained the effect. However, there still exist some major difficulties in the GNSS imaging studies. Firstly, low range resolution, which depends on the transmitted signal bandwidth, has become a fundamental bottleneck. When GLONASS P code (bandwidth, 5.11 MHz) is applied, the corresponding range resolution is 30 m. For GPS, the bandwidth of C/A code is 1.023 MHz [19] which leads to the range resolution of 150 m. Although the bandwidth of GPS P code can reach 10.23 MHz, the encoding rules of GPS P code are not open to the public, thereby limiting the application of GPS P code in scientific research. Secondly, traditional imaging formation algorithms based on the hypotheses of linear transmitter trajectories and equal platform velocities are not applicable because navigation satellites have nonlinear trajectories in the long coherent accumulation time [20]. Thirdly, in the traditional imaging geometrical model, the posterior ephemeris data or broadcast ephemeris is required to calculate the position of the satellite before the calculation of path delay. However, the posterior ephemeris can be only published 7 days after the experiment is conducted, and the broadcast ephemeris requires additional calculation resources.
New satellite constellations, such as Beidou system in China, QZSS in Japan, and IRNSS in India, provide opportunity to overcome above bottlenecks. The novelty of this paper lies in two aspects. On the one hand, long and stable dwell time is ensured in the algorithm, because five GEO satellites (named BDS C01 to C05) in Beidou system are applied as illuminators. Since GEO satellites are relatively still to the earth surface, illuminating area remains unchanged during sampling time; therefore, dwell time can be long and stable without considering about motion compensation. On the other hand, parallel assumption is adopted in this paper to simplify the algorithm. For the reason that GEO satellites are in high orbit of 36000 km, parallel assumption also known as far-field assumption is reasonable, and this assumption simplifies the geometric model of imaging system which makes the accurate position of satellites unnecessary in calculating path delay. Besides two aspects mentioned above, in order to obtain high range resolution, the Beidou B3 code, which has wide bandwidth (10.23 MHz), is applied in our experiments. In addition, multi-correlator [21] and high sampling rate are employed to ensure that the range resolution can be further improved.
This paper is organized as follows. In Section 2, the imaging model and relevant synchronization methods are presented and deduced. In Section 3, GNSS imaging experiments using multiple GEO satellites as illuminators are described. In Section 4, path delay errors are analyzed, and the algorithm is promoted to the IGSO satellites. The conclusion and future works are presented in Section 5.
2. IMAGE ALGORITHM BASED ON MULTIPLE GEO SATELLITES
2.1. Geometric Topology of GEO Imaging System and Range Equal Delay Arc
Figure 1 shows the basic topology of GEO imaging system including GEO satellite as transmitter, receiver on the ground, and imaging area. The receiver consists of a direct antenna and a reflected antenna. The direct antenna is a Right-Hand Circular Polarization (RHCP) microstrip antenna and used to receive direct signal. The reflected antenna is a special designed Left-Hand Circular Polarization (LHCP) spiral antenna with high gain of nearly 37 dB to receive the weak reflected signal.
Figure 1. Topology of GEO imaging system.
ionosphere should be the same for the direct and reflected signals because they pass through the same section of the ionosphere.
Measuring the reflected signal strength is discussed in Section 2.3. Here the math function between the position of the target and path delay of the reflected signal is discussed first.
A space coordinate system withO as origin is set up to describe the relationship among the receiver, satellite and imaging area. Itsx-axis andy-axis point to the east and north, respectively, and the ground imaging area is divided into grids with resolution of 1×1 m2 based on the coordinate.
Both direct and reflected antennas are located at B with height of h from the ground, marked by B (xR, yR, h), and the target with large Radar-Cross Section (RCS) is located at P(x, y,0). Taking C05 as the illuminator, based on this parallel assumption, a vertical line is first drawn from point B normal to the incident signal, and the foot of perpendicular is point A. Then, the propagation path of the direct signal can be represented as RB, and the propagation path of the reflected signal can be divided into three parts, namely,RB,RT (line segment AP), andRR(line segment BP), hence the path delay Rd(x, y) between the direct and reflected signals can be presented as the sum of RT(x, y) and
RR(x, y), as follows:
Rd(x, y) =RR(x, y) +RT(x, y) (1) whereRR(x, y) is the distance between the receiver and the target, andRT(x, y) is the distance between the foot of perpendicular A and the receiver. Therefore,Rd(x, y) can be further formulated as:
Rd(x, y) = (Lcos(θ) cos(ψ) +hsin(θ) +
h2+L2 (2)
where (3)
L=(x−xR)2+ (y−yR)2 (4)
ψ=φ−180−actg((x−xR)/(y−yR)) (5) whereLdenotes the projection ofRRinx-yplane, andψrepresents the projection of the bistatic angle inx-y plane. φis the azimuth of C05, and θis the elevation.
For a fixed receiver, the elevation and azimuth of the GEO satellite can be treated as constants in the experiments. For example, the elevation and azimuth of five GEO satellites in the Wuhan area are listed in Table 1, and more details about these two parameters are discussed in Section 4.1.
For a fixed receiver and the GEO satellite with fixed azimuth and elevation, formula (2) shows that a certain number of grids have the same path delay. Therefore, the grids that satisfy the given path delayRd0 calculated in Section 2.3 will form an arc (thick solid line in Fig. 1) in the imaging area. This
arc is called range equal delay arc, and the target is along the arc. In order to obtain unique solution
Table 1. Azimuth and elevation of GEO satellites in Wuhan.
GEO Satellites Azimuth Elevation
C01 137◦ 43◦
C02 232◦ 37◦
C03 188◦ 54◦
C04 117◦ 28◦
C05 251◦ 21◦
required to locate the target along the range equal delay arc. For example, two or more arcs intersect each other at one point, and this point is the target.
2.2. Keytechnology-1: Imaging by Multiple Range Equal Delay Arcs
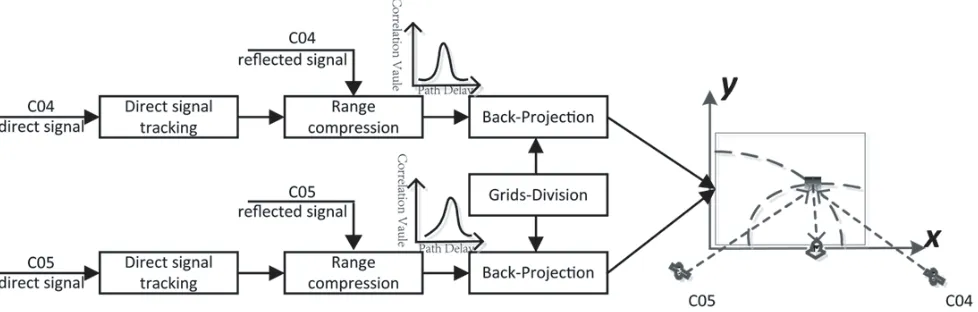
The flowchart of the imaging algorithm using multiple GEO satellites is shown in Fig. 2, which demonstrates the determination of target in the imaging area. Taking C04 and C05 as an example:
Figure 2. Flowchart of imaging by multiple GEO satellites.
Considering the satellite C04, the direct and reflected signals are respectively received by direct antenna and reflected antenna. The signal tracking module is used to extract the code phase, carrier phase, and navigation messages in the direct signal. Then, parameters including the code phase and carrier phase are used for the range compression of the reflected signal to obtain correlation curve, and navigation messages are applied to demodulate reflected signal, which can extend the coherent accumulation time of correlation curve. After that, the correlation curves are back-projected to the imaging area to obtain range equal delay arc. For C05, the same procedures are executed. The right portion of Fig. 2 shows that the intersection point of the multiple arcs can achieve a sharp peak, which enables the determination of the target.
The back-projection module focuses on mapping the correlation curve onto the imaging area. In this process, interpolation is applied to the correlation curve for higher resolution, which can be done by zero-padding in frequency domain; then, the curve is back-projected to the imaging area based on formula (2).
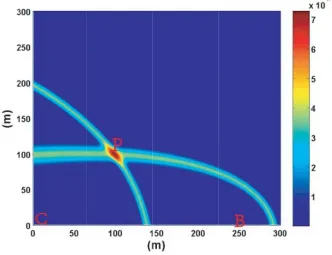
A simulation experiment is conducted to verify this algorithm. In the simulation, C04 and C05 are applied as illuminators, and the imaging area measures 300×300 m2. The receiver is set at B (250, 0, and 15), and the target is located at P (100, 100, and 0).
(a) (b)
Figure 3. Simulation results of GEO imaging with C05 (azimuth = 251◦, elevation = 21◦) and C04 (azimuth = 116◦, elevation = 28◦). (a) Correction curves of C05 and C04. (b) Imaging result by C05 and C04.
intensity. The peak of red (dash-dotted) line is the path delay of C05, which is RdC05 = 87.9 m, and
the peak of blue (solid) line represents the path delay of C04, which isRdC04= 345.7 m. After the path
delay RdC04 and RdC05 are back-projected to imaging area according to Formula (2), and a sharp peak
appears at the location P.
An alternative way to determine the target instead of using multiple GEO satellites is to add collection locations of the receiver. Fig. 4 shows the simulation result by collecting C05 signal at different locations B (250, 0, and 15) and C (0, 0, and 15). It can be seen that the effect of this method is the same as Fig. 3(b). Hence, both multiple satellites and multiple collection locations are applied in the experiment part.
2.3. Keytechnology-2: Matched Filtering for Range Processing
Based on radar signal processing principles [22], matched filtering is an effective method to obtain distance spectrum. Since the correlation curve from range compressing module can be seen as distance spectrum, matched filtering is adopted for range processing in this paper.
As discussed in Section 2.1, the path delay of the direct signal is related toRB, and the path delay of the reflected signal from the target is related to the sum ofRB,RT and RR.
Considering the errors from receiver artifacts and ionospheric propagation, the direct signalSD(t) can be written as:
SD(t) =p{t−[RB/c+teR+teion]}exp{−j[2πRB/λ+ϕeR+ϕeion]} (6)
where p(t) is the envelope of the transmitted signal, c the speed of light, λ the wavelength, and RB the distance between the GEO satellite and the receiver. teR and ϕeR are the time and phase delay
errors due to receiver artifacts respectively; teion and ϕeion are time and phase delay errors resulting
from ionospheric propagation.
The reflected signalSR(t) can be written as:
SR(t) =
xy
σ(x, y)p{t−[(RB+RT(x, y) +RR(x, y))/c+teR+teion]}
exp{−j[2π(RB+RT(x, y) +RR(x, y))/λ+ϕeR +ϕeion]}dxdy
(7)
where RR(x, y) is the distance between the receiver and target, and RT(x, y) is the distance between the foot of perpendicular A and receiver.
Since direct and reflected signals are collected under the same sampling clock, and both of them pass through the same section of ionosphere, errors tracked during direct signal synchronization can be used to compensate errors in the reflected signal.
After matched filtering has been conducted on the reflected signal with the direct signal as reference, the correlation curve Λ(t) can be modeled, as follows:
Λ(t) =SD(t)⊗SR(t) =
xy
ρx[t−Rd(x, y)/c] exp{−j2πRd(x, y)/λ}dxdy (8)
where ρx(t) = p(t)⊗p(t). In other words, ρx(t) is the auto-correlation function of the transmitted signal. Λ(t) suggests that RB and errors are offset during range compression process. The time and phase delay in Λ(t) are solely related to the path delayRd. Thus, calculatingRB based on the positions of satellites and receiver is unnecessary in the condition of parallel assumption.
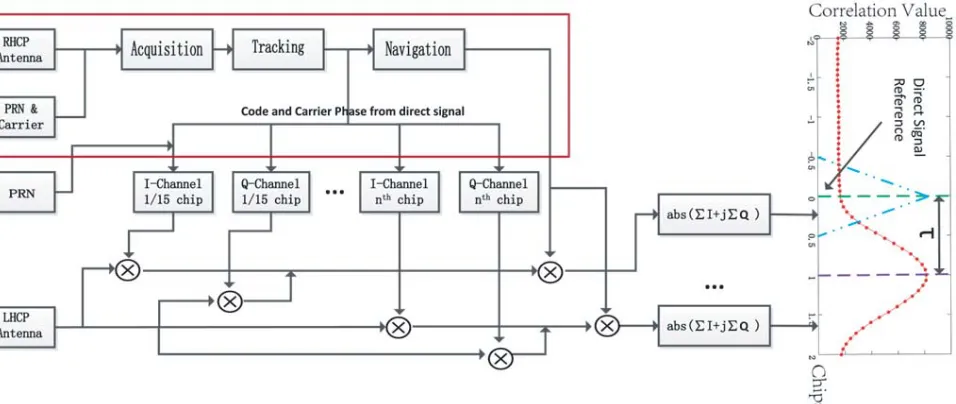
According to this principle, a detailed processing block consisting two parts is presented in Fig. 5. The first part includes the tracking channel of the direct signal with acquisition and tracking function. Half chip interval, instead of multi-correlator, is applied to accelerate the acquirement of the accurate code phase, carrier phase, and navigation message. All these parameters are used to demodulate the reflected signal.
The second part focuses on the processing of the reflected signal. A multi-correlator method is adopted to demodulate the reflected signal based on the carrier phase and code phase extracted from the direct signal. The reflected signal is mixed with quadrature n groups of different code phase chip sequences that are generated at 1/15 chip phase difference (1.953 m). After the navigation message on the reflected signal has been removed, and the corresponding correlation curve can be obtained on the right section of Fig. 5. The blue (dash-dotted) line is the correlation curve of direct signal, which is applied as reference, and the red (dotted) line is the correlation curve of the reflected signal. As can be seen, τ in Fig. 5 represents the chip delay between direct and reflected signals, and this correlation curve is the same as Fig. 3(a) by adjusting x-axis from chips to path delay (1 chip = 30 m).
After the range compression, the imaging area is divided into grids, and zero-padding is applied to Λ(t) in frequency domain. Based on formula (2), Λ(t) is back-projected to imaging area, and the phase in Λ(t) should be removed by multiplying compensation factor exp{j2πRd(x, y)/λ} to enable long and stable coherent accumulation. The final image can be obtained, as follow:
Figure 5. Whole signal processing block diagram.
(1) Applying wide bandwidth signal: the B3 signal with bandwidth of 10.23 MHz is adopted because its theoretical resolution is 15 m, which is higher than that of B1 and B2.
(2) Employing high sampling clock: In the present study, the 62 MHz sampling clock is used to acquire data, indicating that each code sample corresponds to 5 m. Compared with the 19.2 MHz sampling clock in [23], the receiver accuracy increases by more than three times.
(3) Utilizing fine correlation interval: multi-correlator with 1/15 chip difference has been applied to improve the resolution further.
(4) Extending coherent accumulation time: Fig. 6 shows the improvement of amplitude gain by extending the coherent accumulation time. Fig. 6(a) shows the correlation result from 1000 times of non-coherent accumulation of 1 ms coherent accumulation, and Fig. 6(b) shows the correlation result from a total of 1 s coherent accumulation time. The amplitude gain has been greatly improved, and more targets marked by the red circle have been detected during this process.
(a) (b)
3. EXPERIMENTS 3.1. Tree Detection
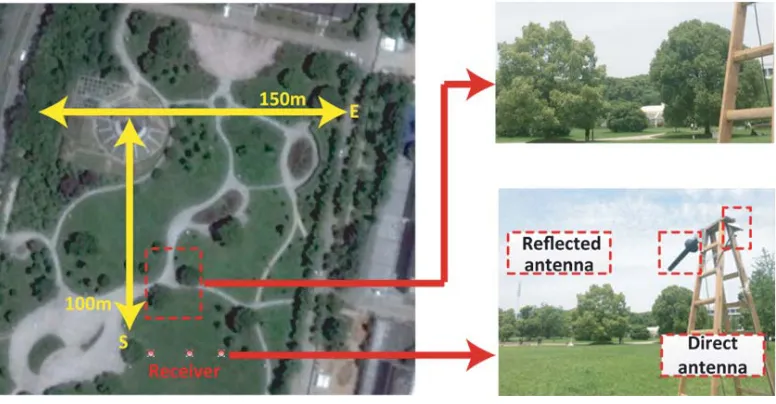
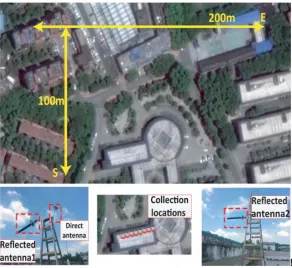
The first experiment was carried out on a square in Wuhan University. As can be seen in Fig. 7, the entire imaging area measured 150×100 m2, and the receiver was located at the south of the imaging area with the reflected antenna pointing to the north. Three different places marked by the red dots were selected as the locations of the receiver to obtain multiple range equal delay arcs from different bistatic angles. There are several separate trees in the imaging area; the major targets are two of them in front of the receiver, and the maximum width and height were approximately 10 and 13 meters, respectively. Consequently, it is convenient to verify the possibility of detecting the trees by GNSS signal.
Figure 7. Experiment scene on the square.
The experimental parameters are listed in Table 2. A multi-channel receiver is developed for the GNSS imaging system; all channels have the same physical design and share the same sampling clock of 62 MHz. Two channels were used to collect the direct and reflected signals separately. The reflected antenna was used to receive the reflected signal, and the direct antenna was used for direct signal collection. Since the signal of C05 was obstructed at that time, C01–C04 satellites were applied as illuminators in the experiment, and the accumulation time for each collection location was 30 seconds to improve SNR.
Considering delay errors between two channels of the receiver caused by the phase pattern of
Table 2. Experimental parameters.
Parameter Value
Transmitting satellites C01 C02 C03 C04 Satellites signal B3
Carrier frequency 1268.52 MHz Signal bandwidth 20.46 MHz Accumulation time 30 s Collection locations 3
(a) (b)
Figure 8. GEO imaging result. (a) Google Maps photograph of imaging area. (b) Imaging result super-imposed on imaging area.
A strong scatter area is observed on the right side of the imaging result. However, no corresponding target can be found in the Google Map photograph. It is a false target from the intersection of range equal delay arcs that pass through target numbers 1, 2, and 3. The discrimination of false targets will be the focus of future work.
3.2. Grove Detection
The grove detection experiment in a wide range of area has been designed and conducted to further verify the feasibility of the algorithm. Fig. 9 shows that the receiver was located on the roof of a building with height of 15 meters, and the imaging area measured 200×100 m2. In order to add more collection locations, the other reflected antenna was connected to the third channel of the receiver through cable. Two reflected antennas were set up along the wall with a distance of 20 meters between each other, and the direct antenna was bound together with one of the reflected antennas. The experiment data were collected four times, and both antennas were moved 5 meters along the wall at each time. Thus, the experiment data were collected from eight different spots along the wall with the interval of 5 meters, and accumulation time for each collection location is 5 seconds. The experiment parameters are listed in Table 3. The same procedure of correction experiment was carried out like tree experiment, and it showed that inherent path delays of two reflected channels compared to direct channel were 14 units and 11 units, separately.
Figure 9. Experiment scene on the roof.
Table 3. Experimental parameters.
Parameter Value
Accumulation time 5 s Collection locations 8 Distance between collection locations 5 m
Height of antenna 15 m
building marked by red circle on the top of imaging area has also been detected, but it appears to be a long tail in imaging result, which may be caused by the large volume of the building and insufficiency of antenna’s height. More detailed analysis of reflected strength between different targets will be the focus of future work.
4. DISCUSSION
4.1. Influence of GEO Satellite Movement
The entire imaging processing algorithm is based on the assumptions of the GEO satellites, such as parallel assumption and relative static to the ground. However, GEO satellites are in slight and periodic motion based on the precise ephemeris published by the National Aeronautics and Space Administration (NASA) ftp://cddis.gsfc.nasa.gov/pub/gps/products/mgex/.
Considering that position changes of GEO satellites will indirectly impact the calculation of path delay in Formula (2), the errors brought by the slight and periodic movements of the GEO satellites are analyzed in this section.
Figure 10. Imaging result and targets detected.
(a) (b)
Figure 11. Azimuth and elevation of C05. (a) Azimuth of C05. (b) Elevation of C05.
azimuth and elevation every second. Fig. 11 shows that although azimuth and elevation changes were 4.1◦ and 2.68◦ within a whole day respectively, the changes of azimuth and elevation are within 10−4◦ during the 5-second sampling time. The corresponding path delay error, according to Formula (2), is 0.0002 m, which is much less than the resolution of the system. Hence, the errors caused by the position of GEO satellites can be ignored during the sampling time.
4.2. Addition of More Satellites
Table 4. Azimuth and elevation change in 5 s sampling time.
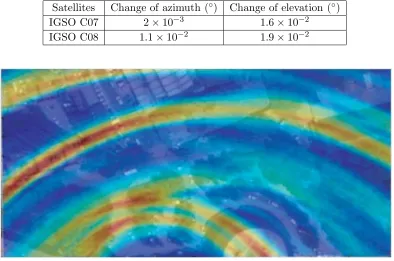
Satellites Change of azimuth (◦) Change of elevation (◦) IGSO C07 2×10⁻³ 1.6×10⁻² IGSO C08 1.1×10⁻² 1.9×10⁻²
Figure 12. Imaging result by the signals of IGSO C07 and C08.
and elevation are listed in Table 4. The changes are still small and can be considered as static satellites during the accumulation time. The imaging result by IGSO C07 and C08 is shown in Fig. 12.
Although there are obvious arcs in Fig. 12 for the limited number of satellites, the major targets in the area can still be detected. The imaging result combining GEO, IGSO C07 and IGSO C08 is shown in Fig. 13.
(a) (b)
Figure 13. Imaging results comparison. (a) Imaging result of grove experiment. (b) Grove imaging result combined with the signal of IGSO C07 and IGSO C08.
IGSO satellites have been included at specific time to acquire a better image. The next research will be focused on the discrimination of false targets and other media such as buildings or waters. In addition, the imaging resolution should be improved further.
ACKNOWLEDGMENT
This paper is supported by the National Natural Science Foundation of China under grant 41571420, and the specific support funding from National Key Laboratory of Remote Sensing Information Engineering.
REFERENCES
1. Anghel, A., R. Cacoveanu, A. S. Moldovan, A. A. Popescu, M. Datcu, and A. Serban, “Simplified bistatic SAR imaging with a fixed receiver and Terrasar-X as transmitter of opportunity — First results,” Geoscience and Remote Sensing Symposium, 2016.
2. O’Hagan, D. W., H. D. Griffiths, S. M. Ummenhofer, and S. T. Paine, “Elevation pattern analysis of common passive bistatic radar illuminators of opportunity,”IEEE Transactions on Aerospace & Electronic Systems, Vol. 53, No. 6, 3008–3019, 2017.
3. Kubica, V., X. Neyt, and H. Griffiths, “Along-track resolution enhancement for bistatic imaging in burst-mode operation,”IEEE Transactions on Aerospace & Electronic Systems, Vol. 52, No. 4, 1568–1575, 2016.
4. Nies, H., F. Behner, S. Reuter, S. Meckel, and O. Loffeld, “Radar imaging and tracking using geostationary communication satellite systems — A project description,” Proceedings of EUSAR 2016: European Conference on Synthetic Aperture Radar, 2016.
5. Borisenkov, A. V., O. V. Goriachkin, V. N. Dolgopolov, and B. G. Zhengurov, “Bistatic SAR based on TV-signal,” Proceedings of EUSAR 2014, European Conference on Synthetic Aperture Radar, 2014.
6. Antoniou, M. and M. Cherniakov, “Experimental demonstration of passive GNSS-based SAR imaging modes,”IET International Radar Conference 2013, 2013.
7. Antoniou, M., Z. Zeng, F. Liu, and M. Cherniakov, “Experimental demonstration of passive BSAR imaging using navigation satellites and a fixed receiver,” IEEE Geoscience & Remote Sensing Letters, Vol. 9, No. 3, 477–481, 2012.
8. Ma, H., M. Antoniou, and M. Cherniakov, “Passive GNSS-based SAR resolution improvement using joint Galileo E5 signals,” IEEE Geoscience & Remote Sensing Letters, Vol. 12, No. 8, 1640–1644, 2015.
10. Saini, R., R. Zuo, and M. Cherniakov, “Problem of signal synchronisation in space-surface bistatic synthetic aperture radar based on global navigation satellite emissions — Experimental results,” IET Radar Sonar and Navigation, Vol. 4, No. 1, 110–125, 2010.
11. Santi, F., M. Antoniou, and D. Pastina, “Point spread function analysis for GNSS-based multistatic SAR,”IEEE Geoscience &Remote Sensing Letters, Vol. 12, No. 2, 304–308, 2015.
12. Zhang, Q., M. Antoniou, W. Chang, and M. Cherniakov, “Spatial decorrelation in GNSS-based SAR coherent change detection,” IEEE Transactions on Geoscience & Remote Sensing, Vol. 53, No. 1, 219–228, 2014.
13. Tzagkas, D., M. Antoniou, and M. Cherniakov, “Coherent change detection experiments with GNSS-based passive SAR,”Radar Conference, 2017.
14. Zeng, H. C., P. B. Wang, J. Chen, W. Liu, L. L. Ge, and W. Yang, “A novel general imaging formation algorithm for GNSS-based bistatic SAR,” Sensors (Basel), Vol. 16, No. 3, 294, 2016. 15. Tian, W., T. Zhang, T. Zeng, C. Hu, and T. Long, “Space-surface BISAR based on GNSS signal:
Synchronization, imaging and experiment result,” Radar Conference, 2014.
16. Tian, W., T. Zhang, C. Hu, X. Yang, and T. Zeng, “Space-surface bistatic SAR using Beidou-2 as illuminator,”IEEE International Conference on Computer and Information Technology, 2014. 17. Zeng, T., T. Zhang, W. Tian, and C. Hu, “Space-surface bistatic SAR image enhancement based
on repeat-pass coherent fusion with Beidou-2/Compass-2 as illuminators,” IEEE Geoscience & Remote Sensing Letters, Vol. 13, No. 12, 1832–1836, 2017.
18. Fan, X., F. Liu, T. Zhang, T. Lu, C. Hu, and W. Tian, “Passive SAR with GNSS transmitters: Latest results and research progress,”Geoscience and Remote Sensing Symposium, 2017.
19. Usman, M. and D. W. Armitage, “A remote imaging system based on reflected GPS signals,” International Conference on Advances in Space Technologies, 2006.
20. Antoniou, M. and M. Cherniakov, “GNSS-based bistatic SAR: A signal processing view,”Eurasip Journal on Advances in Signal Processing, Vol. 2013, No. 1, 1–16, 2013.
21. Manandhar, D., R. Shibasaki, and H. Torimoto, “GPS reflected signal analysis using software receiver,” Positioning, Vol. 5, Nos. 1&2, 29–34, 2006.
22. Richards, M. A.,Fundamentals of Radar Signal Processing, 2005.
23. Usman, M. and D. W. Armitage, “Details of an imaging system based on reflected GPS signals and utilizing SAR techniques,”Journal of Global Positioning Systems, Vol. 8, No. 1, 2009.
24. Zeng, T., T. Zhang, W. Tian, C. Hu, and X. Yang, “Bistatic SAR imaging processing and experiment results using Beidou-2/Compass-2 as illuminator of opportunity and a fixed receiver,” Synthetic Aperture Radar, 302–305, 2015.