Hao Pan, Xiaomian Hu, and Zihui Wu
National Key Laboratory of Computational Physics, Institute of Applied Physics and Computational Mathematics, 100088 Beijing, China
Abstract. Dynamic yield strength of metals/alloys depends on loading pressure and rates sensitively. With the development of laser interferometer measurement system, extracting strength information from window/free surface velocity profiles in shock and ramp loading experiments is becoming an important method to investigate materials’ dynamic response under high pressure and high strain rates. Backwards characteristics analysis method (BCAM) can analyze the velocity profiles more reasonable because it accounts for bending of the incoming characteristics due to impedance mismatch between the sample and window. Synthetic analyses of reverse impact experiment and graded-density impactor loading-releasing experiment suggest that BCAM can give more accurate results including sound speed-particle velocity and yield strength at high pressure than incremental impedance matching method. We use BCAM to analyze velocity profiles of Sn in shock-release experiments and obtain its shear modulus and yield strength at different shock pressure and investigate its phase transition and dynamic unloading response.
1. Introduction
Metals /alloys under extreme loading such as impact, explosion, penetration, etc. have attracted much attention because of interesting phenomena and great challenges to experiment and simulation. A number of experiments have shown that the dynamic yield strength of metals depends on loading pressure and rates very sensitively [1–3]. Techniques for strength measurement at high pressures include comparison to hydrostatic response, lateral stress gauges, growth of Rayleigh-Taylor instabilities [4,5], etc.. In practice, with the development of laser interferometer measurement system, self-consistent method [6] is becoming an important method to investigate materials’ dynamic response under high pressure and high strain rates. The key problem of this method is to find a valid analysis technique to extract strength information from window/free surface velocity profiles in shock or ramp compression and unload experiments. Common used Lagrangian analysis methods include backward integration method (BIM) [7], incremental impedance matching method (IIMM) [8], transfer function method (TFM) [9] and backwards characteristics analysis method (BCAM) [10,11]. Compared to other methods, the BCAM can account for bending of the incoming characteristics due to impedance differences between the sample and window, moreover, this method also do not need to know the form of equations of state (EOS) and constitutive model. However, this method has been limited to analyzing only the loading portion of a ramp experiment and cannot account for elastic-plastic unloading due to an assumption of a unique one-to-one sound speed for a given pressure or particle velocity in this method.
aCorresponding author:[email protected]
In this work, we attempt to extend the BCAM to analyze the reverse impact experiment and graded-density impactor (GDI) loading-releasing experiment [12]. Synthetic analyses suggest that the BCAM can give more accurate results including sound speed-particle velocity and yield strength at high pressure than the IIMM. We also use the BCAM to analyze velocity profiles of Sn in shock-release experiments and obtain its shear modulus and yield strength at different shock pressures and investigate its phase transition and dynamic unloading response.
2. Backwards characteristics analysis
method
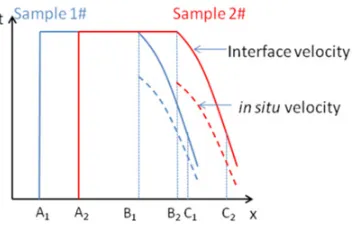
The BCAM was originally proposed as a way to extract stress-strain response of a ramp-wave loaded material described by Ref. [10,11]. Once the material contains a shock wave, the wave characteristics in the material require accounting for the shock wave and its relevant rarefaction waves. The sketch map of the characteristics with a shock wave is given in Fig.1. Figure2shows the idealized interface velocity and in-situ velocity profiles of two thickness samples measured from the shock-release experiment.
Since the BCAM requires an iterative approach, an initial guess at the in-situ particle velocity profiles of two thickness samples should make. Then the longitudinal Lagrangian wave speed can be defined as CL=(∂X /∂t )u.
These velocity profiles are used to compute material response by
dσ =ρ0CLdu∗ (1)
dε=du∗CL
u∗. (2)
Figure 1. Schematic x-t diagram of BCAM with shock wave.
Figure 2. The idealized interface velocity and in-situ velocity profiles of two thickness samples measured from the shock-release experiment.
Whereσ is stress, ρ0 is initial density, ε is strain, µ∗ is
in-situ velocity. The Riemann invariant R+alone positive characteristics and R− along negative characteristics for isentropic flow are
R±=up +F (3)
F=
1 ρ0CL
=u∗. (4)
The particle velocity up and in-situ velocity at the point where the negative and positive characteristics intersect are
up=
R++R−
2 (5)
F =u∗= R
+−R−
2 · (6)
The in-situ velocity and stress behind the shock wave front can be determined using the sample’s Hugoniot. The particle velocities on the boundary are the experimentally measured interface velocity. The relevant stress along the interface can be calculated from the known window’s Hugoniot and EOS. Because 0th negative characteristic is emanating from the initial state of the shock wave, along the negative characteristic the new in-situ velocity profiles
u∗(t) can be obtained by [13]
ti pos
R =
t0,i pos
+ XR−X(0,i pos)
CL(0,i pos)
(7)
u∗i pos
R =u ∗
(0,i pos). (8)
Figure 3. The idealized interface velocity and in-situ velocity profiles of two thickness samples measured from the GDI loading-release experiment. Dash curves are the virtual shock waves. tAis the arriving time of the shock wave.
In practice, the in-situ velocity profiles achieve conver-gence with fewer than 10 backward calculations and the shear modulus G and yield strength Y can be obtained from CL(u∗) using the self-consistent method which are [6]
G= 3
4 ρ2
0
ρ
C2L−C2B
(9)
Y =−3
4ρ0
C2L−C2B
CL
du. (10)
The above analysis method can be directly applied to the shock-release experiment. But for the GDI loading-releasing experiment, the measured interface velocity profiles require to be divided into loading portion and unloading portion, as shown in Fig. 3. Then we use the BCAM to analyze the loading portion and obtain the material’s response under loading. However, there is some difference to the unloading portion. Since the GDI experiment has a steady peak state in Fig.3, this provides a possibility to replace the loading portion with a virtual shock wave. The relevant pressure and particle velocity of the virtual shock wave is defined as the peak pressure and in-situ velocity of the BCAM analysis for the loading portion. Then the BCAM is used to analyze the unloading portion of the profiles in Fig. 3. But the arriving time tA of the virtual shock wave cannot be defined very properly. So we adjust the arriving time difference between the two shock waves tc=tA1−tA2to make the bulk sound speed
CB approach to the sound speed calculated by EOS, as shown in Fig.4. Finally the whole loading and unloading response of material can be obtained from the interface velocity profiles by the BCAM.
3. Results and discussion
3.1. Application to synthetic experiments
Figure 4. Lagrangian sound speed vs. particle velocity with different tc=tA1-tA2. Adjusting tcto make the bulk sound speed
CBapproach to the sound speed calculated by EOS.
Figure 5. Sketch map of reverse impact experiment.
Figure 6. Simulated Ta/LiF interface velocity profile of the reverse impact experiment.
EOS and an elastic-perfectly plastic strength model with constant yield strength. The simulation is performed using a 1-D hydrodynamics code and the spatial resolution is 10µm. The peak pressure in Ta is 30GPa. Figure6shows the simulated interface velocity profile of this experiment. The IIMM and BCAM are used to analyze the interface velocity profile shown in Fig.6. The releasing sound speed vs. in-situ particle velocity of the two methods is given in Fig.7. The subsequent yield strength and shear modulus calculated by Eq. (9) and Eq. (10) are given in Table 1.
As shown in Fig.7, though the initial unloading path by the two methods is almost same, the bulk sound speeds are not in agreement with each other. Further, difference of yield strength and shear modulus between the IIMM and BCAM is 5.5% and 1.7% separate and the strength and shear modulus of BCAM are in better agreement with the input data, as shown in Table1.
Another application is to the synthetic GDI loading-releasing experiment. The sketch map of the experiment is given in Fig.8. A thirteen layers graded-density impactor is impacted against two thickness steel samples. Steel is also modeled with a Mie-Gr¨uneisen EOS and a modified SCG strength model. Figure 9 shows the simulated steel/LiF velocity profiles of two samples. Table2shows
Figure 7. Releasing sound speed vs. in-situ particle velocity analyzed by the IIMM and BCAM for the synthetic profile in Fig.6.
Table 1. Y & G analyzed by the IIMM and BCAM for the synthetic reverse impact experiment.
Y/GPa G/GPa
BCAM 1.44 113
IIMM 1.52 115
INPUT 1.45 113
Figure 8. Sketch map of the GDI loading- releasing experiment.
Figure 9. Simulated steel/LiF interface velocity profiles of the GDI experiment.
Table 2. Y & G analyzed by the IIMM and BCAM for the profiles in Fig.9.
Y/GPa G/GPa
BCAM 1.68 149
IIMM 1.90 156
INPUT 1.73 145
the results of Y and G analysis using the IIMM and BCAM for the profiles shown in Fig.9.
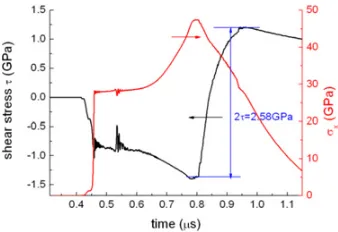
Figure 10. Simulated in-situ shear stress and pressure profiles at 2.0 mm into the steel which gives a mean shear stress value of 2.58 GPa.
Figure 11. Results of the releasing sound speed vs. particle velocity analysis using BCAM for the velocity profiles simulated by the rate-dependent response. The analyzed mean shear stress is 2.32 GPa.
3.2. Rate-dependent response considerations
As we know, strength of metals commonly depends on the strain rate sensitively, but one assumption in the BCAM is that of a rate-independent response. In order to validate the use of the BCAM analysis for a rate-dependent material, the synthetic data analysis of GDI experiment is repeated with a rate-dependent response. So a viscoplastic deformation constitutive model is used in the simulation, which is [15]
˙
ε=εe˙ +εp˙ (11)
˙¯ εp= 2
√
2
9 A ( ¯σ −YSG)
2. (12)
Where εe is elastic strain, εpis plastic strain and ¯
σ is equivalent stress and A is constant, A=3× 10⁷/GPa−2.s−1for steel [16].
The simulated in-situ shear stress and pressure profiles at 2.0 mm into the steel are given in Fig. 10, whereτ is equivalent shear stress. In the context of a yield surface, 2τ is equivalent to the yield strength. The BCAM analysis of releasing sound speed vs. particle velocity for the velocity profiles simulated by the viscoplastic model is given in Fig.11.
The BCAM shear modulus for the profiles simulated by the viscoplastic model is according with the input data. This suggest that the rate-dependent response does not have obviously influence on the shear modulus analysis. However, as shown in Fig. 9 and Fig. 10, the rate-dependent response will produce a larger error of∼10% in the BCAM mean shear stress or yield strength. That
Figure 12. Shear modulus G vs. shock pressure p.
Figure 13. Yield strength Y vs. shock pressure p.
Figure 14. Releasing CLvs. u of Sn at different shock pressure by BCAM.
may be caused by the reflecting waves from the interface which will perturb the strain rate state of the sample, but we still think this error is acceptable in measuring dynamic strength of metals under high pressure.
3.3. Analysis of Sn
Sn is a kind of complex-structure metal with polymorphic transitions at high pressure and temperature. We use the BCAM to re-analyze the velocity profiles of plate impact experiments of Sn [17]. Figures 12 and 13 shows the analyses of G and Y at different high pressure.
4. Conclusions
We extend the BCAM to analyze the synthetic velocity profiles of the reverse impact and GDI loading-releasing experiments and extract dynamic strength of metals at high pressures. Synthetic analyses suggest that the BCAM can give more accurate results including sound speed-particle velocity and yield strength at high pressure than the IIMM. The synthetic GDI experiment simulated by a viscoplastic deformation constitutive model is used to validate the use of the BCAM analysis for a rate-dependent material. Results reveal that the rate-dependent response can produce an error of∼10% in the analysis of the yield strength. We also use the BCAM to obtain shear modulus and yield strength of Sn at different shock pressure. The results do not support the shock-induced BCT to BCC transition.
References
[1] T. J. Vogler, T. Ao, J. R. Asay, Int. J. Plast. 25, 671 (2009)
[2] E. B. Zaretsky, G. I. Kanel, J. Appl. Phys. 114, 083511 (2013)
[6] J. R. Asay, J. Lipkin, J. Appl. Phys. 49, 4242 (1978). [7] D. B. Hayes, “ Backward Integration of the Equations of Motion to Correct for Free Surface Perturbations”, Sandia National Laboratories Report SAND2001-1440 (2001)
[8] J. Lipkin, J. R. Asay, J. Appl. Phys. 48, 182 (1977) [9] J. L. Brown, C. S. Alexander, J. R. Asay, T. J. Vogler,
J. L. Ding, J. Appl. Phys. 114, 223518 (2013) [10] S. D. Rothman, J. Maw, J. Phys. 134, 745 (2006) [11] S. D. Rothman, J. P. Davis, J. Maw, C. M. Robinson,
K. Parker, J. Palmer, J. Phys. D 38, 733 (2005) [12] L. P. Martin, J. R. Patterson, D. Orlikowski, J. H.
Nguyen, J. Appl. Phys. 102, 023507 (2007)
[13] J. P. Davis, “User Manual for CHARICE 1.0:”, Sandia National Laboratories Report SAND2007– 4984 (2007)
[14] D. J. Steinberg, S. G. Cochran, M. W. Guinan, J. Appl. Phys. 51, 1498 (1980)
[15] J. L. Ding, J. R. Asay, T. Ao, J. Appl. Phys. 107, 083508 (2010)
[16] J. W. Swegle, D. E. Grady, J. Appl. Phys. 58, 692 (1985)