1556-6811/09/$08.00
⫹
0
doi:10.1128/CVI.00157-09
Copyright © 2009, American Society for Microbiology. All Rights Reserved.
Immunological Profiles of
Bos taurus
and
Bos indicus
Cattle Infested
with the Cattle Tick,
Rhipicephalus
(
Boophilus
)
microplus
䌤
†
Emily K. Piper,
1,5Nicholas N. Jonsson,
1,5Cedric Gondro,
3,5Ala E. Lew-Tabor,
2,4,5Paula Moolhuijzen,
4,5Megan E. Vance,
2,5and Louise A. Jackson
2,5*
Cooperative Research Centre for Beef Genetic Technologies, Armidale, Australia 2351
5; The University of Queensland, School of
Veterinary Science, Brisbane, Australia 4072
1; Queensland Primary Industries and Fisheries, Brisbane, Australia 4105
2;
The University of New England, The Institute for Genetics and Bioinformatics, Armidale, Australia 2351
3; and
Murdoch University, Centre for Comparative Genomics, Perth, Australia 6150
4Received 7 April 2009/Returned for modification 12 May 2009/Accepted 21 May 2009
The cattle tick,
Rhipicephalus
(
Boophilus
)
microplus
, is a major threat to the improvement of cattle production
in tropical and subtropical countries worldwide.
Bos indicus
cattle are naturally more resistant to infestation
with the cattle tick than are
Bos taurus
breeds, although considerable variation in resistance occurs within and
between breeds. It is not known which genes contribute to the resistant phenotype, nor have immune
param-eters involved in resistance to
R. microplus
been fully described for the bovine host. This study was undertaken
to determine whether selected cellular and antibody parameters of the peripheral circulation differed between
tick-resistant
Bos indicus
and tick-susceptible
Bos taurus
cattle following a period of tick infestations. This
study demonstrated significant differences between the two breeds with respect to the percentage of cellular
subsets comprising the peripheral blood mononuclear cell population, cytokine expression by peripheral blood
leukocytes, and levels of tick-specific immunoglobulin G1 (IgG1) antibodies measured in the peripheral
circulation. In addition to these parameters, the Affymetrix bovine genome microarray was used to analyze gene
expression by peripheral blood leukocytes of these animals. The results demonstrate that the
Bos indicus
cattle
developed a stabilized T-cell-mediated response to tick infestation evidenced by their cellular profile and
leukocyte cytokine spectrum. The
Bos taurus
cattle demonstrated cellular and gene expression profiles
consis-tent with a sustained innate, inflammatory response to infestation, although high tick-specific IgG1 titers
suggest that these animals have also developed a T-cell response to infestation.
The cattle tick
Rhipicephalus
(
Boophilus
)
microplus
is a
ma-jor threat to the improvement of cattle production in tropical
and subtropical countries worldwide. Heavy tick infestation
has adverse physiological effects on the host, resulting in
de-creased live weight gain (21), and anemia is a common
symp-tom of heavy infestation (35).
R. microplus
is also the vector of
Babesia bovis
,
Babesia bigemina
, and
Anaplasma marginale
,
which cause tick fever in Australia. Acaricide treatment is the
primary method of controlling ticks; however, populations of
ticks have subsequently developed resistance to
organochlo-rines, organophosphates, carbamates, amidines, and synthetic
pyrethroids (27). Resistance to multiple classes of chemicals
has also been observed (27). It is probable that with current
usage new acaricides will encounter similar problems (10), and
a more sustainable solution to tick control is needed.
Naturally acquired host immunity has been proposed as a
viable cattle tick control method because of the potential
re-duction in expenditure on acaricides and husbandry practices
associated with chemical control (10).
Bos indicus
cattle breeds
are more resistant to
R. microplus
than are
Bos taurus
breeds,
although considerable variation in resistance occurs between
and within breeds (37, 45). Although innate immunity arising
from genetic differences between
B. indicus
and
B. taurus
breeds forms the basis of whether an animal will be resistant to
tick infestation, host resistance is considered to be
predomi-nantly an acquired trait because the higher level of resistance
seen in
B. indicus
becomes apparent only following a period of
initial susceptibility to primary infestation (15, 44). Host
resis-tance to tick infestation is heritable, with a rate estimated to be
between 39% and 49% for British breed animals (45) and as
high as 82% in Africander and Brahman (
B. indicus
) crossbred
animals (37). Since these initial studies, it has been shown that
the resistance status of both
B. taurus
and
B. indicus
breeds can
be improved by selection for increased tick resistance, as
dem-onstrated by a breeding program that has resulted in a highly
tick-resistant line of Hereford
⫻
Shorthorn (
B. taurus
) cattle,
now known as the Belmont Adaptaur (9, 25). Identifying the
mechanisms responsible for mediating naturally acquired tick
resistance in cattle is an essential step in developing predictive
phenotypic markers to enable rapid identification of highly
resistant individuals and is potentially useful in the
develop-ment of a tick vaccine. It is not known, however, which genes
contribute to the resistant phenotype, nor have immune
pa-rameters involved in resistance to
R. microplus
been fully
de-scribed for the bovine host.
Studies of immune parameters of the peripheral circulation
of tick-infested cattle have yielded varied and sometimes
con-flicting results. Cattle tick infestation has been reported to
reduce the number of circulating T lymphocytes and the
anti-body response to ovalbumin injection in susceptible
B. taurus
* Corresponding author. Mailing address: Queensland Primary
In-dustries and Fisheries, Locked Mail Bag 4, Moorooka, Australia 4105.
Phone: 61 (7) 3362 9428. Fax: 61 (7) 3362 9440. E-mail: Louise.Jackson
@dpi.qld.gov.au.
† Supplemental material for this article may be found at http://cvi
.asm.org/.
䌤
Published ahead of print on 27 May 2009.
1074
on August 17, 2020 by guest
http://cvi.asm.org/
animals compared to tick-free control animals (17). In another
study, infestation with several species of African ticks resulted
in higher levels of serum gamma globulin and increased
num-bers of circulating white blood cells (WBCs) in
B. taurus
ani-mals compared with those in Brahman cattle managed under
the same conditions (33). Exposure of animals to high and low
levels of tick infestation has been reported to result in
differ-ential patterns of immunoglobulins specific for tick salivary
proteins in resistant and susceptible cattle (7, 24). Sustained
heavy infestation has been shown to alter host hemostatic
mechanisms by inhibiting platelet aggregation and coagulation
functions (34) and also by altering the level of acute-phase
proteins in the susceptible host (4).
In vitro studies of mononuclear cell populations have shown
that salivary gland proteins from
R. microplus
can inhibit
im-mune cell function. The proliferative response of bovine
pe-ripheral blood mononuclear cells (PBMC) to stimulation with
the T-lymphocyte mitogen phytohemagglutinin (PHA) was
in-hibited by the addition of salivary gland protein to the culture
(17), and subsequent studies showed that sufficient
prostaglan-din E
2is present in tick saliva to be responsible for this
inhi-bition (16). Turni et al. (42) found that low concentrations of
R. microplus
salivary gland extract (SGE) inhibited the
oxida-tive burst capacity of monocytes and neutrophils, as well as the
proliferation response of PBMC to concanavalin A (ConA) in
vitro, in both
B. taurus
and
B. indicus
cattle. However, a higher
concentration of SGE caused a significant difference in the
degree of inhibition observed in the proliferation assay
be-tween the
B. taurus
and
B. indicus
cells: a 40.7% and an 88.5%
reduction, respectively. The authors suggested that the
dispro-portionate increase in inhibition at the higher concentration of
SGE may be an indication that the mechanisms by which the
two breeds resist infestation are different.
Here we report the results of a study undertaken to define
selected immune parameters in tick-resistant Brahman and
tick-susceptible Holstein-Friesian animals following challenge
infestations with
R. microplus
. The aim of this study was to
determine whether cellular and antibody components of the
peripheral circulation differed between these two breeds of
highly divergent resistance following a period of tick
infesta-tions.
MATERIALS AND METHODS
Animals and treatment.Six Holstein-Friesian (B. taurus) and six Brahman (B. indicus) heifers aged 6 months (⫾1 month) that had been previously vaccinated
against the tick fever-causing organisms Babesia bovis, B. bigemina, and
Anaplasma marginalewere used in this trial. Both groups originated from tick-infested areas of Australia, and consequently all animals had previously been
exposed toR. microplusin the field prior to the commencement of this study.
Infestation and tick counting procedures performed on these animals have been previously described (31). Briefly, cattle were artificially infested weekly for 7
weeks with approximately 10,000 (0.5 g)R. micropluslarvae applied to the neck
and withers. Animals were simultaneously exposed to ticks under natural con-ditions in tick-infested pastures. The larvae used to artificially infest the cattle were of the Non-Resistant Field Strain (NRFS) (40), which is maintained free of tick fever-causing organisms at Queensland Primary Industries and Fisheries in Brisbane, Australia. Larvae were maintained at 28°C and approximately 95% humidity and applied to animals 7 to 14 days after hatching. Standard tick counts were undertaken weekly, for 7 weeks, as described by Utech et al. (43). An analysis of variance of tick side counts was performed using Minitab (Student version 14) to show that the two breeds differed in their abilities to resist tick infestation. All animals in the trial were managed under the same conditions in the same paddock for several months prior to the commencement of the trial and
for the duration of the trial. Weekly blood samples were obtained via jugular venipuncture for 3 weeks during the period of artificial infestations. EDTA, lithium heparin, and Z clot activator Vacuette blood tubes (Greiner Bio-One) were used for the collection of blood.
Hematology.A hematology report was obtained for blood samples collected in EDTA Vacutainers using a VetABC animal blood cell counter (ABX Hema-tologie). The hematology report included counts of whole WBCs and red blood cells (RBCs), hemoglobin levels, platelets, packed cell volume, mean corpuscular volume, and mean cell hemoglobin concentration.
Flow cytometry.Blood collected in EDTA (100l) was combined with 100l of either a monoclonal antibody (Table 1) or an isotype control (mouse immu-noglobulin G1 [IgG1]; Dako, Carpinteria, CA) and incubated at 4°C for 30 min,
after which RBCs were lysed with 2 ml of RBC lysing buffer (0.19 M NH4Cl2,
0.01 M Tris, pH 7.5, containing 1% NaN3). Tubes were centrifuged at 500⫻gfor
5 min at 4°C. The supernatant was discarded, and all samples were washed with
2 ml of cold phosphate-buffered saline (PBS) containing 1% NaN3before being
centrifuged again at 500⫻g for 5 min at 4°C. The supernatant was again
discarded. The secondary antibody (anti-mouse IgG preadsorbed with bovine IgG conjugated to fluorescein isothiocyanate [FITC]; Calbiochem, San Diego, CA) was diluted 1/100 in PBS containing 5% fetal bovine serum (Invitrogen,
Carlsbad, CA) and 1% NaN3. Fifty microliters of diluted secondary antibody was
added to all tubes and incubated at 4°C for 30 min. Samples were washed with
PBS containing 1% NaN3as before, and the supernatant was discarded. Each
sample was resuspended in 200l of fixative (PBS containing 1% NaN3and 8%
formaldehyde). Samples were analyzed with a FACSCalibur flow cytometer (Becton Dickinson Immunocytometry Systems, Franklin Lakes, NJ). Data from 10,000 cells per sample were acquired using an argon laser with an excitation wavelength of 488 nm. Forward scatter light data were acquired using a linear amplifier, and side scatter light data were acquired with a logarithmic amplifier. Data analysis was performed using the commercially available software Cell-Quest (Becton Dickinson Immunocytometry Systems). Gates for analysis were set around the PBMC population on a dot plot of forward angle versus side angle light scatter. Labeled lymphocyte populations were analyzed using a histogram for fluorescein fluorescence, and a threshold marker was set at the upper 0.5% of the isotype-labeled control population for each biological sample. Results are presented as the percentage of PBMC that emitted fluorescence above that of the negative population.
Tick antigen extraction.Approximately 500 semiengorged adult female ticks
(NRFS) (40) were removed from pennedB. tauruscattle at Queensland Primary
Industries and Fisheries for preparing tick antigen extracts. Tick dissection was carried out within 12 h of removal of the tick from the host. Ticks were dissected while submerged in PBS, and gut and salivary glands were removed into separate
vials on dry ice before being stored at⫺70°C prior to antigen extraction. To
extract whole adult female and larval antigens, semiengorged NRFS adult fe-males and unfed NRFS tick larvae, respectively, were ground up using a mortar
and pestle on dry ice and then stored at⫺70°C prior to antigen extraction.
EDTA was added to dissected organs and ground-up tissue prior to freezing to remove divalent cations that contribute to proteolysis. Antigen extraction was performed using the method described previously by Jackson and Opdebeeck (20). Briefly, this method employs a series of centrifugation steps to separate proteins into membrane-bound and soluble fractions, and the resulting antigen extractions included salivary gland membrane (SM), larval membrane (LM), gut
TABLE 1. Monoclonal antibodies used in flow cytometric analysis
of cellular subsets
aSpecificity Identity Source Isotype
Isotype control
IgG1
Dako
IgG1
CD4
IL-A11
Cell culture
IgG2a
CD8
IL-A51
Cell culture
IgG1
CD14
MM61A
VMRD
bIgG1
CD25 (IL-2R
␣
)
IL-A111
Cell culture
IgG1
CD45RO
IL-A150
Cell culture
IgG3
MHCII
IL-A21
Cell culture
IgG2a
WC3
CC37
Cell culture
IgG1
WC1
IL-A29
Cell culture
IgG1
Goat anti-mouse
IgG-FITC
Calbiochem
IgG1
a
Monoclonal antibodies obtained from cell culture were derived from hybrid-omas sourced from the International Livestock Research Institute in Kenya.
b
VMRD, Veterinary Medical Research and Development, Inc.
V
OL. 16, 2009
IMMUNOLOGICAL PROFILES OF TICK-INFESTED CATTLE
1075
on August 17, 2020 by guest
http://cvi.asm.org/
membrane (GM), adult membrane (AM), salivary gland soluble (SS), larval soluble (LS), gut soluble (GS), and adult soluble (AS) antigen extracts.
Cellular proliferation assay.PBMC for the proliferation assays were isolated from 10 ml blood collected in lithium heparin Vacuette tubes. Blood was mixed with 8 ml of PBS, layered onto 8 ml of Ficoll-Paque (Pharmacia, Sydney,
Aus-tralia), and centrifuged at 500⫻gfor 40 min at 22°C. Cells at the interface of the
Ficoll-Paque and PBS were removed, added to 8 ml of RBC lysing buffer (0.19
M NH4Cl2, 0.01 M Tris, pH 7.5), and incubated at room temperature for 10 min
before being centrifuged at 250⫻gfor 10 min at 22°C. The supernatant was
discarded, and the cell pellet was resuspended and washed twice in PBS. Cells
were resuspended to 8⫻106
cells/ml in complete medium; RPMI 1640 medium (Sigma-Aldrich, St. Louis, MO) containing 10% fetal bovine serum (Invitrogen),
1% antibiotic-antimycotic solution (Gibco, Carlsbad, CA), and 2 mML
-glu-tamine (Gibco). The proliferation assay was set up in 96-well flat-bottomed cell culture plates (Greiner Bio-One, Frickenhausen, Germany), and assays were
performed in triplicate. Each experimental well contained 4⫻105cells with
either ConA, PHA, soluble fractions of semiengorged adult female ticks (AS) or larvae (LS), or membrane fractions of semiengorged adult female ticks (AM) or
larvae (LM). ConA and PHA were diluted in complete medium to 5g/ml and
20g/ml, respectively, and dispensed at 100 l per well. LM and AM tick
antigens were diluted to 10g/ml in complete medium, while LS and AS antigens
were diluted to 20g/ml in complete medium, and each was dispensed at 100l
per well. Control wells contained either medium only or cells plus medium, and
all wells were made up to a final volume of 200l with complete medium. The
plates were incubated with 5% CO2at 37°C for 5 days. Subsequently, 20l of
bromodeoxyuridine was added to all wells, and the plates were incubated with
5% CO2at 37°C overnight. The cellular proliferation was measured using a cell
proliferation enzyme-linked immunosorbent assay (ELISA) bromodeoxyuridine (colorimetric) kit (Roche Diagnostics, Sydney, Australia) according to the man-ufacturer’s instructions. Optical densities (ODs) were measured using a micro-plate reader at 450 nm in conjunction with the SoftmaxPro computer software. The mean OD of each biological sample from triplicate wells was employed for statistical analyses.
Tick-specific IgG antibody levels measured by ELISA.Serum samples col-lected from cattle over the 3-week period were used in an indirect ELISA to measure tick-specific IgG1 and IgG2 antibody levels. For the IgG1 ELISA, tick
antigens SM, GM, and LM were diluted to 7.5g/ml, 3.5g/ml, and 5g/ml,
respectively, in carbonate buffer (0.1 M NaHCO3and 0.1 M Na2CO3), while SS
and LS antigens were diluted to 10g/ml. For the IgG2 ELISA, all antigens were
diluted to 20g/ml. Microtiter plates (Greiner Bio-One) were coated with 100
l/well of diluted antigen by overnight incubation at 4°C. Excess antigen was
discarded, and plates were blocked with 200l of carbonate buffer containing
1% gelatin. Sera were diluted 1/400 for the IgG1 ELISA and 1/100 for the IgG2 ELISA in PBS containing 0.05% Tween 20 (PBS-T) and added to triplicate wells for each biological sample. Control wells contained either PBS-T, known positive serum, or known negative serum. The monoclonal antibody (mouse anti-bovine IgG1 or IgG2; AbD Serotec, Raleigh, NC) was diluted 1/100 in PBS-T and added
to all wells. The conjugated antibody (goat anti-mouse IgG heavy and light chain specific, conjugated to horseradish peroxidase; Calbiochem) was diluted 1/2,000
in PBS-T, and 100l was added to each well. A tetramethylbenzidine-peroxidase
substrate (Kirkegaard & Perry Laboratories, Maryland) was used to develop the
signal, and the reaction was stopped with 50l 2⌴orthophosphoric acid. The
absorbance was read at 450 nm. The mean OD of each biological sample from triplicate wells was employed for statistical analyses.
Isolation of RNA from WBCs.Five milliliters of blood collected into EDTA was added to 45 ml of RBC lysing buffer and allowed to stand at room
temper-ature for 10 min. Samples were then spun at 250⫻gfor 10 min, and the
supernatant was removed. The cell pellet was resuspended in 4 ml of Trizol
reagent (Invitrogen), and samples were stored at⫺70°C prior to RNA
extrac-tion. Extraction of total RNA was carried out according to the manufacturer’s instructions for Trizol reagent (Invitrogen). The RNA pellet was resuspended in
30l of RNase-free water, treated with 0.75 l of Turbo DNase (Ambion,
Austin, TX) according to the manufacturer’s instructions, and further purified using RNeasy minicolumns (Qiagen, Melbourne, Australia). RNA was stored at
⫺80°C until required.
Quantitative real-time reverse transcription-PCR (RT-PCR) analysis of se-lected cytokines.cDNA synthesis was performed using 2g of total RNA. The complementary strand was primed with OligoDT primers (Invitrogen), and cDNA synthesis was performed using a Superscript III kit (Invitrogen) according to the manufacturer’s instructions. Each quantitative PCR (qPCR) was carried
out in a final volume of 12l containing 20 ng cDNA, 5.8l Sensimix Plus Sybr
Master Mix (Quantace, Sydney, Australia), and gene-specific primers. Most primer sets used in the real-time PCRs for the analysis of cytokine and chemo-kine expression have been published elsewhere (6, 41), but for ease of reference they are listed in Table 2. Those primer sets that have not previously been published were designed using the Primer3 software available at http://frodo.wi .mit.edu/. The specificity of the primers was checked using melting curve analysis, and standard curves were generated for each primer pair to obtain the amplifi-cation efficiency. qPCR for each biological sample was performed in triplicate using standard cycling conditions on a Rotorgene 6000 (Corbett). For each biological sample, the mean of the cycle threshold values for each gene was calculated and normalized against two internal controls, glyceraldehyde-3-phos-phate dehydrogenase and acidic ribosomal protein large, P0, using the QGene software available at http://www.qgene.org/. This software expresses the result in
the form of the mean normalized expression⫾standard error (37a), and this
value was employed for statistical analysis.
Statistical analysis of cellular and antibody parameters.A one-way analysis of variance was performed using Minitab (Student version 14) for the fixed effect of breed for each of the cellular and antibody parameters measured above. The dependent variable used for the analysis was the mean of the three weekly observations for each animal in each group, as it was confirmed that week did not have a significant impact on any of the variables using the general linear model (Minitab, Student version 14).
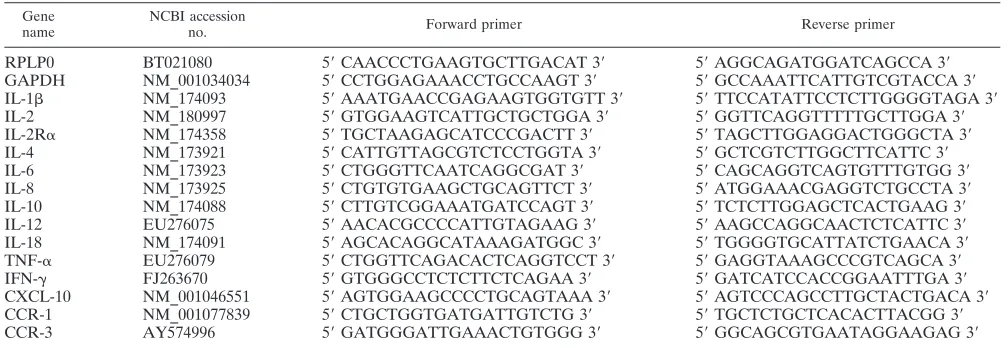
TABLE 2. Genes analyzed via quantitative real-time RT-PCR
aGene name
NCBI accession
no. Forward primer Reverse primer
RPLP0
BT021080
5
⬘
CAACCCTGAAGTGCTTGACAT 3
⬘
5
⬘
AGGCAGATGGATCAGCCA 3
⬘
GAPDH
NM_001034034
5
⬘
CCTGGAGAAACCTGCCAAGT 3
⬘
5
⬘
GCCAAATTCATTGTCGTACCA 3
⬘
IL-1

NM_174093
5
⬘
AAATGAACCGAGAAGTGGTGTT 3
⬘
5
⬘
TTCCATATTCCTCTTGGGGTAGA 3
⬘
IL-2
NM_180997
5
⬘
GTGGAAGTCATTGCTGCTGGA 3
⬘
5
⬘
GGTTCAGGTTTTTGCTTGGA 3
⬘
IL-2R
␣
NM_174358
5
⬘
TGCTAAGAGCATCCCGACTT 3
⬘
5
⬘
TAGCTTGGAGGACTGGGCTA 3
⬘
IL-4
NM_173921
5
⬘
CATTGTTAGCGTCTCCTGGTA 3
⬘
5
⬘
GCTCGTCTTGGCTTCATTC 3
⬘
IL-6
NM_173923
5
⬘
CTGGGTTCAATCAGGCGAT 3
⬘
5
⬘
CAGCAGGTCAGTGTTTGTGG 3
⬘
IL-8
NM_173925
5
⬘
CTGTGTGAAGCTGCAGTTCT 3
⬘
5
⬘
ATGGAAACGAGGTCTGCCTA 3
⬘
IL-10
NM_174088
5
⬘
CTTGTCGGAAATGATCCAGT 3
⬘
5
⬘
TCTCTTGGAGCTCACTGAAG 3
⬘
IL-12
EU276075
5
⬘
AACACGCCCCATTGTAGAAG 3
⬘
5
⬘
AAGCCAGGCAACTCTCATTC 3
⬘
IL-18
NM_174091
5
⬘
AGCACAGGCATAAAGATGGC 3
⬘
5
⬘
TGGGGTGCATTATCTGAACA 3
⬘
TNF-
␣
EU276079
5
⬘
CTGGTTCAGACACTCAGGTCCT 3
⬘
5
⬘
GAGGTAAAGCCCGTCAGCA 3
⬘
IFN-
␥
FJ263670
5
⬘
GTGGGCCTCTCTTCTCAGAA 3
⬘
5
⬘
GATCATCCACCGGAATTTGA 3
⬘
CXCL-10
NM_001046551
5
⬘
AGTGGAAGCCCCTGCAGTAAA 3
⬘
5
⬘
AGTCCCAGCCTTGCTACTGACA 3
⬘
CCR-1
NM_001077839
5
⬘
CTGCTGGTGATGATTGTCTG 3
⬘
5
⬘
TGCTCTGCTCACACTTACGG 3
⬘
CCR-3
AY574996
5
⬘
GATGGGATTGAAACTGTGGG 3
⬘
5
⬘
GGCAGCGTGAATAGGAAGAG 3
⬘
aGene names and NCBI accession numbers are listed with forward and reverse primer sequences (5⬘to 3⬘). RPLP0, acidic ribosomal protein large, P0; GAPDH,
glyceraldehyde-3-phosphate dehydrogenase; IFN-␥, gamma interferon.
on August 17, 2020 by guest
http://cvi.asm.org/
Microarray data.Transcription profiling of the RNA extracted from WBCs of the three Brahman and three Holstein-Friesian animals was conducted using the Affymetrix GeneChip bovine genome array platform (Affymetrix, Santa Clara, CA). This expression array contains 24,128 probe sets representing 11,255 gene
identities fromBos taurusbuild 4.0 and 10,775 annotated UniGene identities
plus 133 control probes. The experiment was designed to be compliant with standards for minimum information about a microarray experiment. Each RNA sample was processed and hybridized to individual slides; target preparation and microarray processing procedures were carried out by the Australian Genome Research Facility, Melbourne, Australia, as described in the Affymetrix Gene-Chip expression analysis manual (Affymetrix), and scanning was performed with an Agilent microarray scanner (Agilent Technologies, Santa Clara, CA).
Microarray data preprocessing.All quality control measures, preprocessing, and analyses were performed using the statistical computing language R (32) and Bioconductor (13). The quality of the arrays was assessed through standard quality control measures for Affymetrix arrays: pseudoimages of the arrays (to detect spatial effects), MA scatter plots of the arrays versus a pseudomedian reference chip, and other summary statistics including histograms and box plots of raw log intensities, box plots of relative log expressions, box plots of normal-ized unscaled standard errors, and RNA degradation plots (3). All arrays were within normal boundaries (see the supplementary analysis file available through
the microarray data accession number for the NCBI Gene Expression Omnibus [GEO] site).
Transcription intensities in log2scale were estimated from the probe-level data
by using three summarization methods: MAS5.0 (1) with the Raffypackage (11),
RMA (18, 19), and GCRMA (46). Briefly, for MAS summarization, the back-ground was corrected and each probe was adjusted using a weighted average. All arrays were scaled to the same mean value for normalization (200) and were
summarized by an adjusted log2scale average using one-step Tukey biweight. For
RMA, the background was corrected by convolution. The data were then quan-tile normalized and summarized by median polish. GCRMA background cor-rection used an affinity measure model based on probe sequences and mismatch intensities.
MAS generates a detection call, which flags each transcript as present,
mar-ginal, or absent (28, 30). Detection calls for the probes were calculated ( ⫽
0.015,␣1⫽0.04,␣2⫽0.06) and used as a filtering criterion in the analyses.
Statistical analysis of microarray data.Statistical analyses were performed following the method used by Rowe et al. (36). Prior to testing for differential
expression, the data were filtered to remove Affymetrix control probes (n⫽133)
and all noninformative probes detected as marginal or absent in all arrays (n⫽
8,920), thus leaving 15,096 probes to be tested. Differential transcription was tested for each summarization method using LIMMA (38, 39). Only differentially expressed (DE) probes detected in two out of the three summarization methods
(P⬍0.01) and flagged as present in at least 50% of the samples were considered
to be significant. No false discovery rate correction method is warranted due to the stringency of the filtering criteria.
Functional profiling. Annotation of DE probes was performed using the Database for Annotation, Visualization and Integrated Discovery (DAVID) (http://david.abcc.ncifcrf.gov/home.jsp) (8) and an R annotation package derived
from theBos taurusbuild 4.0. In subsequent text the term “probe” is replaced by
“gene.” The DE genes were analyzed in the context of their gene ontology (GO) biological process (12) and KEGG biological pathway (22, 23).
Functional profiles for the DE genes were derived for each of the GO (2) categories: cellular component, molecular function, and biological process. DE genes were mapped from their Entrez identifier to their most specific GO term, and these were used to span the tree structure and test for gene-enriched terms.
Unannotated probes were dropped from the analyses. To avoid overinflatedP
values, the background consisted exclusively of the array probes used in the analyses after removal of control probes, unexpressed probes, and unannotated probes. Profiles for each category were also constructed for the DE genes for different tree depths.
Validation of DE genes.Eight genes were arbitrarily chosen to validate the microarray estimates using quantitative real-time RT-PCR. Validation was per-formed using RNA extracted from peripheral blood leukocytes of six
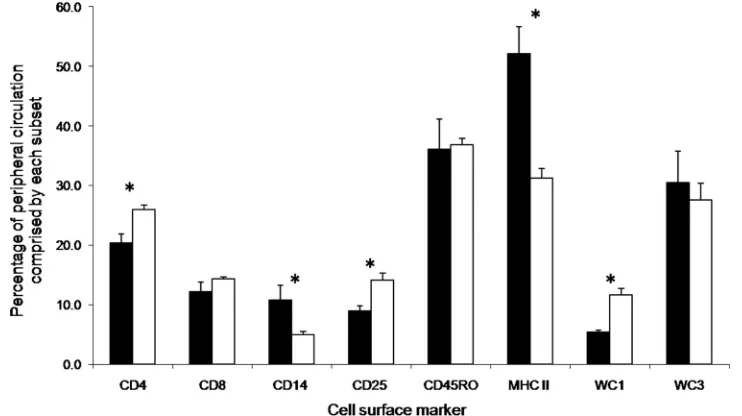
Holstein-FIG. 1. Percentage of each cellular subset comprising the PBMC population of Holstein-Friesian (black) and Brahman (white) cattle. Results
are presented as the breed means of three time points with standard deviations from the group means. Asterisks denote a significant difference
(
P
⬍
0.01) between the Holstein-Friesian and Brahman cattle.
TABLE 3. Hematological parameters measured for
Holstein-Friesian and Brahman cattle
aParameter (unit) Value by breed: P
Holstein-Friesian Brahman
WBC count (10
3/mm
3)
13.27
⫾
1.66
10.84
⫾
1.88
0.002
RBC count (10
6/mm
3)
5.47
⫾
0.51
9.25
⫾
0.62
⬍
0.001
Hemoglobin (g/dl)
9.31
⫾
0.80
12.99
⫾
0.74
⬍
0.001
Hematocrit/packed cell
vol (%)
24.98
⫾
2.30
34.77
⫾
2.29
⬍
0.001
Platelet count (10
3/mm
3) 445.00
⫾
116.53 581.39
⫾
154.58
0.007
Mean corpuscular vol
(/
m
3)
45.78
⫾
2.28
37.67
⫾
2.85
⬍
0.001
Mean cell hemoglobin
concn (g/dl)
37.32
⫾
0.47
37.48
⫾
1.92
0.723
aResults are presented as the breed means of three time points. Means are
presented⫾standard deviations from the group means together with the P
values for test of significant difference between breeds using the one-way analysis of variance.
V
OL. 16, 2009
IMMUNOLOGICAL PROFILES OF TICK-INFESTED CATTLE
1077
on August 17, 2020 by guest
http://cvi.asm.org/
FIG. 2. Flow cytometric displays of peripheral blood lymphocytes from a representative Holstein-Friesian animal (subpanels A to C) and a
representative Brahman animal (subpanels D to F). (a) CD4
⫹cells; (b) CD14
⫹cells; (c) CD25
⫹cells; (d) MHCII
⫹cells; (e) WC1
⫹cells. Dot plots
in subpanels A and D depict forward scatter versus side scatter light data. The mononuclear lymphocyte population is gated in red. Subpanels B
and E depict the isotype-labeled lymphocyte population on a dot plot of FITC fluorescence versus side scatter light data. Subpanels C and F depict
the gated lymphocyte population labeled with the respective antibody specific for the cell surface antigen.
on August 17, 2020 by guest
http://cvi.asm.org/
Friesian and five Brahman animals. Primers used for the validation of genes detected as DE by the microarray analysis were designed using the Primer3 software available at http://frodo.wi.mit.edu/. Real-time quantitative RT-PCR and normalization were carried out using the methods described above. Primers used for the validation of DE genes are listed in Table S2a in the supplemental material.
Microarray data accession number.The NCBI GEO accession number for the microarray data reported in this paper is GSE13725. Available for download from this GEO accession is a zipped supplementary analysis file containing all preprocessing analyses, annotated lists of DE genes with links to NCBI and Affymetrix, and other relevant images, diagrams, and analyses.
RESULTS
Tick counts.
The Brahman cattle carried significantly fewer
ticks (
P
⬍
0.001) than did the Holstein-Friesian cattle at all
time points when tick counts were undertaken, as previously
reported (31). The mean number of ticks observed on the
Brahman animals was 15 (
⫾
14) per side, while the mean
num-ber of ticks observed on the Holstein-Friesian animals was 151
(
⫾
36) per side.
Hematology.
A significantly higher (
P
⫽
0.002) WBC count
was recorded for the Holstein-Friesian animals at each of the
three sampling time points; average Holstein-Friesian WBC
counts were (13.27
⫾
2.26)
⫻
10
6/ml while average Brahman
WBC counts were (10.84
⫾
2.16)
⫻
10
6/ml (Table 3).
Signifi-cantly higher (
P
⬍
0.001) levels of RBCs were recorded for the
Brahman animals in each of the three sampling periods; mean
Holstein-Friesian RBC counts were (5.47
⫾
0.51)
⫻
10
6/mm
3while mean Brahman RBC counts were (9.25
⫾
0.62)
⫻
10
6/
mm
3(Table 3). The Holstein-Friesian animals correspondingly
had significantly lower (
P
⬍
0.001) hemoglobin levels than did
the Brahman animals. These values and other hematological
parameters are listed with the respective significance levels in
Table 3.
Flow cytometry.
The Brahman animals had significantly
higher levels of CD4
⫹T cells (
P
⬍
0.001), activated T cells
(CD25
⫹) (
P
⬍
0.001), and
␥␦
T cells (WC1
⫹) (
P
⫽
0.006) in
their peripheral circulation than did the Holstein-Friesian
an-imals (Fig. 1). However, the Holstein-Friesian group presented
significantly higher levels of monocytes (CD14
⫹) (
P
⬍
0.001)
and other cells expressing the major histocompatibility
com-plex class II (MHCII) (
P
⬍
0.001) (Fig. 1). Figure 2a to e
depicts flow cytometry displays of CD4
⫹, CD14
⫹, CD25
⫹,
MHCII
⫹, and WC1
⫹cell populations, respectively, from a
representative Holstein-Friesian animal and a representative
Brahman animal. No difference was observed between the
breeds for the percentages of CD8
⫹T cells, memory T cells
(CD45RO
⫹), or B cells (WC3
⫹) in circulation.
Cellular proliferation assay.
There was no significant
differ-ence between the breeds in the abilities of their PBMC to
respond to stimulation with ConA or PHA at any sampling
time point (data not shown). Proliferation of PBMC in the
presence of tick antigen was not significantly different from the
proliferation of cells in medium alone (data not shown).
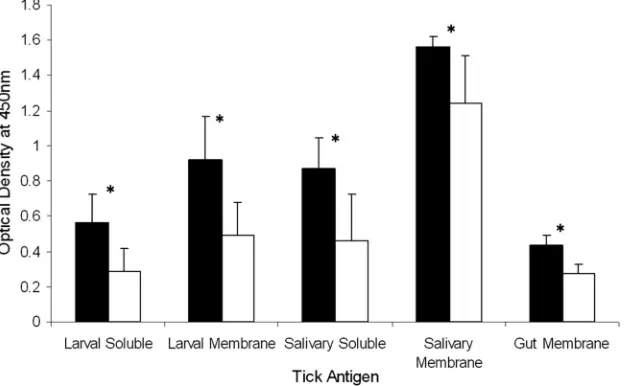
Tick-specific IgG antibody levels.
Significantly higher levels
(
P
⬍
0.001) of IgG1 antibodies specific for the tick antigen
extracts LM, SM, GM, LS, and SS were observed in sera
collected from the Holstein-Friesian animals than in sera from
the Brahman animals (Fig. 3). There was no significant
differ-ence between the breeds for the level of IgG2 antibodies
spe-cific for any of the tick antigen extracts (data not shown). All
animals demonstrated relatively low levels of tick-specific IgG2
compared to IgG1, apart from three Holstein-Friesian animals
that developed moderately high levels of IgG2 specific for all
antigen extracts (data not shown).
Expression of selected cytokines and chemokines by
periph-eral blood leukocytes.
Blood was collected at only one time
point during the height of infestation for cytokine profiling of
peripheral blood leukocytes. One Brahman animal was
ex-cluded from the analysis due to poor RNA quality, and thus
qPCR profiling of cytokine expression is based on six
Holstein-Friesian and five Brahman animals. Transcripts of interleukin
1

(IL-1

), IL-2, IL-2 receptor alpha (IL-2R
␣
), IL-10, IL-12,
IL-18, gamma interferon, tumor necrosis factor alpha
(TNF-␣
), CXC motif chemokine ligand 10 (CXCL-10), chemokine
FIG. 3. IgG1 antibody levels specific for tick antigen extracts of Holstein-Friesian (black) and Brahman (white) cattle. Results are presented
as breed means of three time points with standard deviations from the group means. Holstein-Friesian animals had significantly (
P
⬍
0.001) higher
levels of IgG1 antibodies specific for all tick antigen extracts than did Brahman animals, as indicated by the asterisks.
V
OL. 16, 2009
IMMUNOLOGICAL PROFILES OF TICK-INFESTED CATTLE
1079
on August 17, 2020 by guest
http://cvi.asm.org/
receptor 1 (CCR-1), and chemokine receptor 3 (CCR-3) were
detected for every animal. Significantly higher expression of
IL-2 (
P
⫽
0.026), IL-2R
␣
(
P
⫽
0.008), TNF-
␣
(
P
⫽
0.035), and
CCR-1 (
P
⫽
0.009) was detected in peripheral blood
leuko-cytes from Brahman cattle than in those from
Holstein-Frie-sian animals, while significantly higher expression of CXCL-10
(
P
⫽
0.034) was detected in the Holstein-Friesian cattle than in
Brahman animals (Fig. 4). The ability to detect IL-4, IL-6, and
IL-8 was variable in animals of both breeds (data not shown).
Microarray analysis.
Quality control checks established that
the slides were of good quality and there were no outliers in
the samples (see the supplementary analysis file at GEO). A
study comparing 45 different combinations for background
correction, normalization, and summarization of Affymetrix
microarray data found that the major source of variability in
the analysis is the method of summarization used to transform
the multiple probe intensities into one measure of expression
(14). To obtain maximum specificity in our studies, three
dif-ferent summarization methods were used (MAS, RMA, and
GCRMA) and only genes with a
P
value of
⬍
0.01 in at least
two out of the three methods and flagged as present in at least
half of the samples were considered to be significant. This
approach increases the stringency of the study, and thus no
false discovery rate correction method for multiple testing is
necessary.
A total of 497 transcripts were detected as significantly DE
(
P
⬍
0.01) by WBCs in the peripheral circulation of
Holstein-Friesian and Brahman cattle. Two hundred fifty-three of these
were more highly expressed by cells from Brahman cattle,
while the remaining 244 were more highly expressed by the
Holstein-Friesian group (Fig. 5; see also Table S1 in the
sup-plemental material for a full list of DE genes). qPCR
under-taken on eight arbitrarily chosen DE genes reflected closely the
results obtained by the microarray, and these results are
pre-sented in Table S2b in the supplemental material.
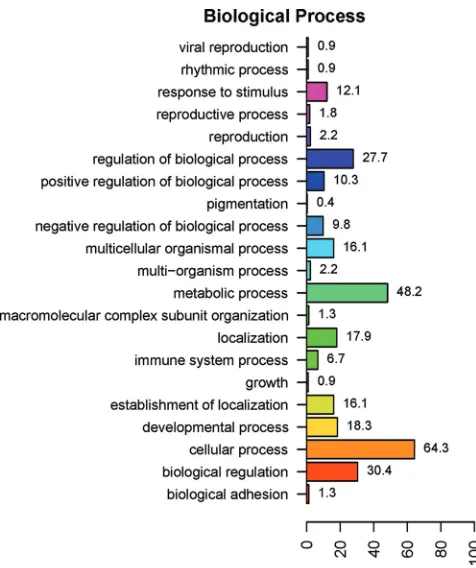
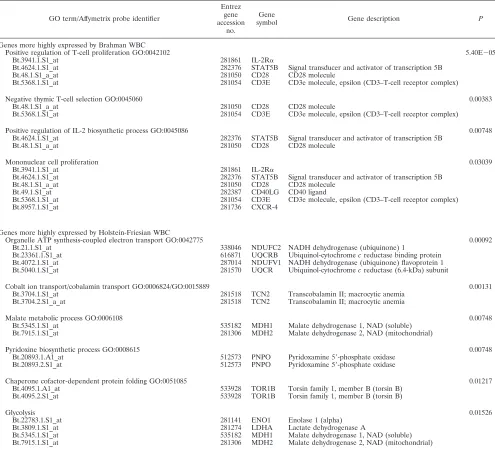
GO and pathway analysis.
DE genes were analyzed in the
context of their GO biological process. Due to the incomplete
annotation of the bovine genome, 273 of the 497 differentially
FIG. 4. Cytokine/chemokine receptor expression by WBCs of Holstein-Friesian (black) and Brahman (white) cattle. Results are presented as
breed mean normalized expression values with standard deviations from the group means. Asterisks denote significant differences between the
breeds.
on August 17, 2020 by guest
http://cvi.asm.org/
1081
on August 17, 2020 by guest
http://cvi.asm.org/
expressed probe sets were not annotated and were excluded
from the analysis (including duplicate probe sets that target the
same gene). GO analyses showed that the major differences in
gene expression between the two breeds were associated with
cellular (64.3% of DE genes) and metabolic (48.2% of DE
genes) processes in the level 2 biological process ontology
categories (Fig. 6). Genes associated with immune system
pro-cesses accounted for 6.7% of DE genes. The top-ranking
bio-logical process GO terms overrepresented by the DE genes are
listed in Table 4, together with the gene descriptions for the
term and
P
value for the test of significance. From molecular
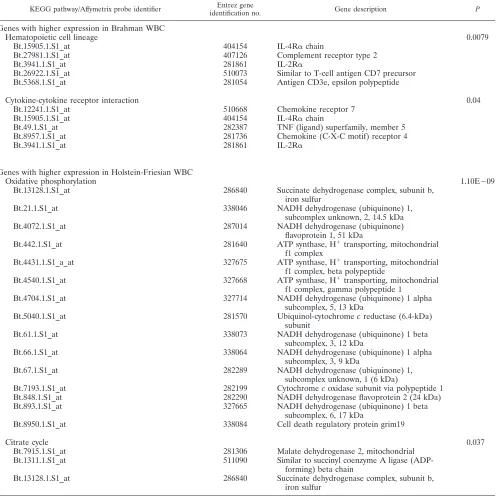
pathway analysis using DAVID, four major KEGG pathways
were represented by genes DE by Brahman and
Holstein-Friesian WBCs. Ten genes more highly expressed by Brahman
WBCs were associated with the hemopoietic cell lineage (
P
⫽
0.0079) and cytokine-cytokine receptor interaction pathways
(
P
⫽
0.04), while 15 genes more highly expressed by
Holstein-Friesian WBCs were associated with the oxidative
phosphory-lation pathway (
P
⫽
1.1E
⫺
09) and a further three represented
the citrate cycle (
P
⫽
0.037) (Table 5).
DISCUSSION
Results presented here demonstrate clear differences
be-tween the breeds in the levels of host resistance to tick
infes-tation and in cellular and antibody parameters measured in the
peripheral blood. The significantly lower RBC count in the
Holstein-Friesian animals, and correspondingly low
hemoglo-bin and hematocrit levels, are typical hematological
parame-ters often observed in heavily infested animals. Although all
erythron parameters for animals of both breeds were within
ranges considered normal for cattle (26), Holstein-Friesian
values for RBCs, hemoglobin, and hematocrit were verging on
those considered to define anemia (5). A significantly higher
WBC count was also recorded for the Holstein-Friesian
ani-mals that is slightly above the range considered normal for
cattle; the normal range for cattle is reported to be 4
⫻
10
3to
12
⫻
10
3/mm
3(26). It has been noted that WBC counts can be
higher in calves of 6 months to 3 years of age; however, the
high WBC count in these heavily infested animals is more
likely a reflection of the prolonged period of inflammation and
stress caused by the heavy tick burden. The significantly higher
WBC count in the Holstein-Friesian animals is consistent with
the work of Rechav et al. (33), who reported higher WBC
counts in Simmentaler (
B. taurus
) cattle infested with African
tick species than in Brahman cattle managed under the same
conditions.
The two breeds showed significant differences in the relative
percentages of cellular subsets comprising the PBMC
popula-tion. The Brahman group had higher percentages of
␥␦
T cells,
CD4
⫹T cells, and CD25
⫹T cells than did the
Holstein-Frie-sians, while the Holstein-Friesians had relatively higher
per-centages of macrophage-type cells (monocytes and
MHCII-expressing cells) in their circulation. The higher percentage of
MHCII-expressing cells recorded for the Holstein-Friesian
an-imals can be mainly attributed to a higher percentage of
CD14
⫹cells in these animals, as there was no significant
dif-ference between the breeds in the percentages of B cells seen
in circulation. The relatively lower percentage of T-cell subsets
observed in the Holstein-Friesian animals may have resulted
from these cells moving out of the blood and into the skin at
the site of tick attachment, thus reducing the relative numbers
observed in the peripheral circulation. Similarly, the lower
percentage of macrophage-type cells in the Brahman animals
may reflect a similar effect. However, with regard to the
MHCII-expressing cells, the more likely scenario is that these
cellular subsets have proliferated in the Holstein-Friesians in
response to the heavy tick burden, as these are the cell types
responsible for presenting exogenously derived antigen to the
immune system. We acknowledge, however, that it is not
pos-sible to determine whether these differences are a response to
tick infestation or whether they are innate differences between
the breeds, as preinfestation measurements were not obtained
(because the animals in this study had been previously exposed
FIG. 5. MAS5 heat map plot of the top 100 (most significant) DE genes clustered using hierarchical clustering. Affymetrix identifications are
listed with their corresponding gene symbol or “NA” if no gene assignment is available. For further information on gene names, expression
changes, and significance values, see Table S1 in the supplemental material or the supplementary analysis file available through the accession
number GSE13725 at the GEO website.
FIG. 6. Ontology analysis of 224 annotated DE genes in WBCs of
Brahman and Holstein-Friesian cattle. The
y
axis lists the major
bio-logical processes represented by the 224 DE genes, and the
x
axis
indicates the percentages of DE genes involved in the respective GO
biological process. (Note that a gene may be involved in more than one
GO category and thus the total percentage is more than 100.)
on August 17, 2020 by guest
http://cvi.asm.org/
to ticks in the field prior to the commencement of the trial).
The differences in the relative percentages of cellular subsets
comprising the periphery in these breeds were reflected in the
qPCR analysis of cytokine expression of the WBCs. The
sig-nificantly higher expression of IL-2R
␣
(CD25), IL-2, TNF-
␣
,
and CCR-1 by WBCs of the Brahman animals suggests a more
vigorous T-cell response in this group, whereas the higher
expression of CXCL-10 by WBCs of the Holstein-Friesian
animals is consistent with the higher levels of inflammatory/
macrophage-type cells observed in the peripheral circulation of
these animals (29).
Since many differences were noted between the Brahman
and Holstein-Friesian cattle with regard to their cellular
pro-files and gene expression of WBCs, analysis of WBC global
gene expression of three Brahman and three Holstein-Friesian
animals was undertaken to examine more closely the processes
taking place in the blood during tick infestation. To our
knowl-edge, this is the first study to undertake global gene expression
analysis of WBCs in tick-infested cattle. Many genes that were
detected as DE between the two breeds fell into two general
categories: those involved with adaptive immune responses
and those involved in metabolic processes. GO analysis
dem-onstrated that several genes more highly expressed by WBCs
of Brahman cattle overrepresented processes involved in
adap-tive immunity such as T-cell proliferation and selection and
mononuclear cell proliferation. This was also reflected in the
KEGG pathway analysis, which generated two major pathways
for genes more highly expressed by Brahman WBCs: the
he-mopoietic cell lineage and cytokine-cytokine receptor
interac-tions. Conversely, genes that were more highly expressed by
TABLE 4. Top-ranking biological process GO terms for genes DE between Brahman and Holstein-Friesian cattle
GO term/Affymetrix probe identifier
Entrez gene accession
no.
Gene
symbol Gene description P
Genes more highly expressed by Brahman WBC
Positive regulation of T-cell proliferation GO:0042102 5.40E⫺05
Bt.3941.1.S1_at 281861 IL-2R␣
Bt.4624.1.S1_at 282376 STAT5B Signal transducer and activator of transcription 5B
Bt.48.1.S1_a_at 281050 CD28 CD28 molecule
Bt.5368.1.S1_at 281054 CD3E CD3e molecule, epsilon (CD3–T-cell receptor complex)
Negative thymic T-cell selection GO:0045060 0.00383
Bt.48.1.S1_a_at 281050 CD28 CD28 molecule
Bt.5368.1.S1_at 281054 CD3E CD3e molecule, epsilon (CD3–T-cell receptor complex)
Positive regulation of IL-2 biosynthetic process GO:0045086 0.00748
Bt.4624.1.S1_at 282376 STAT5B Signal transducer and activator of transcription 5B
Bt.48.1.S1_a_at 281050 CD28 CD28 molecule
Mononuclear cell proliferation 0.03039
Bt.3941.1.S1_at 281861 IL-2R␣
Bt.4624.1.S1_at 282376 STAT5B Signal transducer and activator of transcription 5B
Bt.48.1.S1_a_at 281050 CD28 CD28 molecule
Bt.49.1.S1_at 282387 CD40LG CD40 ligand
Bt.5368.1.S1_at 281054 CD3E CD3e molecule, epsilon (CD3–T-cell receptor complex)
Bt.8957.1.S1_at 281736 CXCR-4
Genes more highly expressed by Holstein-Friesian WBC
Organelle ATP synthesis-coupled electron transport GO:0042775 0.00092
Bt.21.1.S1_at 338046 NDUFC2 NADH dehydrogenase (ubiquinone) 1
Bt.23361.1.S1_at 616871 UQCRB Ubiquinol-cytochromecreductase binding protein
Bt.4072.1.S1_at 287014 NDUFV1 NADH dehydrogenase (ubiquinone) flavoprotein 1
Bt.5040.1.S1_at 281570 UQCR Ubiquinol-cytochromecreductase (6.4-kDa) subunit
Cobalt ion transport/cobalamin transport GO:0006824/GO:0015889 0.00131
Bt.3704.1.S1_at 281518 TCN2 Transcobalamin II; macrocytic anemia
Bt.3704.2.S1_a_at 281518 TCN2 Transcobalamin II; macrocytic anemia
Malate metabolic process GO:0006108 0.00748
Bt.5345.1.S1_at 535182 MDH1 Malate dehydrogenase 1, NAD (soluble)
Bt.7915.1.S1_at 281306 MDH2 Malate dehydrogenase 2, NAD (mitochondrial)
Pyridoxine biosynthetic process GO:0008615 0.00748
Bt.20893.1.A1_at 512573 PNPO Pyridoxamine 5⬘-phosphate oxidase
Bt.20893.2.S1_at 512573 PNPO Pyridoxamine 5⬘-phosphate oxidase
Chaperone cofactor-dependent protein folding GO:0051085 0.01217
Bt.4095.1.A1_at 533928 TOR1B Torsin family 1, member B (torsin B)
Bt.4095.2.S1_at 533928 TOR1B Torsin family 1, member B (torsin B)
Glycolysis 0.01526
Bt.22783.1.S1_at 281141 ENO1 Enolase 1 (alpha)
Bt.3809.1.S1_at 281274 LDHA Lactate dehydrogenase A
Bt.5345.1.S1_at 535182 MDH1 Malate dehydrogenase 1, NAD (soluble)
Bt.7915.1.S1_at 281306 MDH2 Malate dehydrogenase 2, NAD (mitochondrial)
V
OL. 16, 2009
IMMUNOLOGICAL PROFILES OF TICK-INFESTED CATTLE
1083
on August 17, 2020 by guest
http://cvi.asm.org/
WBCs of Holstein-Friesian cattle belonged to metabolic
on-tologies such as electron transport and glycolysis, which
rep-resented two KEGG pathways: oxidative phosphorylation and
the citrate cycle. The results of the microarray analysis, in
combination with other cellular parameters measured in these
animals, suggest that the Brahman cattle have developed a
predominantly T-cell-mediated response to tick infestation. It
should not, however, be discounted that any T-cell response
elicited by the Holstein-Friesian animals may be
predomi-nantly active in the skin at the site of tick attachment or in the
lymph organs draining the skin.
The higher level of tick-specific IgG1 detected in the
Hol-stein-Friesian animals than in the Brahman group in the
present study is in contrast to the results obtained by Kashino
et al. (24), who reported that tick saliva-specific IgG1 and IgG2
antibodies decreased in susceptible animals compared with
resistant animals following periods of heavy infestation. The
discrepancy in results between our study and that of Kashino et
al. (24) may be due to the length of time over which the studies
were conducted. The study by Kashino et al. collected serum
intermittently over a period of 12 to 14 months, during which
animals were exposed to natural infestations, whereas in the
TABLE 5. KEGG pathways represented by DE genes
KEGG pathway/Affymetrix probe identifier Entrez gene
identification no. Gene description P
Genes with higher expression in Brahman WBC
Hematopoietic cell lineage
0.0079
Bt.15905.1.S1_at
404154
IL-4R
␣
chain
Bt.27981.1.S1_at
407126
Complement receptor type 2
Bt.3941.1.S1_at
281861
IL-2R
␣
Bt.26922.1.S1_at
510073
Similar to T-cell antigen CD7 precursor
Bt.5368.1.S1_at
281054
Antigen CD3e, epsilon polypeptide
Cytokine-cytokine receptor interaction
0.04
Bt.12241.1.S1_at
510668
Chemokine receptor 7
Bt.15905.1.S1_at
404154
IL-4R
␣
chain
Bt.49.1.S1_at
282387
TNF (ligand) superfamily, member 5
Bt.8957.1.S1_at
281736
Chemokine (C-X-C motif) receptor 4
Bt.3941.1.S1_at
281861
IL-2R
␣
Genes with higher expression in Holstein-Friesian WBC
Oxidative phosphorylation
1.10E
⫺
09
Bt.13128.1.S1_at
286840
Succinate dehydrogenase complex, subunit b,
iron sulfur
Bt.21.1.S1_at
338046
NADH dehydrogenase (ubiquinone) 1,
subcomplex unknown, 2, 14.5 kDa
Bt.4072.1.S1_at
287014
NADH dehydrogenase (ubiquinone)
flavoprotein 1, 51 kDa
Bt.442.1.S1_at
281640
ATP synthase, H
⫹transporting, mitochondrial
f1 complex
Bt.4431.1.S1_a_at
327675
ATP synthase, H
⫹transporting, mitochondrial
f1 complex, beta polypeptide
Bt.4540.1.S1_at
327668
ATP synthase, H
⫹transporting, mitochondrial
f1 complex, gamma polypeptide 1
Bt.4704.1.S1_at
327714
NADH dehydrogenase (ubiquinone) 1 alpha
subcomplex, 5, 13 kDa
Bt.5040.1.S1_at
281570
Ubiquinol-cytochrome
c
reductase (6.4-kDa)
subunit
Bt.61.1.S1_at
338073
NADH dehydrogenase (ubiquinone) 1 beta
subcomplex, 3, 12 kDa
Bt.66.1.S1_at
338064
NADH dehydrogenase (ubiquinone) 1 alpha
subcomplex, 3, 9 kDa
Bt.67.1.S1_at
282289
NADH dehydrogenase (ubiquinone) 1,
subcomplex unknown, 1 (6 kDa)
Bt.7193.1.S1_at
282199
Cytochrome
c
oxidase subunit via polypeptide 1
Bt.848.1.S1_at
282290
NADH dehydrogenase flavoprotein 2 (24 kDa)
Bt.893.1.S1_at
327665
NADH dehydrogenase (ubiquinone) 1 beta
subcomplex, 6, 17 kDa
Bt.8950.1.S1_at
338084
Cell death regulatory protein grim19
Citrate cycle
0.037
Bt.7915.1.S1_at
281306
Malate dehydrogenase 2, mitochondrial
Bt.1311.1.S1_at
511090
Similar to succinyl coenzyme A ligase
(ADP-forming) beta chain
Bt.13128.1.S1_at
286840
Succinate dehydrogenase complex, subunit b,
iron sulfur
on August 17, 2020 by guest
http://cvi.asm.org/
present study, serum was collected over a 3-week period during
the height of artificial infestations. Cruz et al. (7) have
re-ported differences in the levels of IgG against different tick
antigens between heavy and light infestations, as well as
indi-vidual variation in humoral responses to tick antigens.
Simi-larly, our results demonstrated individual variation in IgG2
responses to tick antigen extracts, as three Holstein-Friesian
animals developed moderate to high titers of IgG2 to several
antigen extracts, while titers of other animals were not
signif-icantly higher than those of the uninfested animal control sera.
Preliminary Western blot analysis (data not shown) has
dem-onstrated that the Holstein-Friesian animals and Brahman
an-imals produce antibodies to different tick antigens. More
ex-tensive immunoblotting will be undertaken in the future to
determine whether differential recognition of tick antigens
plays a role in resistance or susceptibility to ticks.
No proliferation was detected above background levels from
PBMC stimulated with tick antigen extracts in vitro in either
breed. This result could be due to an inhibitory action of the
tick antigen extracts, as previously reported by Turni et al. (42),
who showed that addition of tick SGEs could inhibit the
pro-liferative response of cells from
B. taurus
and
B. indicus
ani-mals to ConA stimulation. The extracts of whole adult female
ticks used in the present study may have contained sufficient
quantities of SGEs (and other proteins) capable of causing
inhibition. However, a more probable reason for the lack of
response to these antigens may simply be that the
immuno-genic proteins were not present in sufficient quantities to
stim-ulate the cells in vitro. It could be assumed that any antigen
passed from the tick to the host during the larval stage would
be in such small quantities compared to those of other proteins
present in the whole larval extract that any immunogenic
tein might not be present in concentrations sufficient to
pro-duce a detectable proliferation response. As an acquired T-cell
response is critical to the development of tick-specific IgG and
most probably to host resistance to infestation, further
inves-tigation is required concerning the tick salivary antigens
pre-sented to the host immune system during feeding and their role
in initiating adaptive immunity.
Conclusion.
In conclusion, we have shown that cellular,
hu-moral, and gene expression profiles in the peripheral
circula-tion differ significantly between tick-resistant
B. indicus
and
tick-susceptible
B. taurus
cattle infested with
R. microplus.
Brahman cattle demonstrated PBMC profiles and WBC gene
expression profiles consistent with a T-cell-mediated response
to tick infestation, while Holstein-Friesian cattle demonstrated
cellular profiles consistent with an innate, inflammatory-type
response to infestation. Future experiments will be designed to
include preinfestation measurements to track the development
of the immune response throughout the development and
sta-bilization of tick resistance/susceptibility.
ACKNOWLEDGMENTS
We gratefully acknowledge funding from the Cooperative Research
Centre for Beef Genetic Technologies (BeefCRC).
We thank Tom Connolly (University of Queensland) for his care of
the animals in this project and assistance with sample collection and
Ralph Stutchbury (QDPI&F) for preparation of tick larvae. Thanks
are also extended to the University of Queensland’s Animal Genetics
Laboratory in the School of Veterinary Science for their technical
assistance and also to Helle Bielefeldt-Ohmann for critical reading of
the manuscript.
REFERENCES
1.Affymetrix.2002. Statistical algorithms description document. Technical re-port. Affymetrix, Santa Clara, CA.
2.Ashburner, M., C. Ball, J. Blake, D. Botstein, H. Butler, J. Cherry, A. Davis, K. Dolinski, S. Dwight, J. Eppig, M. Harris, D. Hill, L. Issel-Tarver, A. Kasarkis, S. Lewis, J. Matese, J. Richardson, M. Ringwald, G. Rubin, G. Sherlock, et al.2000. Gene ontology: tool for the unification of biology. Nat.
Genet.25:25–29.
3.Bolstad, B., F. Collin, J. Brettschneider, K. Simpson, L. Cope, R. Irizarry, and T. Speed.2005. Quality assessment of Affymetrix GeneChip Data, p.
33–47.InR. Gentleman, V. Carey, W. Huber, R. Irizarry, and S. Dutoit
(ed.), Bioinformatics and computational biology solutions using R and Bio-conductor. Springer, New York, NY.
4.Carvalho, W. A., G. H. Bechara, D. D. More´, B. R. Ferreira, J. S. da Silva, and I. K. F. de Miranda Santos.2008.Rhipicephalus(Boophilus)microplus: distinct acute phase proteins vary during infestations according to the genetic
composition of the bovine hosts,Bos taurusandBos indicus. Exp. Parasitol.
118:587–591.
5.Cole, D., A. Roussel, and M. Whitney.1997. Interpreting a bovine CBC:
collecting and sample and evaluating the erythron. Vet. Med.92:460–468.
6.Coussens, P. M., N. Verman, M. A. Coussens, M. D. Elftman, and A. M. McNulty.2004. Cytokine gene expression in peripheral blood mononuclear
cells and tissues of cattle infected withMycobacterium aviumsubsp.
paratu-berculosis: evidence for an inherent proinflammatory gene expression
pat-tern. Infect. Immun.72:1409–1422.
7.Cruz, A. P. R., S. S. Silva, R. T. Mattos, I. Da Silva Vaz, Jr., A. Masuda, and C. A. S. Ferreira.2008. Comparative IgG recognition of tick extracts by sera
of experimentally infested bovines. Vet. Parasitol.158:152–158.
8.Dennis, G., B. Sherman, D. Hosack, J. Yang, W. Gao, H. Lane, and R. Lempicki.2003. DAVID: database for annotation, visualization, and
inte-grated discovery. Genome Biol.4:R60.
9.Frisch, J.1994. Identification of a major gene for resistance to cattle ticks, p.
293–295.InC. Smith, J. S. Gavora, B. Benkel, J. Chesnais, W. Fairfull, J. P.
Gibson, B. W. Kennedy, and E. B. Burnside (ed.), Proceedings of the 5th World Congress on Genetics Applied to Livestock Production, Guelph, Ontario, Canada, vol. 20.
10.Frisch, J. E.1999. Towards a permanent solution for controlling cattle ticks.
Int. J. Parasitol.29:57–71.
11.Gautier, L., L. Cope, B. Bolstad, and R. Irizarry.2004. Affy—analysis of
Affymetrix GeneChip data at the probe level. Bioinformatics20:307–315.
12.Gene Ontology Consortium.2006. The Gene Ontology (GO) project in 2006.
Nucleic Acids Res.34:D322–D326.
13.Gentleman, R., V. Carey, D. Bates, B. Bolstad, M. Dettling, S. Dudoit, B. Ellis, L. Gautier, Y. Ge, J. Gentry, K. Hornik, T. Hothorn, W. Huber, S. Iacus, R. Irizarry, F. Leisch, C. Li, M. Maechler, A. Rossini, G. Sawitzki, C. Smith, G. Smyth, L. Tierney, J. Yang, and J. Zhang.2004. Bioconductor: open software development for computational biology and bioinformatics.
Genome Biol.5:R80.
14.Harrison, A., C. Johnston, and C. Orengo.2007. Establishing a major cause of discrepancy in the calibration of Affymetrix GeneChips. BMC
Bioinfor-matics8:195.
15.Hewetson, R. W.1971. Resistance by cattle to the cattle tick Boophilus microplus.III. The development of resistance to experimental infestations by purebred Sahiwal and Australian Illawarra shorthorn cattle. Aust. J. Agric.
Res.22:331–342.
16.Inokuma, H., D. H. Kemp, and P. Willadsen.1994. Comparison of
prosta-glandin-E2 (PGE2) in salivary-gland ofBoophilus microplus,Haemaphysalis
longicornisandIxodes holocyclus, and quantification of PGE2 in saliva,
he-molymph, ovary and gut ofB. microplus. J. Vet. Med. Sci.56:1217–1218.
17.Inokuma, H., R. L. Kerlin, D. H. Kemp, and P. Willadsen.1993. Effects of
cattle tick (Boophilus microplus) infestation on the bovine immune system.
Vet. Parasitol.47:107–118.
18.Irizarry, R., B. Bolstad, F. Collin, L. Cope, B. Hobbs, and T. Speed.2003. Summaries of Affymetrix GeneChip probe level data. Nucleic Acids Res.
31:e15.
19.Irizarry, R., B. Hobbs, F. Collin, Y. Beazer-Barclay, K. Antonellis, U. Scherf, and T. Speed.2003. Exploration, normalization, and summaries of high
density oligonucleotide array probe level data. Biostatistics4:249–264.
20.Jackson, L., and J. Opdebeeck.1989. The effect of antigen concentration and vaccine regimen on the immunity induced by membrane antigens from the
midgut ofBoophilus microplus. Immunology68:272–276.
21.Jonsson, N. N. 2006. The productivity effects of cattle tick (Boophilus microplus) infestation on cattle, with particular reference toBos indicus
cattle and their crosses. Vet. Parasitol.137:1–10.
22.Kanehisa, M., and S. Goto.2000. KEGG: Kyoto encyclopedia of genes and
genomes. Nucleic Acids Res.28:27–30.
23.Kanehisa, M., S. Goto, M. Hattori, K. F. Aoki-Kinoshita, M. Itoh, S. Ka-washima, T. Katayama, M. Araki, and M. Hirakawa.2006. From genomics