Subspace Pattern Recognition Method for Brain Stroke Detection
Yizhi Wu, Xieyun Xu*, and Ming-Da Zhu
Abstract—Brain stroke is a serious disease and one of the major causes of death. Stroke detection based on the frequently studied microwave imaging method is computation-intensive and not always reliable. This paper presents a stroke-detection scheme based on subspace classification technique. Specifically, the stroke is detected and located by using the intersection of the positive antenna lines, i.e. connecting the transmitter and receiver. The numerical results show that the proposed method can detect and locate blood clots efficiently.
1. INTRODUCTION
Stroke is a serious disease and one of the major causes of death [1]. In the treatment of stroke, the ability to pre-detect the presence and location of a bleeding stroke inside the skull is important. In the past few decades, microwave detection method for medical application has been widely studied [2–4], thus research and development of microwave detection of stroke is attracting more and more attention [5, 6]. The microwave imaging method [7] is intrinsically established on the simplified electromagnetic model, which is not reliable for brain stroke detection. On the other hand, the imaging algorithm in this category is always computation-intensive and time-consuming. Therefore, in recent years, the stroke detection scheme based on pattern recognition shows good prospects for further study [8–11]. Watanabe and Pakvasa in [12] suggested the subspace pattern recognition method (SPRM) as a new approach to classify and represent patterns given as elements of a vector space. Here, each class is represented by a subspace spanned by a group of basis vectors — the orthogonal components obtained by the principal component analysis. Improvements to the basic SPRM can be put under the following categories: 1) methods based on weighted orthogonal projections and 2) methods based on the rotation of subspaces.
In this paper, we propose a novel subspace classification technique, which involves two steps: 1) constructing individual basis for each class, and 2) computing the inner product of the projected testing vector. Under the Inner-product Subspace Classifier (ISC) [13] framework, a naive ISC is used as the basic classification model, where the basis for each subspace is estimated using Singular Value Decomposition (SVD) [14–16] from the training data. In addition, since data from both classes share many common features, reduced-size subspaces for each class are formed and accomplished by removing some of the close directions in the subspaces. By removing nearly common directions, this technique enhances the class separability. In this paper, we use S21 and the intersection of two antennas (a
receiving antenna, a transmitting antenna) to get the fuzzy positioning.
This paper is organized as follows. Section 2 presents the stroke detection method based on subspace pattern recognition. Section 3 shows the experimental and numerical results.
Received 10 September 2016, Accepted 28 October 2016, Scheduled 13 December 2016 * Corresponding author: Xieyun Xu (xieyun [email protected]).
2. STROKE DETECTION METHOD BASED ON SUBSPACE PATTERN RECOGNITION
The algorithm is based on the assumption that the noise-free data vector belongs to a linear subspace and the corresponding data to another linear subspace. Labeled training data are used to identify bases for these subspaces. In addition, since data from both classes share many common features, reduced size subspaces for each class are formed.
2.1. Measurement Data and Preprocessing
The original measurement data are a set of scattering matrix samples in fixed frequency. For fixed frequency ω, each element in scattering matrix with i rows of j columns is homogenization. The gain (sij(ω)) between receiving antenna i and transmit antenna j is symmetric matrix, which is sij(ω) =sji(ω). For processing data conveniently, we use the data mapped in the range of 0 to 1.
cij =sij(ω)/max(abs(sij(ω))) (1) We propose a classification problem of two types. The purpose of pattern recognition is to find the interface of the two types. The general expression is
ti=Wc0α+ (2)
where Wc0 is a matrix containing the basis vector which describes the space, and α represents the corresponding basis weight vector for the specific samplet, expressed as follows
T = ⎡ ⎢ ⎢ ⎢ ⎢ ⎢ ⎣ t1 t2 . . . td ⎤ ⎥ ⎥ ⎥ ⎥ ⎥ ⎦
, w=
⎡ ⎢ ⎢ ⎢ ⎢ ⎢ ⎣ w1 w2 . . . wd ⎤ ⎥ ⎥ ⎥ ⎥ ⎥ ⎦ (3)
is the error between the model Wc0 and the measurement t. The following decision rules can be used to solve the linear classification of two types.
Set
c=g(t) (4)
wherec is binary, i.e., c∈ {0,1} can be defined as a positive space and a negative space.
Equation (4) defines a decision variable to classify the elements by positive space and negative space.
All the training samples for one class are assembled into a matrix.
Tc= [t11, t22, . . . , tNc ] (5)
where tc is the training samples and N the number of training samples. We get S21 signals as the
training samplestc by experiments with VNA [22].
2.2. Inner-Product Subspace Classification
By singular value decomposition (SVD),Tc is decomposed into three matrices,
Tc =UΣV∗ (6)
where U is the left unitary matrix, V∗ the right unitary matrix, and Σ a diagonal matrix containing singular value of Tc in a descending order. (*) denotes the conjugate and transpose.
Singular values of Tc can be separated into two subspaces, the positive and negative subspaces.
Hence,U,Σ, V∗ can be divided into two different subspaces by SVD as follows,
Tc =
Uc U⊥
c
Σc 0
where c ∈ {0,1}, and the subscripts ‘0’ and ‘1’ refer to two subspaces, respectively. SVD is applied to Tc for the two subspaces c ∈ {0,1}, respectively, and then we can get U0 and U1. If the training
samples are fixed,U0 and U1 are also unique.
Given basisU0, U1 and training datat, the discrimination rule is defined by
g(t) =
+1, δ(t) +ω0 >0
−1, δ(t) +ω0 >0
(8a)
where
δ(t) =Us0Us∗0t 2− U
s1Us∗1t 2
=t∗Us0Us∗0t−t∗Us1Us∗1t (8b)
In the above formula,U andV are both unitary matrices. SoU0∗U0 =U1∗U1 =E. A nonzero value
of the decision offset ω0 in Eq. (8a) can be used to bias the detection toward class +1 if ω0 > 0 and
toward class −1 ifω0 <0.
Since the bases of the two classes are derived from samples of data which are noisy, the estimated bases will be perturbed. Signal directions in the two signal subspaces which are nearly collinear will particularly lead to a high variability of the outcome of the classifier. Hence, dimension in the two signal spaces which are nearly collinear are removed.
2.3. A Complexity Reduced Approximation
This is accomplished by removing some of the directions in the subspaces that have the smallest angles between them. The principle of detection in the algorithm is based on projecting the data sample under test onto the two reduced subspaces and calculating the Euclidean distance of the projected data sample. The principal angles θk betweenU0 and U1 are defined as:
cos(θk) = max
μ∈U0maxυ∈U1μ
Tυ
Subject to:
||μ||=||υ||= 1
μTμ
i=υTυi= 0, i= 1, . . . , k−1 (9)
The SVD decomposition of the matrix productU0TU1 readily yields a solution to the principal angle
problem.
Algorithm
Note: in this algorithm, the intermediate basis is called Qi, i = 0,1. The notation Ui, i= 0,1 is used to denote the final constructed basis for classi.
• Let the columns of T0 and T1 be vectors spanning subspace 0 and 1 respectively
andN0 ≥N1 be the dimensions of T0 and T1 respectively;
• Compute the real(T):
T0 = real(T0)
T1 = real(T1)
(10)
• Construct matrixH: H=QT0Q1
• Compute the SVD ofH
YTHZ = ⎡ ⎢ ⎢ ⎢ ⎢ ⎣
cos(θ1) . . . 0
0 0
0 . . . cos(θk)
0 ... 0
0 0 0
⎤ ⎥ ⎥ ⎥ ⎥ ⎦=
⎡ ⎢ ⎢ ⎢ ⎢ ⎣
1 . . . 0
0 1 0
0 . . . cos(θk)
0 ... 0
0 0 0
⎤ ⎥ ⎥ ⎥ ⎥
⎦ (11)
whereθk is the principal angles and 1≥cos(θ1). . .≥cos(θk)≥0 after removing bases
with the cos(θs) = 1 is given by
Us0 = [us+1, us+2, . . . , uN] Us1 = [us+1, us+2, . . . , uN]
(12)
The rule can be interpreted as follows. The data vector x is projected onto the subspaces spanned by the matrices Us0 and Us1, respectively. The label is selected
according to which of the projected vectors have the largest Euclidean length. The largest distance determines which class is selected, i.e., if a stroke brain is detected or not. A decision offset can be introduced to change the performance of the detector and improve the probability of detection.
3. NUMERICAL RESULTS
We have made two consecutive explorative proofs of principle studies, with the two different prototypes. While aiming for a microwave-based investigation as early upon onset of the stroke as possible, the experiment environment factors of the study are ignored.
3.1. Experiment Study
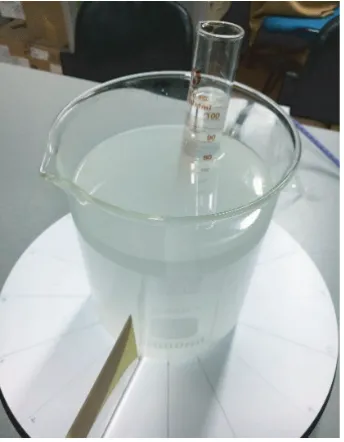
The first study is performed by spectrum analyzer. The beaker is filled with a mixture of glycerin, water, and sugar, as shown in Fig. 1. The cylinder is filled with water. The set with ‘water’ is indicated to the case that the cylinder is placed in the beaker, while the case ‘no-water’ means that the cylinder is removed from the beaker. Antennas are used to collect data from the water case and no-water case, and then the algorithm is aimed at separating all 16 water case data from 16 samples with a ‘no-water’ case.
might lead to a larger range of δ(t). The δ values of the water case range from 3 to 11, and those of no-water case range from 0 to 3. Therefore, the value ofω0 is set to 3.
In Fig. 2, we summarize the main results from this study, which shows the averaged squared subspace distance difference for each example based on subspace pattern recognition method. It is shown in Fig. 2 that we can distinguish ‘water’ case from ‘no-water’ case easily with a proper δ set.
3.2. First Simulation Study
In this paper, we use FDTD [17–19] simulation for both the detection signal acquirement and reference signal generation. In FDTD, we use Gaussian RF pulse with 2.5 GHz center frequency and 50% relative bandwidth as the excitation.
As shown in [20], the brain model consists of 256× 256 cubical elements with dimensions of 1 mm×1 mm respectively. The dielectric properties of different types of tissues including skin, skull, fat, blood, dura, cerebral spinal fluid (CSF), grey and white matter can be found in [21] and initiated in the brain model.
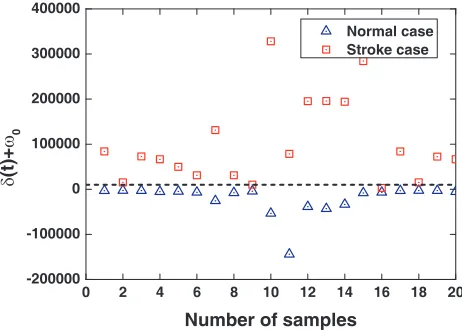
The first simulation study use 16 antennas surrounding the brain. The available data are grouped into two classes. In each case, all measurements from examples with a bleeding stroke form one class. The second class is formed by healthy subjects. We refer to these test cases as ‘stroke’ and ‘normal’.
The results from the detection is shown in Fig. 3 where the upper scatter is stroke case, and the lower scatter is normal case. Fig. 3 indicates that eighteen out of 20 stroke cases are separated from the normal case whereas two are not.
0 2 4 6 8 10 12 14 16
0.0002 0.0003 0.0004 0.0005 0.0006 0.0007 0.0008 0.0009 0.0010 0.0011
δ
(t)
+
ω0
Number of samples
Normal case Stroke case
Figure 2. Illustration of the distribution of the decision variable, and the difference between the squared subspaces distances evaluated for all examples in subspace pattern recognition method.
0 2 4 6 8 10 12 14 16 18 20
-200000 -100000 0 100000 200000 300000 400000
δ
(t)+
ω0
Number of samples
Normal case Stroke case
Figure 3. Illustration of the distribution of the decision variable, and the difference between the squared subspaces distances evaluated for all examples in subspace pattern recognition method.
3.3. Second Simulation Study
In the second simulation study, 16 positons to locating the transmitting and receiving antenna pair are evenly distributed around the brain, where the angle between the adjacent positons is 22.5◦. We get the 20 group data for normal case by only changing the white matter of the dielectric constant, which is shown in Fig. 4(a). Another 20 group data for stroke patients are obtained by sampling head simulation diagram with FDTD. By above settings, we can get the effective value of the δ(x) groups and locate the blood clot.
(a) (b)
Figure 4. Head simulation diagram. (a) Simulation diagram without blood clot. (b) Simulation diagram with blood which is on the line segment between the receiving and transmitting antennas.
0 2 4 6 8 10 12 14 16 18 20
-1.5 -1.0 -0.5 0.0 0.5 1.0 1.5
δ
(t)+
ω0
Number of samples
Normal case Stroke case
0 2 4 6 8 10 12 14 16 18 20
-5 -4 -3 -2 -1 0 1
δ
(x)
+
ω0
Number of samples
Normal case Stroke case
0 5 10 15 20
20 40 60 80 100 120 140 160
Normal case Stroke case
δ
(x)
+
ω0
Number of samples
(c)
(a) (b)
0 2 4 6 8 10 12 14 16 18 20
-200 -150 -100 -50 0 50 100 150 200
δ
(t)+
ω0
Number of samples
Normal case Stroke case
(d)
Fig. 5 that the averaged squared subspace distance where the blood clot is on the line segment between the receiving and transmitting antennas is larger than the one where the blood clot is not. So that we can judge the presence of blood in Fig. 5 and can largely locate the blood clot in the intersection of the antenna pair at positions 2 and 10, and positions 8 and 16. For instance, in Fig. 5(d), the δ values of the stroke case range from 160 to 190, and those of the normal case range from −190 to −220. So we set the value of ω0 to 0, which can perfectly classify the two cases.
4. CONCLUSION
This paper presents a microwave brain-diagnostic technique based on subspace pattern recognition and the associated proof-of-principle experiments. The paper shows that the systems can differentiate stroke patients from normal ones and detect the position of blood clots by the antenna-pair line. The system is based on microware scattering models with antenna worn on head. Collected data are analyzed with a pattern recognition algorithm based on training data simulation and tomography head model. The numerical results show that the proposed method can detect and locate blood clots efficiently. The simulation results show the effectiveness of the schema. Thus, potable even wearable microwave device can be developed for the mobile medical application.
ACKNOWLEDGMENT
The authors acknowledge the financial support from Science and technology commission of Shanghai, China (SSTEC) with Grand ID 14510711600and the National Natural Science Foundation of China under Grant 61301029.
REFERENCES
1. Irishina, N. and A. Torrente, “Brain stroke detection by microwaves using prior information from clinical databases,” Abstract and Applied Analysis, Vol. 2013, Article ID 412638, 8 pages, 2013. 2. AlShehri, S. A. and S. Khatun, “UWB imaging for breast cancer detection using neural network,”
Progress In Electromagnetics Research C, Vol. 7, 79–93, 2009.
3. Shao, W. and B. Zhou, “UWB microwave imaging for breast tumor detection in inhomogeneous tissue,” Proceedings of the 2005 IEEE Engineering in Medicine and Biology, 27th Annual Conference, 1496–1499, Shanghai, China, 2005.
4. Sill, J. M. and E. C. Fear, “Tissue sensing adaptive radar for breast cancer detection-experimental investigation of simple tumor models,” IEEE Transactions on Microwave Theory and Techniques, Vol. 53, No. 11, 3312–3319, Nov. 2005.
5. Ireland, D. and M. E. Bialkowski, “Microwave head imaging for stroke detection,” Progress In Electromagnetics Research M, Vol. 21, 163–175, 2011.
6. Mobashsher, T., A. M. Abbosh, and Y. Wang, “Microwave system to detect traumatic brain injuries using compact unidirectional antenna and wideband transceiver with verification on realistic head phantom,” IEEE Transactions on Microwave Theory and Techniques, Vol. 62, No. 9, 1826–1836, Sep. 2014.
7. Donelli, M. and A. Massa, “Computational approach based on a particle swarm optimizer for microwave imaging of two-dimensional dielectric scatterers,” IEEE Transactions on Microwave Theory And Techniques, Vol. 53, No. 5, 1761–1776, May 2005.
8. Persson, M., A. Fhager, H. Trefna, Y. Yu, T. McKelvey, G. Pegenius, et al., “Microwave-based stroke diagnosis making global pre-hospital thrombolytic treatment possible,”IEEE Transactions on Biomedical Engineering, Vol. 61, 2806–2817, Nov. 2014.
10. Mustafa, S., A. Abbosh, B. Henin, and D. Ireland, “Brain stroke detection using continuous wavelets transform matching filters,” Biomedical Engineering Conference (CIBEC), 2012 Cairo International, 194–197, 2012.
11. Khorshidi, M. A., T. McKelvey, M. Persson, and H. D. Trefna, “Classification of microwave scattering data based on a subspace distance with application to detection of bleeding stroke,” 3rd IEEE International Workshop on Computational Advances in Multi-Sensor Adaptive Processing, 301–304, 2009.
12. Watanabe, S. and N. Pakvasa, “Subspace method in pattern recognition,” Proc. Int. Joint Conf. Pattern Recognition, 25–32, 1973.
13. Yu, Y. and T. McKelvey, “Unified subspace classification framework developed for diagnostic system using microwave signal,” 231st Eur. Signal Process. Conf., Marrakech, Marocco, Sep. 2013. 14. Yu, Y., “Classification of high dimensional signals with small training sample size with applications towards microwave based detection systems,” Lic. Thesis, Chalmers Univ. Technol., G¨oteborg, Sweden, 2013.
15. Yu, Y. and T. McKelvey, “A unified subspace classification framework developed for dlagnostic system using microwave signal,” European Signal Processing Conference, 2219–5491, 2013.
16. Golub, G. H. and C. F. Van Loan, Matrix Computations, 2nd edition, Johns Hopkins Univ. Press, 1989.
17. Ireland, D. and A. Abbosh, “Modeling human head at microwave frequencies using optimized debye models and FDTD method,” IEEE Transactions on Antennas And Propagation, Vol. 61, No. 4, 2352–2355, Apr. 2013.
18. Ireland, D. and M. E. Bialkowski, “Microwave head imaging for stroke detection,” Progress In Electromagnetics Research M, Vol. 21, 163–175, 2011.
19. Ireland, D. and M. E. Bialkowski, “Feasibility study on microwave stroke detection using a realistic phantom and the FDTD method,”Proc. Asia-Pacific Microwave Conf., 1–4, 2010.
20. Zubal, G., C. R. Harrell, E. O. Smith, Z. Rattner, G. Gindi, and P. B. Hoffer, “Computerized three-dimensional segmented human anatomy,”Medical physics, Vol. 21, 299–302, 1994.
21. Gabriel, S., R. Lau, and C. Gabriel, “The dielectric properties of biological tissues: II. Measurements in the frequency range 10 Hz to 20 GHz,”Physics in Medicine and Biology, Vol. 41, 2251, 1996.