Western University Western University
Scholarship@Western
Scholarship@Western
Electronic Thesis and Dissertation Repository
8-20-2014 12:00 AM
Solid-phase Extraction as Sample Preparation for Bioassay-based
Solid-phase Extraction as Sample Preparation for Bioassay-based
Micropollutant Quantification
Micropollutant Quantification
Chen FengThe University of Western Ontario
Supervisor Dr. Mita Ray
The University of Western Ontario Joint Supervisor Dr. Lars Rehmann
The University of Western Ontario
Graduate Program in Chemical and Biochemical Engineering
A thesis submitted in partial fulfillment of the requirements for the degree in Master of Engineering Science
© Chen Feng 2014
Follow this and additional works at: https://ir.lib.uwo.ca/etd
Part of the Biochemical and Biomolecular Engineering Commons, and the Environmental Engineering Commons
Recommended Citation Recommended Citation
Feng, Chen, "Solid-phase Extraction as Sample Preparation for Bioassay-based Micropollutant Quantification" (2014). Electronic Thesis and Dissertation Repository. 2363.
https://ir.lib.uwo.ca/etd/2363
This Dissertation/Thesis is brought to you for free and open access by Scholarship@Western. It has been accepted for inclusion in Electronic Thesis and Dissertation Repository by an authorized administrator of
SOLID-PHASE EXTRACTION AS SAMPLE PREPARATION
FOR BIOASSAY-BASED MICROPOLLUTANT
QUANTIFICATION
by
Chen Feng
Graduate Program in Engineering Science Department of Chemical and Biochemical Engineering
A thesis submitted in partial fulfillment of the requirements for the degree of
Master in Engineering Science
The School of Graduate and Postdoctoral Studies The University of Western Ontario
London, Ontario, Canada
Abstract
Solid phase extraction (SPE) using chemically bonded silica particles or small particles of an organic polymer resin, is being studied extensively for extraction of polar or non-‐polar compounds from various water matrices. This study focused on the evaluation of the performance of three commercial cartridges belonging to three different groups: reversed-‐phase, mixed-‐mode anion exchanger and mixed-‐mode cation exchanger. In the first stage of research, the performance of three cartridges was compared by extracting four antibiotics with different physic-‐chemical properties from water samples. The results obtained from column sorption experiments were plotted into breakthrough curves and batch equilibrium experiments results were fitted into Langmuir and Freundlich isotherms. Based on the parameters obtained from these plots, Oasis MCX was determined to be the best cartridges of the three for various analyte extractions. The recovery efficiency of each cartridge was studied by eluting the sorbent with acetone. The recovery of LC-‐ 18 sorbent was between 72% ~ 104% depending on the compounds, while both Oasis MAX and MCX cartridge can achieve approximately 100% recoveries.
Keywords
Solid phase extraction, estradiol, antibiotics, Ames test, YES assay, HPLC analysis
Acknowledgement
I would like to extend my deepest gratitude to my supervisors, Dr. Mita Ray and Dr. Lars Rehmann, for their support and guidance. Thank you for keeping my research interesting, diversified and challenging. I am also grateful for your endless patience, generosity and support. I could not have asked for better mentors.
To Erin Johnson, thank you for everything you have taught me about HPLC and answering all of my questions, even if I had already asked them before. Without your help I could have never completed my thesis.
Many thanks go to Sura Ali for teaching me how to conduct both bioassays. Your experience helped me save a lot of time in my research.
I would like to thank all my colleagues in the lab, especially Tulip Chakraborty, Jun-‐ woo Kim and Kai Gao, for making the experience of working in the lab thoroughly enjoyable.
Finally, my most heartfelt thanks go to my dear parents for inspiring me to follow my dreams, and for their encouragement during the hard time.
Table of Contents
Abstract ……….. ii
Acknowledgement ……….. iv
Table of Contents ………... v
List of Tables ………. vii
List of Figures ………. x
List of Abbreviations ……… xii
Chapter 1 ……… 1
1 Introduction ………... 1
1.1 Background ………...1
Reference………..….. 5
Chapter 2 ……… 8
2 Literature Review ………. 8
2.1 Background ……….………. 8
2.2 Sample preparation ………... 9
2.2.1 SPE ……….……….. 9
2.2.2 Format of SPE ………. 11
2.2.3 Sorbent Selection ………. 16
2.2.4 New trends of sorbent in solid-‐phase extraction ………. 23
2.2.5 Overview of SPE Procedure……… 27
2.3 Model Compound……… 29
2.4 Mutagenicity Analysis of Water………. 32
2.4.1 The Ames Test……….. 33
2.5 Yeast Estrogen Screen………. 36
2.6 Summary of Literature Review and Literature Gaps……… 37
Reference..………... 38
Chapter 3……….. 48
3.1 Introduction……….. 48
3.2 Laboratory experiments – conception and objectives……… 49
3.2.1 Reagents……….….… 50
3.2.2 Batch sorption experiments……… 50
3.2.2.1 Experimental set-‐up and procedure………... 51
3.2.3 Column experiments……… 52
3.2.3.1 Column apparatus and experimental set-‐up………. 52
3.2.3.2 Experimental procedure……… 53
3.3 Results and Discussions..……….. 54
3.3.1 Adsorption isotherms of antibiotics………... 54
3.3.1.1 Effect of concentration……….... 54
3.3.1.2 Adsorption isotherms……….. 58
3.3.2 Breakthrough of the cartridges………. 64
3.3.3 Recovery studies……… 69
3.4 Error analysis …………..……… 71
3.5 Conclusions and Summary for Solid Phase Extraction Application………. 72
Reference .………... 73
Chapter 4……….. 82
4 Assessment of the Mutagenicity and Estrogenicity of River Water and Wastewater Secondary Effluent Following SPE treatment………... 82
4.1 Introduction………... 82
4.2 Materials and Methods……… 84
4.2.1 Chemicals……… 84
4.2.2 Sample collection and preparation………. 85
4.2.3 Instrumental analysis………. 86
4.2.4 Ames fluctuation assay……….. 89
4.2.5 Yeast Estrogen Screen assay……….. 90
4.2.5.1 YES assay Procedures………. 90
4.2.5.2 YES assay Calculation and Sample Response………... 91
4.3.1 Determination of estradiol in liquid chromatography and YES
assay……… 93
4.3.2 Recovery test of Oasis MCX in surface water and wastewater matrices………... 96
4.3.2.1 Recovery in liquid chromatography………. 96
4.3.2.2 Recovery in YES bioassays……….. 98
4.3.3 Mutagenicity of Wastewater in London……….100
4.4 Conclusions………,,102
Reference..……… 103
Chapter 5………... 106
5 Conclusions and Recommendations……… 106
5.1 Conclusions………. 106
5.2 Recommendations……….. 108
Curriculum Vitae ………. 109
List of Tables
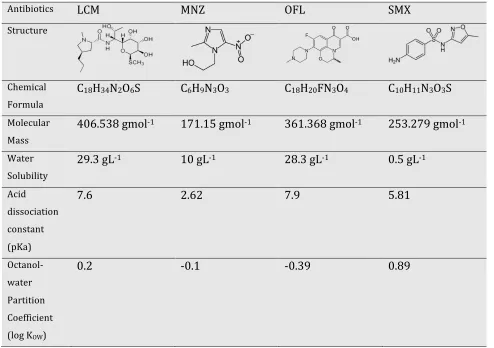
Table 2.1 General properties of LCM, MNZ, OFL and SMX………. 30
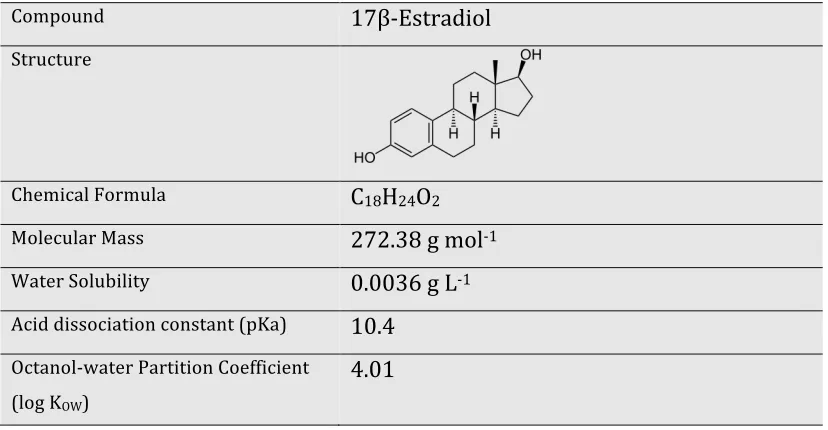
Table 2.2 General properties of E2……….. 31
Table 3.1 Physical properties of Oasis MAX, MCX and LC-‐18 cartridges……….. 53
Table 3.2 The equilibrium uptake capacities and extent of adsorption of LCM obtained at different initial concentrations ………....………....…….. 57
Table 3.3 The equilibrium uptake capacities and extent of adsorption of MNZ obtained at different initial concentrations.………...………....……... 57
Table 3.4 The equilibrium uptake capacities and extent of adsorption of OFL obtained at different initial concentrations.………....…….. 58
Table 3.5 The equilibrium uptake capacities and extent of adsorption of SMX obtained at different initial concentrations.………....………...…... 58
Table 3.6 Langmuir and Freundlich coefficients for LCM on MAX, MCX and LC-‐ 18 .………....………....………... 62
Table 3.7 Langmuir and Freundlich coefficients for MNZ on MAX, MCX and LC-‐ 18 …………..………....………....……….. 62
Table 3.8 Langmuir and Freundlich coefficients for OFL on MAX, MCX and LC-‐ 18 ………….………....………....………... 62
Table 3.9 Langmuir and Freundlich coefficients for SMX on MAX, MCX and LC-‐ 18 …………..………....………....………... 63
Table 3.10 Qmax values of LCM, MNZ, OFL, and SMX on different sorbents………. 64
Table 3.11 Parameters determined for SMX on different sorbents………..67
Table 3.12 Parameters determined for MNZ on different sorbents.……….……….. 67
Table 3.13 Parameters determined for OFL on different sorbents.……….……… 67
Table 3.14 Parameters determined for LCM on different sorbents..…….………. 68
Table 3.15 Absorptive capacities (mg g-‐1).………...………... 69
Table 3.16 Recovery of LCM in MAX, MCX and LC-‐18 column.………... 70
Table 3.17 Recovery of MNZ in MAX, MCX and LC-‐18 column.……….…..……... 70
Table 3.19 Recovery of SMX in MAX, MCX and LC-‐18 column.……….…...………... 71 Table 3.20 Relative standard deviation of the experiment data ……….. 71 Table 4.1 Main method parameters of the HPLC analysis………....……. 93 Table 4.2 Recovery of E2 standard in Oasis MCX cartridges in surface water samples measured by HPLC.………....………....………... 98 Table 4.3 Estrogenic activity of E2 in surface and wastewater determined by YES assay and the recovery of MCX sorbent.…....……….. 99
List of Figures
Figure 2.1(a): The SPE column……….………..12
Figure 2.1(b): The SPE disc ……….….12
Figure 2.2 Apparatus of the first commercial SPME device (Supelco) ……… 15
Figure 2.3 Mode of fiber SPME operation ………. 15
Figure 2.4. Method selection guide for the isolation of organic compounds from solution ……….18
Figure 2.5 The functional group of LC-‐18 (Supelclean) ………. 20
Figure 2.6 The structure of Oasis (a) MAX and (b) MCX sorbent ………. 21
Figure 2.7 Micelles, hemimicelles and admicelles structures………. 23
Figure 2.8 The common setup and working principle of electrospinning……….. 25
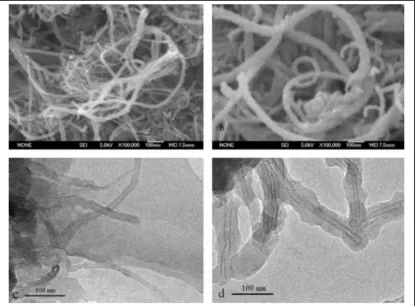
Figure 2.9 Scanning electronic and transmission electronic micrographs of crude multi-‐walled carbon nanotubes (MWCNTs) and MWCNT-‐molecularly-‐imprinted polymer (MIP)……….. 26
Figure 2.10 Typical procedure of SPE……… 27
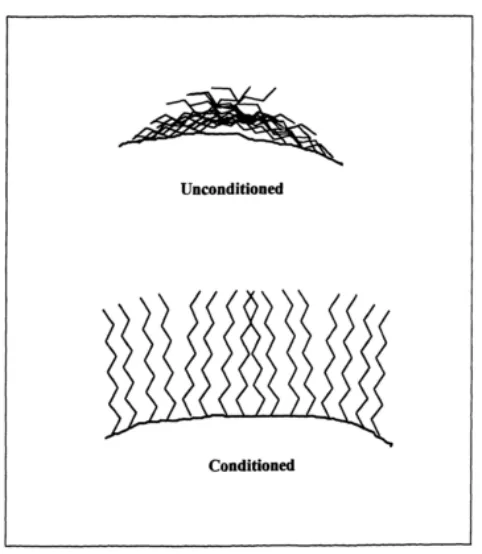
Figure 2.11 Impact of conditioning………....………....……. 28
Figure 2.12 Frame-‐shift mutation mechanism………....……..……….. 34
Figure 2.13 Base pair substitution resulting in a missense mutation……… 34
Figure 3.1 Flowchart for batch equilibrium adsorption experiments……… 52
Figure 3.2 Experimental set-‐up for continuous column operation………...53
Figure 3.3 Removal profiles of LCM, MNZ, OFL and SMX in LC-‐18, MAX and MCX columns ………....………....……….. 55
Figure 3.4 Adsorption isotherms of LCM, MNZ, OFL and SMX in LC-‐18, MAX and MCX columns ………....………....………... 56
Figure 3.5 Langmuir isotherm plots of LCM, MNZ, OFL and SMX in LC-‐18, MAX and MCX columns ………....………...………….. 60
Figure 3.6 Freundlich isotherm plots of LCM, MNZ, OFL and SMX in LC-‐18, MAX and MCX columns ………....………....………... 61
List of Abbreviations
%E = the percent of analytes being extracted from one phase into another µg = microgram
µg L-‐1 = microgram per liter
μm = micrometer Å = porosity
a = baseline response A0 = initial UV absorbance
Asp = peak areas of spiked E2 standards
Ansp = peak area of non-‐spiked sample
b = maximum response
C18 = silica based chromatography column coated with a C18 polymer CH = cyclohexane
C8 = silica based chromatography column coated with a C8 polymer C2 = silica based chromatography column coated with a C2 polymer Ctheoretical = theoretical concentration of E2
CE2 = concentration of E2
C* = aqueous-‐phase concentration at equilibrium
C0 = the initial concentration of the micropollutant in solution
CMC = critical micellar concentration CNT = carbon nanotubes
CE = capillary electrophoresis E2 = 17β-‐estradiol
EEQ = equivalent estradiol concentration EC50 = half-‐maximal effect concentration EDCs = endocrine disrupting compound g mol-‐1 = gram per mole
g L-‐1 = gram per liter
GC-‐MS = gas chromatography-‐mass spectrometry hER = human estrogen receptor
HPLC = high performance liquid chromatography KD = distribution coefficient
KOW = octanol-‐water partition coefficient
LC-‐18 = silica based chromatography column coated with a LC-‐18 polymer LLE = liquid-‐liquid extraction
LD = liquid desorption LCM = lincomycin m = hill slop
mg mL-‐1 = milligram per milliliter
mg L-‐1 = milligram per lite
m2 g-‐1 = square meter per gram
ME = amount of analytes eluted from the SPE devices
ML = amount of analytes adsorbed onto the SPE devices
MAX = mixed-‐mode anion exchange sorbent MCX = mixed-‐mode cation exchange sorbent MIP = molecularly-‐imprinted polymer MNZ = metronidazole
MWCNT = multi-‐walled carbon nanotube ng L-‐1 = nanogram per liter
N = theoretical plates number
NF = electrospun polymer nanofibers OFL = ofloxacin
ppt = one part per trillion ppb = parts-‐per-‐billion
pKa = acid dissociation constant
PDMS = polydimethylsiloxane polymer PH = phenyl
R = absolute recovery R2 = regression coefficient
SBSE = stir-‐bar sorptive extraction SMX = sulfamethoxazole
SPE = solid phase extraction
SPME = solid-‐phase microextraction TD = thermal desorption
VB = breakthrough volume
VR = chromatographic elution volume
VC = sample volume when the concentration of the analyte at the outlet equals to C0
V = volume of the solution
VOC = volatile organic compound W = absorption weight
Chapter 1
1. Introduction
1.1 Background
Water, as a natural resource, is valuable throughout the world, especially in the regions experiencing significant industrialization and urbanization due to population expansion. Deforestation and man-‐made pollution are inflicting tremendous pressure on the depletion of freshwater resources. World Health Organization (WHO, 2004) reported a nearly 2 million death rate caused by waterborne diarrheal diseases each year. 88% of these deaths are a result of drinking unsafe water, inadequate sanitation, and poor hygiene. To use the
freshwater sustainably, a “radical rethink” of policies to manage competing claims has been suggested (Reuters, 2012). A long-‐lasting sustainability of safe water supply is regulated by stringent protection and management of water sources and an efficient reclamation of used water from different effluents. However, various organic compounds such as pharmaceuticals and personal care products (PPCPs), which can include prescription drugs and nutraceuticals, fragrances and sunscreen products, etc. were reported to be found in numerous wastewater effluents and aquatic systems. Other than PPCPs, endocrine-‐disrupting chemicals (EDCs) were also reported and found to affect the aquatic habitat (Caliman & Gavrilescu, 2009; Onesios et al., 2009; Li et al., 2010). At present, there are no legal regulations
established for the discharge of these persistent, omnipresent and biologically active substances into surface water bodies (Verlicchi et al., 2012; Fürhacker, 2008; Salgot et al., 2006; Ternes et al., 2007). The concentrations of PPCPs and EDCs in raw wastewater are generally in the range of 10-‐3 to 10-‐6 mgL-‐1 (Chen et al., 2007;
an acute toxicity to human health and the environment, long-‐term exposure to these substances might adversely impact aquatic and terrestrial ecosystems and human health (Environment Canada, 2009). For instance, investigations have shown an epidemiologic link between genotoxic substances in drinking water intake and an increasing trend in certain cancers (Koivusalo et al., 1997). Ethynylestradiol (EE2), the main components in oral contraceptive pills for birth control and hormone therapy, has been shown to result in the induction of female-‐specific proteins in male fish (Tyler & Routledge, 1998), reduced sperm counts (Haubruge et al., 2000; Woods & Kumar, 2011), feminize wild fish populations, (Papoulias et al., 2000; Larsson et al., 2000) and prevalence of intersexuality. So, it is vital to detect and monitor the appearance and concentrations of these micropollutants in various effluents and aquatic environments.
Because of the intricacy of ecosystems and the difficulties of the potential impacts of the anthropogenic pollutants to be quantified, various bioassays have been
developed over the years to address different aspects of environmental pollution. Bioassays use simple biological systems to simulate the immediate effect of a compound or mixtures of compounds on living organisms (Murphy et al., 2009). It relies on detecting the response of organisms exposed to micropollutants relative to a control (Rizzo, 2011). In contrast to chemical analysis, the results of bioassays reflect biological responses instead of just chemical concentrations. However, different compounds have different levels at which acute toxicity occurs, similarly each bioassay only responds to a given concentration of the contaminant. Therefore, current bioassays need to be modified to detect low concentrations of target
compounds or their mixtures in aqueous streams.
2008). A proper sample preparation method would assist the detection and reduce the time and cost of the bioassays.
Considerable pre-‐concentration technologies have been used for bioassays such as solid phase extraction, continuous liquid-‐liquid extraction (Lippincott et al., 1989), supercritical fluid extraction (Wolfe et al., 1994) and hollow fiber-‐liquid phase micro-‐extraction (Kim et al., 2012). Solid phase extraction (SPE) is the most conventional and frequently used technique for isolation, concentration, clean-‐up and medium exchange for trace organics (Kim et al., 2012). Compared with other extraction techniques, SPE has the advantages of simplicity, rapidity and high recovery. It also requires low consumption of organic solvents, which reduces the cost of the extraction. Furthermore, SPE may be successfully used in combination with some analytical methods such as Gas Chromatography (GC) and Gas
Chromatography-‐Mass Spectrometry (GC-‐MS) for a variety of compounds (Caliman & Gavrilescu, 2009).
Various sampling formats and sorbents have been developed and modified over time to facilitate the suitable processing of different samples and to extend the scopes of the technique. In the early 1980s, disposable cartridges packed with silica-‐ based chemically bonded sorbents started to be used in the laboratory (Poole, 2003). SPE cartridges are devices that sorbents with different nominal particle sizes and different properties are packed between porous plastic frits in short columns
(generally an open syringe barrel). Nowadays, numerous commercial SPE cartridges are available in the market. However, the data on the sorption properties of
different types of popular commercial SPE columns are very limited. In addition, the sorption isotherms have been restricted to a relatively high concentration range of the analytes (Foo & Hameed, 2010). Isotherm fitting needs to be better examined and statistically tested at low concentrations. Finally, an optimized SPE procedure is always required for different environmental samples being tested in different
Objectives of the Present Study
Based on the above, further research and development are required in both solid phase extraction optimization and application of the SPE procedures in water
quality evaluation. The objective of this work was to address both issues, specifically to (i) determine adsorption parameters for selected micropollutants on various commercial cartridges and determine relationship with common physico-‐chemical properties such as acid dissociation constant (pKa), octanol-‐water coefficient, and solubility, (ii) optimize the sample concentration procedures for the selected SPE cartridges, and (iii) apply the optimized SPE procedures in two different bioassays, the Ames Test and the yeast estrogen screen (YES) test, to determine the effect of environmental matrices on SPE extraction.
Overview of Dissertation
This thesis is divided into the following chapters:
Chapter 1 provides the background and the objectives of the research.
Chapter 2 presents a literature review of the relevant theories for the stages in the research project.
Chapter 3 describes the first stage of the research, in which the properties of three different cartridges were evaluated by using four antibiotics as the model
compounds in both column and batch sorption experiments.
Chapter 4 discusses the second stage of the research where the toxicity using two bioassays is compared for the environmental water samples after being extracted by the optimized SPE cartridge and procedure.
Reference
Asker, Susanne. 2011. “Ecotoxicological Test Methodology for Environmental Screening of the European Water Framework Directive’S Priority Substances Adjusted to Swedish Regional Conditions.”
Caliman, F A, M Gavrilescu, Florentina Anca Caliman, Maria Gavrilescu, Gheorghe Asachi Technical Univer-‐, and Environmental Protec-‐. 2009. “Review
Pharmaceuticals , Personal Care Products and Endocrine Disrupting Agents in the Environment – A Review” Clean 37: 277–303.
Chen, Pei-‐Jen, Erik J Rosenfeldt, Seth W Kullman, David E Hinton, and Karl G Linden. 2007. “Biological Assessments of a Mixture of Endocrine Disruptors at
Environmentally Relevant Concentrations in Water Following UV/H2O2 Oxidation.” The Science of the Total Environment 376 (1-‐3) (April 15): 18–26.
Chen, Yi, Zhenpeng Guo, Xiaoyu Wang, and Changgui Qiu. 2008. “Sample
Preparation.” Journal of Chromatography. A 1184 (1-‐2) (March 14): 191–219.
Environment Canada. (2009, March 12). Pharmaceuticals and Personal Care Products in the Canadian Environment: Research and Policy Directions. Retrieved from http://www.ec.gc.ca/inre-‐
nwri/default.asp?lang=En&n=C00A589F-‐ 1&offset=3&toc=show
Foo, K.Y. and Hameed, B.H. 2010. " Insights into the modeling of adsorption isotherm systems." Chemical Engineering Journal. 156(1): 2-‐10.
Fürhacker, M. 2008. “The Water Framework Directive -‐Can We Reach the Target?”
Water Science and Technology : A Journal of the International Association on Water Pollution Research 57 (1) (January): 9–17.
Haubruge, E, F Petit, and M J Gage. 2000. “Reduced Sperm Counts in Guppies (Poecilia Reticulata) Following Exposure to Low Levels of Tributyltin and Bisphenol A.” Proceedings. Biological Sciences / The Royal Society 267 (1459) (November 22): 2333–2337.
Kim, Hyun Y., Jiho Lee, Myun J. Lee, Seung H. Yu, and Sang Don Kim. 2012. “The Application of Hollow Fibre-‐Liquid Phase Micro-‐Extraction on the Bioassay Experiment of Oestrogen Chemicals.” International Journal of Environmental Analytical Chemistry 92 (3) (March 15): 255–267.
Larsson, D.G.J, M Adolfsson-‐Erici, J Parkkonen, M Pettersson, a.H Berg, P.-‐E Olsson, and L Förlin. 1999. “Ethinyloestradiol — an Undesired Fish Contraceptive?”
Aquatic Toxicology 45 (2-‐3) (April): 91–97.
Le-‐Minh, N, S J Khan, J E Drewes, and R M Stuetz. 2010. “Fate of Antibiotics during Municipal Water Recycling Treatment Processes.” Water Research 44 (15) (August): 4295–323.
Li, Hongxia, Paul a Helm, and Chris D Metcalfe. 2010. “Sampling in the Great Lakes for Pharmaceuticals, Personal Care Products, and Endocrine-‐Disrupting Substances Using the Passive Polar Organic Chemical Integrative Sampler.”
Environmental Toxicology and Chemistry / SETAC 29 (4) (April): 751–762.
Murphy, Margaret B. 2009. “Use of in Vivo and in Vitro Bioassays for Environmental Monitoring.”
Onesios, Kathryn M, Jim T Yu, and Edward J Bouwer. 2009. “Biodegradation and Removal of Pharmaceuticals and Personal Care Products in Treatment Systems: A Review.” Biodegradation 20 (4) (July): 441–466.
Papoulias, Diana M, Douglas B Noltie, and Donald E Tillitt. 1999. “An in Vivo Model Fish System to Test Chemical Effects on Sexual Differentiation and
Development : Exposure to Ethinyl Estradiol” Aquatic Toxicology 48: 37–50.
Poole, Colin F. 2003. “New Trends in Solid-‐Phase Extraction.” TrAC Trends in Analytical Chemistry 22 (6) (June): 362–373.
Reuters. (2012). Climate, food pressures require rethink on water: UN [Press release]. Retrieved from http://www.reuters.com/article/2012/03/11/water-‐ study-‐idUSL5E8E9ANL20120311
Rizzo, Luigi. 2011. “Bioassays as a Tool for Evaluating Advanced Oxidation Processes in Water and Wastewater Treatment.” Water Research 45 (15) (October 1): 4311–4340.
Salgot, M., E. Huertas, S. Weber, W. Dott, and J. Hollender. 2006. “Wastewater Reuse and Risk: Definition of Key Objectives.” Desalination 187 (1-‐3) (February): 29– 40.
Lippincott, R.L., Ibrahim, E.A., Louis, J.B., Atherholt, T.B., Suffet, I.H., 1990. “CONTINUOUS LIQUID-‐LIQUID EXTRACTION FOR THE PREPARATION OF CHLORINATED WATER SAMPLES FOR THE AMES BIOASSAY” Wat. Res. 24 (6): 709–716.
Germany: An Option to Remove Pharmaceuticals and Musk Fragrances.”
Chemosphere 66 (5) (January): 894–904.
Tyler CR, Routledge EJ. 1998. "Natural and anthropogenic environmental estrogens: The scientific basis for risk assessment. Estrogenic effects in fish in English rivers with evidence of their causation." Pure Appl Chem 70:1795–1804.
Verlicchi, P, M Al Aukidy, and E Zambello. 2012. “Occurrence of Pharmaceutical Compounds in Urban Wastewater: Removal, Mass Load and Environmental Risk after a Secondary Treatment-‐-‐a Review.” The Science of the Total Environment 429 (July 1): 123–155.
Wolfe, Martha. F, Hinton, David E., Seiber, James N. 1995. "Aqueous Sample
Preparation for Bioassay Using Supercritical Fluid Extraction." Environmental Toxicology and Chemistry 14(6) (November): 1001-‐1009.
World Health Organization (WHO). 2004. Facts and figures: Water, sanitation and hygiene links to health.
http://www.who.int/water_sanitaiton_health/publications/factsfigures04/en/ (accessed August 23,2006).
Woods, Marianne, and Anupama Kumar. 2011. “Vitellogenin Induction by 17β-‐ Estradiol and 17α-‐Ethynylestradiol in Male Murray Rainbowfish (Melanotaenia Fluviatilis).” Environmental Toxicology and Chemistry / SETAC 30 (11)
(November): 2620–2627.
Ziylan, Asu, and Nilsun H Ince. 2011. “The Occurrence and Fate of Anti-‐Inflammatory and Analgesic Pharmaceuticals in Sewage and Fresh Water: Treatability by Conventional and Non-‐Conventional Processes.” Journal of Hazardous Materials 187 (1-‐3) (March 15): 24–36.
Chapter 2
2 Literature Review
2.1 Background
The widespread occurrence of organic micropollutants such as pharmaceutical compounds (PhCs) and personal care products, flame retardants, pesticides, and endocrine disrupting compounds (EDCs) in receiving aquatic environments and wastewater plants have provoked increasing concern all over the world. A study conducted in Europe stated that in 264 municipal wastewater treatment plants (WWTPS) around the world, 118 pharmaceutical compounds belonging to 17 different classes were found in the effluents (Verlicchi et al., 2012). The majority of those organic compounds have not been proved to be mutagenic or carcinogenic. However, 34% of 71 compounds detected in drinking water were reported to be mutagens (Ellis et al., 1982). Although the direct effects of these suspected
mutagenic micropollutants on human health and aquatic habitats are not yet fully understood, the pernicious effects of the EDCs and suspected mutagenic compounds have already been demonstrated (Sumpter, 2005). For example, chloroform was found at 366 μgL-‐1 and Dieldrin was found 8 μgL-‐1 in drinking water, which have 1.7 ×10-‐6 and 2.6×10-‐4 lifetime cancer risk per μgL-‐1 (Claxon, et al., 2008).
Bioassays, as one of the most precise and available tools, are used to monitor the quality of the wastewater treatment by using genetically modified bacteria or yeast strains to detect the mutagenicity or estrogenicity of the environmental samples downstream of the treatment processes. On the other hand, improving the
techniques to detect micropollutants at very low concentrations and developing the methodology to evaluate the toxicity of the contaminants should be fed back to the upstream process to optimize the operation of the wastewater treatment. Because of the looming water scarcity all over the world, supplying safe and reliable drinking water and sustainable development will require the detection and removal of
Therefore, extensive research and development in the methodology of micropollutant detection and monitoring are needed.
2.2 Sample preparation
The concentration levels of the suspected mutagens or estrogens in environmental samples are usually too low to be detected in a bioassay. Therefore, it is necessary to concentrate and purify the analytes prior to chemical analysis or bioassay. In
chemical analysis, sample preparation, as the foundation step for the experiment, is often the most time-‐consuming step. A survey showed that sample preparation accounted for nearly 61% of the time required to conduct an analytical task (Bielicka-‐Daszkiewicz & Voelkel, 2009). Because of the demand to perform an accurate and precise environmental analysis, liquid-‐liquid extraction (LLE) and solid-‐phase extraction (SPE) techniques were developed. LLE technique uses two immiscible solvents to partition the analytes from one media to the other. Although LLE has been used as a sample preparation procedure for analysis of trace organics for decades, with the superiority of other simple preparation techniques developed over the past twenty years, it has become less popular over time. In addition, there are many drawbacks of liquid-‐liquid extraction. For example, the solvents used in LLE must be immiscible with the matrix, which makes the procedure very non-‐ selective. In addition to emulsion formation, difficulty in automation, and time consumption, LLE also requires large volumes of organic solvents, some of which are toxic and can also be expensive. SPE, on the other hand, can overcome all of these drawbacks.
2.2.1 SPE
solutes are adsorbed and then desorbed by an on/off mechanism, it can be
considered as a form of digital liquid chromatography, a term created by Wells and Michael (Gonzalez, 2001). For purification purpose, there are two possible methods; one simply is the reverse of the other. Either the interferences or the analytes may be sorbed onto the surface of the sorbent and leave the others in the mobile phase, or vice versa. In either case, a distribution coefficient, KD, can be used to represent
the distribution of the analytes between the sample (solvent) and the sorbent, such that:
KD = [analyte]sorbent/[analyte]sample (Simpson, 2000) Eq. 2.1
The percent of analytes being extracted from one phase into another, represented by %E, can also be expressed in term of distribution coefficient, such that:
%E = 100 × KD/(KD+1) Eq.2.2
For a successful solid phase extraction, the distribution coefficient should be as large as possible. Ideally, in a SPE process, KD for an analyte should be large and the
KD for interferences should be small (or vice versa) (Portugal, 2008). In such a case,
one compound (or a specie) will be completely retained in one phase and leave the rest of species in the other phase. Thus, selectivity is obtained. Another parameter, R, is used to indicate the absolute recovery for a SPE process. Similar to the percentage of analytes extracted, R is in form of percentage and the equation can be expressed as:
%R = (ME/ML) ×100% Eq.2.3
where ME is the amount of analytes eluted from the SPE devices and ML is the
conducted under isothermal conditions (room temperature), temperature then becomes a minor factor.
2.2.2 Format of SPE
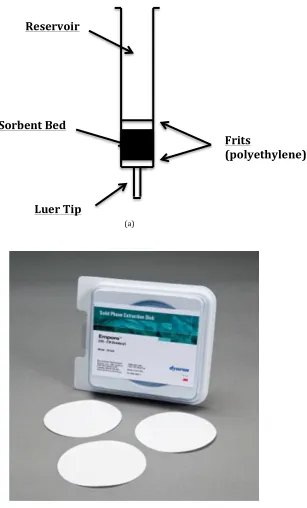
Over time, SPE has been developed into different formats. The most common format of SPE is in form of a cartridge (column). Sorbent particles (nominally 50 μm in diameter) are packed with two polyethylene fritted disks above a male Luer tip in a disposable short column (generally an open polypropylene syringe barrel) that acts as a reservoir for the environmental samples and solvents, as seen in Figure 2.1(a). After activating the sorbent with solvents, the liquid sample can then be loaded into the column. The analytes are distributed between the liquid and the solid phases where they are retained for the duration of the sampling process by adsorption on the bonded phase molecules of the surface. The analytes must have a greater affinity for the solid phase than for the sample matrix in order to be partitioned between these two phases (Berrueta et al., 1995). Analytes which have been extracted would be afterward isolated from the solid phase by desorption and the analytes would then be recovered by elution with a correspondingly small amount of appropriate solvent (typically two bed volumes) (Poole, 2003; Raisglid, 1996). Since the volume of solvent used in elution of the analytes is far less than the original volume of the sample, the sample is concentrated several times which increases the sensitivity and preciseness of the bioassays as well as chemical analysis.
Figure 2.1(a) The SPE column is a common device. A polypropylene syringe barrel contains the sorbent packed between two porous frits.
Figure 2.1(b) The SPE disc is a device in which sorbents are loaded in a membrane. (Sigma-‐Aldrich, 3M Empore SPE Extraction Disk).
(a)
Reservoir
Sorbent Bed
Luer Tip
Frits
(polyethylene)
SPE discs were first designed to treat large sample volumes with higher processing rate than columns and to avoid the blockages caused by suspended particles and matrix components. Sorbent particles with 8 to 12 μm in diameter were packed between particle-‐loaded membranes and immobilized in a web of micro-‐fibrils, as seen in Figure 2.1 (b) (Berrueta et al., 1995). SPE columns and discs share the same sorbent technology and the only difference between these two devices is the format. Cartridges can be easily fabricated in a laboratory environment, however, discs, so far, can only be produced in a manufacturing setting which results in a limited range of sorbent chemistry selection (Poole, 2003). In addition, cartridges are easier to be scaled up for larger sample loads and to clean up the samples than it is for discs. Because of the low selectivity of sorbents and the difficulty of manufacture, there are not many choices of commercial SPE discs in the market that makes discs significantly more costly than cartridges. Although SPE discs require smaller amount of elutes and can operate at higher flow rates (Thurman & Snavely, 2000), taking the economy and requirement of simple, routine applications into account, cartridge devices are always recommended.
environmental and clinical applications indicated that SBSE technique has an acceptable recovery and precise extractions of trace solutes from surface water (David & Sandra, 2007; Guart et al., 2014; Portugal et al., 2008), biological fluid (Kassem, 2010) and wine (Hayasaka et al., 2003; Weldegergis & Crouch, 2008; Zalacain et al., 2007). In addition to being solventless, other advantages of SBSE devices include high feasibility and application to volatile organic compounds (VOCs) and semi-‐volatile compounds (Kawaguchi et al., 2005; Prieto et al., 2010).
Figure 2.2 Apparatus of the first commercial SPME device (Chromedia, Principles of SPME)
There are three basic modes for fibre SPME: direct extraction, in a headspace configuration, and in a membrane-‐protected approach (see in Figure 2.3).
For direct extraction mode, the coated fibre is inserted directly into the sample with analytes and the analytes are adsorbed directly from the sample matrix to the extracting phase. In the headspace mode, the analytes have to be transported
through the barrier of air before being adsorbed onto the coating which can be used to extract volatile compounds. In order to protect the fiber against damage, the membrane-‐protected SPME can be used (Vas & Vekey, 2004).
Contrary to traditional SPE methods and to the classic procedures, SPME relies on quantitative but non-‐exhaustive transference of analytes as the small volume of the extraction phase. The major advantages of the SPME technique are the easy
miniaturization and automation. It is also a quick and straightforward approach for on-‐site analysis (Augusto et al., 2009). However, the extraction happens very slowly and has a considerably low recovery compared to LLE and SPE (Ulrich, 2000). In addition, as SPME requires the application of coating technology during
manufacturing, the SPME apparatus is considerably expensive.
In this study, SPE cartridges were selected as the device to extract and enrich the solute from the aqueous samples. SPE cartridges, developed and introduced to the laboratories in the early 1980s, are a more mature technique. Significant amount of sorbent materials have been investigated and are already available in the market. Because of the low cost and high selectivity of sorbent chemistry, the SPE cartridge is more popular than SPE disc or solventless sample enrichment techniques. In addition, SPE cartridge devices have a faster protocol, greater recoveries and more reproducible results (Prieto et al., 2010; Davies, 2010).
2.2.3 Sorbent Selection
sorbents also have been developed such as activated carbon, alumina, silica gel, and magnesium silicate (Berrueta et al., 1995).
Silica, as a basic support material in SPE cartridges, has an average diameter of 50 μm, a surface area of 400-‐550 m2/g, an average pore diameter of 60 Å and pore
volumes of 0.5-‐2 mL/g (Gonzalez, 2001). As silica is produced by the polymerization of tetra alkyl orthosilicate under acidic condition, long polymer chains with terminal hydroxyl groups, referred to as silanols, are formed. During the polymerization process, different silanol groups and siloxane linkages are formed and attached to the silica. The pKa of silanol varies between 4 and 6 in water that results in a weakly
acidic group and possible cation exchanger. So, when the pH is higher than 8.0, the surface of silica will be negatively charged. Because of the very polar nature of the bare silica, it is not a good stationary phase for samples with aqueous solvent (solvents for most of the environmental samples are water). Therefore, it needs to be modified to a more hydrophobic sorbent for application to aqueous systems.
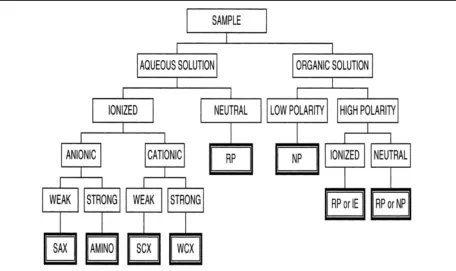
SPE can be classified into three major groups based on different modified silicic stationary phases, in which different chemical mechanisms are applied to partition the analytes from a particular matrix. These three groups are: normal phase, reversed phase, and ion exchange. Sorbent selection is based on considerations of the properties of the solution and the target analytes that is summarized in Figure 2.4.
Figure 2.4. Method selection guide for the isolation of organic compounds
from solution in which SAX represents strong anion exchanger, SCX
represents strong cation exchanger, WCX is weak cation exchanger, RP, NP and IE refer to reversed-‐phase, normal-‐phase and ion-‐exchange sampling conditions, respectively (Poole, 2003).
(Biziuk, 2006). C18 columns, as the most widely used and traditional reversed phase extraction device in SPE and HPLC, are utilized to partition dissolved organic
compounds such as antibiotics, essential oils, drugs, esters, and water or fat-‐soluble vitamins from different matrices. Other reversed phase sorbents were also
developed for specific needs. For example, ENVI-‐Chrom P packing with a greater surface area was specially designed to extract polar aromatic compounds from aqueous samples. Some other examples of reversed phase sorbent include C8, C2, cyclohexane (CH), and phenyl (PH) (Raisglid, 1996).
Normal phase SPE, on the other hand, is typically exploited to extract a polar solute from a mid polar to nonpolar matrix such as acetone, hexane and chlorinated solvent with a polar stationary phase (Bulletin 910, 1998). However, since this study focuses on the application of SPE columns on environmental samples, which are normally in aqueous matrices, cartridges from this category were not selected in this work.
In addition to hydrophobic interaction, ionic interaction between an analyte and the sorbent in aqueous sample matrix can also be utilized. Ion exchange SPE can be used to extract compounds with charges in a solution. Anionic analytes can be attracted to the silica surface bonding with an aliphatic quaternary amine group. Cationic compounds are isolated on an aliphatic sulfonic acid group that is bonded to the silica surface. The electrostatic attraction forces between the charged functional group in the compound and the charged group bonded to the silica surface is the primary retention mechanism of ion exchange SPE (Biziuk, 2006). With the development of SPE technology, mixed-‐mode sorbent systems that are the combinations of reversed-‐phase and ion-‐exchange sorbent are available. Some studies have already addressed that mixed-‐mode sorbents are often more
advantageous and provide better separations than reversed phase or ion-‐exchange SPE alone (Landis, 2007; Mroczek et al., 2002; Clauwaert et al., 2000).
Based on the above information, three commercial cartridges belonging to two different categories were selected in order to evaluate the performance of these cartridges and study the relationships between the sorbents and the physico-‐ chemical properties of target analyte(s). These cartridges are: LC-‐18 column (500 mg/3 mL) obtained from Supelclean (PA, USA), Oasis MAX (150 mg/6mL) and MCX (150 mg/6mL) obtained from Waters (PA, USA).
The LC-‐18 cartridge, belonging to reversed phase category, uses octadecyl bonded end-‐capped silica as its sorbent. The hydrophilic silanol groups at the surface of the raw silica packing (pore size and particle size may be controlled by supplier’s manufacturing processes, but it is typically 60 Å pore size, 40 μm particle size) have been chemically modified with hydrophobic alkyl or aryl functional groups by reaction with the corresponding silicates (Bulletin 910, 1998). The reaction can be expressed as following:
Eq. 2.4 In the reaction, the hydrophobic alkyl or aryl functional group substitutes the chlorine on the silicates and finally the new alkyl-‐ or aryl-‐bonded silicas and
hydrochloric acid are formed. The functional group of LC-‐18 cartridges is displayed below in Figure 2.5.
Some studies used LC-‐18 cartridges as SPE devices and found their recovery to be 60.08% to 98.58% for polycyclic aromatic hydrocarbons (PAHs) in water matrix (Kursinszki et al., 2005), 88.7% to 91.5% for caffeine (Ku et al., 1999) and 64.2% to 93.6% for 17β-‐estradiol (E2) spiked in different matrices (Shi et al., 2011; Hu et al., 2013).
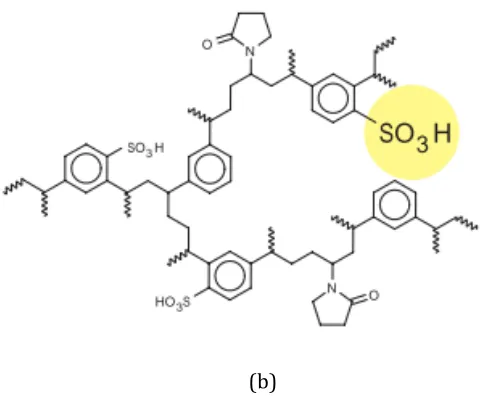
MAX and MCX cartridges are both in the mixed-‐mode ion exchange category and are synthesized from the reversed phase SPE column-‐Oasis HLB (Water, USA). MAX (mixed-‐mode anion exchange) cartridges contain a mixed-‐mode polymeric
(patented) sorbent with both reversed-‐phase and anion-‐exchange functionalities. The sorbent with a strong anion-‐exchange quaternary amine group has an ion-‐ exchange capacity of 0.25 meq/g and is on the surface of HLB sorbent, a poly (divinylbenzene-‐co-‐N-‐vinylpyrrolidone) copolymer (Oasis, 2002). With the modification of the anion-‐exchange group, the MAX cartridge provides high
selectivity for acidic compounds. The Oasis MAX sorbent has a structure as shown in Figure 2.6(a). Whereas, MCX (mixed-‐mode cation exchange) sorbent with strong cation-‐exchange sulfonic acid groups (1.0 meq/g of sulfonic-‐acid-‐ion-‐exchange capacity) bonded onto the surface of the Oasis HLB sorbent has dual modes of retention -‐ reversed phase and cation exchange (Oasis, 2002). Because of the sulfonic acid groups, the MCX cartridge provides high selectivity for basic
compounds. The structure of Oasis MCX sorbent is shown in Figure 2.6(b).
Figure 2.6 The structure of Oasis (a) MAX and (b) MCX sorbent (Waters, Oasis sample extraction products).
The hydrophobic part of the copolymer (divinylbenzene) gives the both MAX and MCX sorbents their reversed-‐phase characters, while the hydrophilic part (N-‐ vinylpyrrolidone) increases water wettability that allows the sorbent to retain the capacities even when the sorbents run dry (Dobrev & Kaminek, 2002). On contrary to the traditional silica SPE sorbent, Oasis MAX and MCX sorbent are stable from pH 0 to 14, and have two to three times higher capacity due to their larger surface area and the water wettability. The analyte is charged at low pH for MCX sorbent (and at high pH for MAX sorbent) and experiences maximum retention primarily from the ion-‐exchange mechanism, accompanying with minor reversed phase mechanism. At high pH for MCX (and at low pH for MAX) sorbent, the ion-‐exchange retention mechanism switches off since the analyte is unionized. Then, reversed-‐phase
retention is the dominant retention mechanism. MAX cartridge is reported to have a recovery of 76% to 100% for antibiotics (Benito-‐Peña et al., 2006) and 83.4% for estradiol (E2) (Arai et al., 2010). For MCX cartridges, the recovery ranges from 36%
to 106% for different pharmaceuticals, 92% for E2 (Zhang et al., 2011; Castiglioni et al., 2005).
2.2.4 New trends of sorbent in solid-‐phase extraction
Except the trends in the format modification in SPE technique introduced in Section 2.2.2, the development of new sorbents would improve the sensitivity and the selectivity of the analytical methods. All those new developed sorbents can be classified into following classes:
Surfactant-‐modified sorbents
When the concentration of surfactant solutions is higher than its critical micellar concentration (CMC), molecules arrange themselves in micelles. However, when the concentration is slightly below the CMC, molecules of ionic surfactants would be adsorbed on the surface of active solids contacting with the solution, forming hemimicelles and admicelles (see in Figure 2.7) which have a monolayer or bi-‐layer structures on the surface of the solids (Augusto et al., 2013).
Figure 2.7 Micelles, hemimicelles and admicelles structures (Augusto et al., 2013).
For hemimicelle-‐based sorbents, as the hydrophobic tail of the surfactant is exposed to the solution, it is easier to retain non-‐polar analytes on them. On the contrary, admicelles-‐based sorbents are more suitable for polar compound extraction, as the portion of the coacervates exposed to the sample comprises the ionic tails of the molecules.
Nanostructured materials
The development of namomaterials affects several other fields of technology, including analytical chemistry. The applications of nanomaterials as SPE sorbents were suggested in recent literature. Two most well known sorbents are: electrospun polymer nanofibers (NFs) and carbon nanotubes (CNTs).
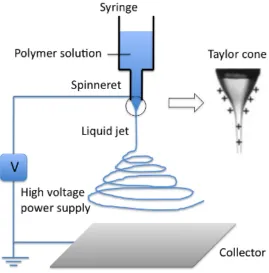
Electrospinning is a technique in which a viscoelastic solution is drawn into
nanofibers by repulsive electrostatic forces (Chigome et al., 2011). It can be seen in Figure 2.8, the electrospining setup consists of three components: a high voltage power supply, a way to deliver a visco-‐elastic solution and a means to collect the fibers (Chigome & Torto, 2012). Electrospinning, as one of the nanofiber fabrication methods, is able to easily control the orientation of the nanofibers which has a significant effect on the performance of the SPE devices.