Scholarship@Western
Scholarship@Western
Electronic Thesis and Dissertation Repository
1-15-2015 12:00 AM
Cluster Fluid Dynamics in Down Flow Reactors: Experimental and
Cluster Fluid Dynamics in Down Flow Reactors: Experimental and
Modeling Study
Modeling Study
Angel Virgilio Lanza Soto The University of Western Ontario Supervisor
Dr. Hugo I. de Lasa
The University of Western Ontario
Graduate Program in Chemical and Biochemical Engineering
A thesis submitted in partial fulfillment of the requirements for the degree in Doctor of Philosophy
© Angel Virgilio Lanza Soto 2015
Follow this and additional works at: https://ir.lib.uwo.ca/etd
Part of the Catalysis and Reaction Engineering Commons, Petroleum Engineering Commons, and the
Transport Phenomena Commons
Recommended Citation Recommended Citation
Lanza Soto, Angel Virgilio, "Cluster Fluid Dynamics in Down Flow Reactors: Experimental and Modeling Study" (2015). Electronic Thesis and Dissertation Repository. 2659.
https://ir.lib.uwo.ca/etd/2659
This Dissertation/Thesis is brought to you for free and open access by Scholarship@Western. It has been accepted for inclusion in Electronic Thesis and Dissertation Repository by an authorized administrator of
(Thesis format: Monograph)
by
Angel Virgilio Lanza Soto
Graduate Program in Engineering
Department of Chemical and Biochemical Engineering
A thesis submitted in partial fulfillment of the requirements for the degree of
Doctor of Philosophy
The School of Graduate and Postdoctoral Studies The University of Western Ontario
London, Ontario, Canada
ii
Abstract
Gas–solid concurrent downers possess unique features when compared to other gas–solid systems. Establishing their fluid dynamic properties requires both experimental
measurements of gas−solid flow properties and computational modeling.
Measuring gas−solid flow properties such as cluster solid concentrations, individual cluster
slip velocities, and cluster sizes, involves the use of specialized optical equipment, as well as a rigorous data analysis methodology. In addition, the modeling of the fluid dynamics of gas−solid flows in downer units offers special challenges such as establishing a proper drag
model, cluster configuration and sizes, sphericity, boundary conditions, among other issues.
In this PhD dissertation, the fluid dynamics of gas−solid flows in downer reactor units are
analyzed in the context of a wide range of operating conditions. To accomplish this, local cluster particle characteristics are determined for the first time, using two separate downer units and a significantly enhanced data analysis. This involves individual cluster signals recorded by the CREC−GS−Optiprobes and a method for setting the data baseline using solid
mass balances. The proposed methodology allows the calculation of individual cluster slip velocities, agglomerate particle sizes, individual particle cluster size distributions, and cluster drag coefficients.
Gas−solid flows in downers are simulated in the present PhD dissertation, using a
Computational Particle Fluid Dynamics (CPFD) Numerical Scheme. The CPFD model includes particles represented as clusters. This model is validated with experimental data
obtained from the two independent downer units which have different downer−column
internal diameters (a 1 inch ID and a 2 inch ID). CPFD simulations are implemented using average particle cluster sizes as obtained experimentally. Experimentally observed
time−averaged axial and radial velocities, solid concentration profiles, and cluster particle
iii
It is found that CPFD simulations agree well with experimentally determined particle cluster velocity and the solid void fraction in the downer core region, with this being the case for all the operating conditions studied.
Keywords
Gas−Solid Fluid Dynamics, Downer Reactor Units, Cluster Fluid Dynamics, Computational
iv
Dedication
This dissertation is dedicated to the memory of my beloved father, Angel Virgilio Lanza
González (1929−2005),who has been a source of encouragement and inspiration to me
throughout my life.
Esta tesis está dedicada a la memoria de mi querido padre, Angel Virgilio Lanza González
(1929−2005), quien ha sido una fuente de estímulo e inspiración para mí a lo largo de mi
v
Acknowledgments
I wish to express my sincere gratitude to everyone who made this doctoral study possible.
First of all, I would like to thank my advisor, Dr. Hugo Ignacio de Lasa, for his endless guidance during my research and study at The University of Western Ontario. He was always available and willing to help. His recognized expertise, perpetual energy, and enthusiasm in research, extremely motivated me in my studies.
I recognize that this research would not have been possible without the financial assistance of The Natural Sciences and Engineering Research Council of Canada (NSERC), and the Ontario Graduate Scholarship (OGS) I was awarded. I express my gratitude to those agencies that allowed me to pursue my PhD studies.
Thanks to Jose Munoz and Pastor Solano, the laboratory technicians, for helping me during the long hours in the laboratory. Thank you to Florencia de Lasa for helping me in the editing of the final version of all my publications. I am also very thankful to my laboratory and office mates, Ashraful Islam, Gureet Chandhok, Isabela Reiniati, Jahirul Mazumder, Patricio Valades, Quddus Rezwanul, and Saad Al−Bogami, for the good times, refreshing work
breaks, and fun lunch environment. I am especially grateful to my friends Vanessa Rodgher, Enrique Salaices and Jesus Moreira, for all the support, advice and caring that they provided me during this dissertation.
My deepest gratitude goes to my family for their unconditional love throughout my life. Not a single word can fully describe how thankful I am to my Mother, Nancy Soto. I owe her everything; she has always been extremely supportive. It is impossible to thank her adequately for everything she has done for me.
I am also indebted to my clever and beautiful wife, Yira Aponte, whose love, patience, understanding and unconditional support allowed me to finish this journey. She already has my heart so I will just give her a heartfelt “thanks”. Lastly, I wish to thank my daughter
vi
Table of Contents
Abstract ... ii
Dedication ... iv
Acknowledgments... v
Table of Contents ... vi
List of Tables ... x
List of Figures ... xii
List of Appendices ... xx
Nomenclature ... xxi
Chapter 1 ... 1
1 Introduction ... 1
Chapter 2 ... 10
2 Literature Review ... 10
2.1 Downer Reactor Units... 10
2.2 Hydrodynamics of Downers ... 11
2.2.1 Axial Flow Sections ... 12
2.2.2 Axial Distribution of Pressure ... 13
2.2.3 Radial Flow Sections ... 15
2.3 Feeders/Distributors ... 16
2.4 Cyclones/Separators ... 19
2.5 Cluster Formation in Downers, Radial an Axial Distribution ... 22
2.6 Computational Fluid Dynamics ... 24
2.7 Measurements of Solids Concentration in a Downer ... 27
2.8 Heat Transfer in Downer Reactors ... 29
vii
2.9.1 Application of Downers in Fluid Catalytic Cracking (FCC) ... 31
2.9.2 Application of Downers in Pyrolysis of Biomass and Coal ... 39
2.10 Conclusions ... 40
Chapter 3 ... 43
3 Scope of the Research ... 43
3.1 Overall Objectives ... 43
3.2 Accomplishment of Research Objectives ... 44
Chapter 4 ... 46
4 Experimental Equipments and FCC Catalyst ... 46
4.1 Chemical Reactor Engineering Centre Gas−Solid Optical Probe (CREC−GS−Optiprobe) ... 46
4.2 Gas−solid Co−current Flow Downer Units ... 53
4.2.1 One inch Internal Diameter Downer Unit ... 53
4.2.2 Two inch Internal Diameter Downer unit ... 55
4.3 FCC Catalyst Particles Used ... 57
4.4 Conclusions ... 58
Chapter 5 ... 60
5 Methodology Proposed for Signal Analysis ... 60
5.1 Baseline Concept and its Importance for Signal Analysis ... 60
5.2 Baseline Setting Methodology ... 63
5.3 Conclusions ... 68
Chapter 6 ... 70
6 Experimental Results Obtained with the 1 inch Internal Diameter Downer Unit... 70
6.1 Baseline Reference Factor from Experimental Results ... 71
6.2 Cluster Slip Velocity from Experimental Data ... 73
viii
6.4 Cluster Size and Cluster Slip Velocity Calculations... 77
6.5 Particle Cluster Size Distribution Results ... 78
6.6 Mechanistic Model for the Cluster Drag Coefficient Calculation ... 84
6.7 Conclusions ... 93
Chapter 7 ... 94
7 Computational Particle Fluid Dynamics Modeling of the One inch Internal Diameter Downer unit. ... 94
7.1 Computational Method ... 94
7.1.1 Gas Phase Model... 95
7.1.2 Particle Phase Model... 96
7.1.3 Coupling Gas and Particle Phases... 98
7.1.4 Turbulence model ... 99
7.1.5 Experimental Set−up and Simulation Conditions ... 99
7.2 Discretization Sensitivity Analysis ... 102
7.3 Boundary Conditions and Input Values ... 109
7.4 Drag Model ... 112
7.5 Particle Cluster Sizes and Sphericity ... 113
7.6 Results and Discussion ... 114
7.7 Conclusions ... 123
Chapter 8 ... 125
8 Experimental Results and CPFD Simulations Obtained with the Two Inch Internal Diameter Downer Unit. ... 125
8.1 Baseline Reference Factor from Experimental Results ... 126
8.2 Cluster Slip Velocity from Experimental Data ... 128
8.3 Radial Solid Concentration Profiles... 130
8.4 Cluster Size and Cluster Slip Velocity Calculations... 132
ix
8.6 Computational Particle Fluid Dynamics Modeling of the Downward Gas−Solid
Flow. ... 138
8.6.1 Computational Method ... 138
8.6.2 Experimental Set−up and Simulation Conditions. ... 139
8.6.3 Discretization Sensitivity Analysis ... 139
8.6.4 Boundary Conditions and Input Values ... 145
8.6.5 Drag Model ... 147
8.6.6 Particle Cluster Sizes and Sphericity ... 147
8.7 Results and Discussion ... 147
8.8 Conclusions ... 157
Chapter 9 ... 159
9 Conclusions and Recommendations ... 159
9.1 Conclusions ... 159
9.2 Recommendations ... 161
References ... 162
Appendices ... 177
x
List of Tables
Table 1−1: Some application areas for gas−solid Circulating Fluidized Bed systems using
downers. ... 4
Table 2−1: Yields of conventional FCC and HS−FCC (Abul−Hamayel, 2004). ... 36
Table 6−1: Operating conditions used in the 1 inch internal diameter downer unit. ... 70
Table 6−2: Baseline reference factor experimental results. ... 72
Table 6−3: Operating conditions and number of clusters studied. ... 79
Table 6−4: Operating conditions and number of clusters considered for cluster size distribution study. ... 81
Table 7−1: Particle discretization analysis. Operating condition: Ug=1.68 m/s, Gs=82 kg/m2s. ... 104
Table 7−2: Mesh discretization details ... 107
Table 7−3: Operating conditions used in this study... 110
Table 7−4: Input parameters in the CPFD Simulation. ... 111
Table 7−5: Average particle cluster size and sphericity. ... 114
Table 8−1: Operating conditions used in the 2 inch internal diameter downer unit. ... 126
Table 8−2: Baseline reference factor experimental results. ... 127
Table 8−3: Operating conditions and number of clusters studied ... 134
Table 8−4: Particle discretization analysis. Operating condition: Ug=1.5 m/s, Gs=34 kg/m2s. ... 141
xi
Table 8−6: Input parameters in the CPFD Simulation. ... 146
xii
List of Figures
Figure 1−1: Circulating Fluidized Bed typical configuration. ... 2
Figure 2−1: Axial gas−solid flow structure in downers (Zhu et al., 1995). ... 13
Figure 2−2: Axial distribution of pressure gradient. Effects of solids flux and gas velocity (Zhu et al., 1995). ... 13
Figure 2−3: Gas/solid distributor section of the downer unit used by Brust and Wirth (2004). ... 17
Figure 2−4: Setup of the gas/solid distributor used by Lehner and Wirth (1999). In this Figure the units are reported in mm. ... 18
Figure 2−5: Three distributor designs used by Johnston et al. (1999). ... 19
Figure 2−6: Inertial separator designed by Huard et al. (2010). ... 21
Figure 2−7: Short−contact cyclone reactor designed by Zhang et al. (2013). ... 21
Figure 2−8: Configurations of downer reactors, United States patents in the literature, part 1/2. ... 32
Figure 2−9: Configurations of downer reactors, United States patents in the literature, part 2/2. ... 33
Figure 2−10: Comparison between Co−Current Upflow (CCU) and Co−Current Downflow (CCDF) in gasoline and coke production. ... 34
Figure 2−11: Comparison of downer and riser based on High−Severity FCC Process (Abul−Hamayel, 2004). ... 37
xiii
Figure 4-1: Schematics of the emitter side of a CREC−GS−Optiprobe showing the region of
high light intensity (Nova et al., 2004a). ... 47
Figure 4-2: Operating principle of the CREC−GS−Optiprobes (Nova et al., 2004b). ... 48
Figure 4-3: Fiber−optic configuration system for cross−correlation analysis (Nova et al.,
2004b). ... 49
Figure 4-4: CREC−GS−Optiprobe beam profile characterization results. ... 51
Figure 4-5: Curve fitting analysis of the beam profile. ... 52
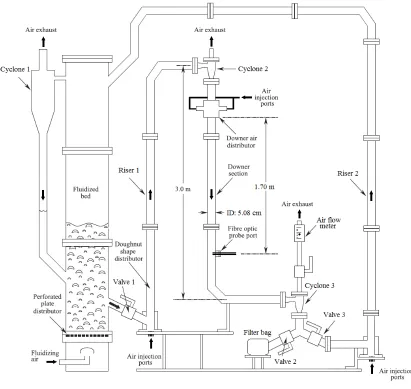
Figure 4-6: Schematic diagram of the one inch internal diameter downer unit showing the fiber optic port, adapted from Nova (2005). ... 54
Figure 4-7: Schematic diagram of the two inch internal diameter downer unit. ... 56
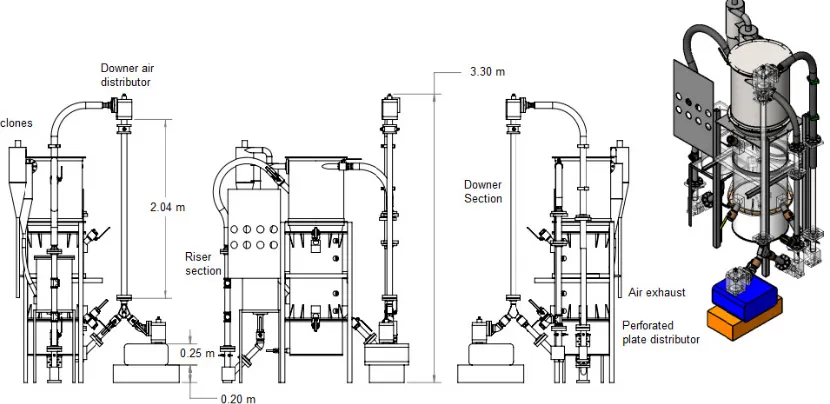
Figure 4-8: Scaled representation of the 2 inch internal diameter downer unit. ... 57
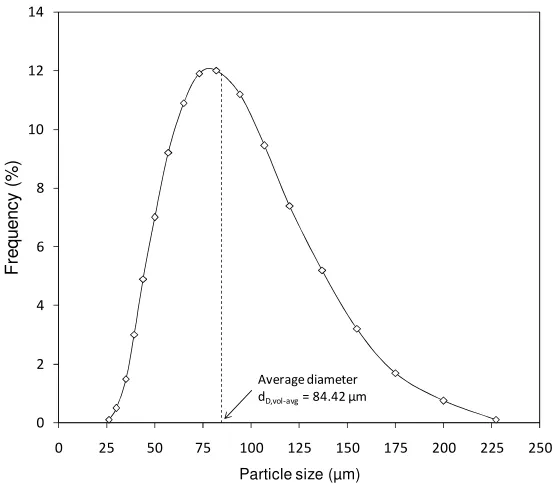
Figure 4-9: Volume weighted particle size distribution of FCC particles used in the present study. ... 58
Figure 5−1: CREC−GS−Optiprobe signals for the upper and lower probes: conditions, 1 inch
downer, Gs=60.2 kg/m2/s, Ug=1.29 m/s, r/R=0.1. ... 61
Figure 5−2: Example of the cross−correlation sequence for one cluster, 2 inch downer,
Gs=50 kg/m2/s, Ug=1.5 m/s, r/R=0. ... 66
Figure 6−1: Baseline reference factor as a function of the solid mass flux. ... 72
Figure 6−2: Baseline reference factor as a function of the superficial gas velocity. ... 73
Figure 6−3: Radial cluster slip velocity profiles. Figures (a) to (d) show lower, lower
xiv
Figure 6−4: Radial cluster solid concentration profiles. Figures from (a) to (d), show results
of the upper optiprobe; (e) to (h) show results of the lower optiprobe. Four groups are presented, lower, lower intermediate, higher intermediate, and higher solid mass flux. ... 76
Figure 6−5: Slip velocities of particles as a function of number of particles in the 1 inch
internal diameter downer unit. Operating condition: Ug=0.95 m/s, Gs=10 kg/m2/s. Data points included: 899 clusters. ... 77
Figure 6−6: Cluster slip velocity distribution: Ug=1.16 m/s, Gs=106 kg/m2/s. ... 78
Figure 6−7: Individual particle cluster size distributions at various solid fluxes and gas
velocities. ... 82
Figure 6−8: Distribution of the number of particles in clusters for Ug=2.5 m/s, Gs=91.2 kg/m2/s. ... 82
Figure 6−9: Individual particle cluster size distribution averages. ... 83
Figure 6−10: Individual particle cluster size distribution weighted averages for all operational
conditions studied. ... 83
Figure 6−11: Individual cluster size distribution averages at r/R=0 radial position. ... 84
Figure 6−12: Main forces acting on single particles. ... 85
Figure 6−13: Cluster drag coefficient dependence with Reynolds number according with
Equation (6−12). ... 87
Figure 6−14: Change of the CD with Re. Solution Points for Equations (6−12) and (6−13). 88
Figure 6−15: Maximum and minimum cluster drag coefficients estimated with Haider and
Levenspiel (1989) correlation. ... 91
Figure 6−16: Maximum and minimum cluster drag coefficients estimated with Ganser (1993)
xv
Figure 6−17: Theoretical and experimental cluster slip velocities for various cluster lengths.
Experimental data are reported in color zones. Color zones represent fractions of the 20,667 total clusters population sharing the same cluster slip velocity and number of particles. ... 92
Figure 7−1: Particle Size Distribution (PSD) for the FCC particles of the present study. ... 101
Figure 7−2: Inlet particle velocity sensitivity analysis. ... 101
Figure 7−3: Effect of particle resolution on the calculated cluster particle velocity at the
center line of the downer unit. Operating condition: Ug=1.68 m/s, Gs=82 kg/m2s. Note: four different grids with np changing from 30−30,000 were used in the calculations. ... 105
Figure 7−4: Effect of particle resolution on particle volume fraction at the center line in the
downer unit. Operating condition: Ug=1.68 m/s, Gs=82 kg/m2s. Note: four different grids with np changing from 30−30,000 were used in the calculations. ... 105
Figure 7−5: Effect of particle resolution on pressure in a downer unit of this study. Operating
condition: Ug=1.68 m/s, Gs=82 kg/m2s. Note: four different grids with np changing from
30−30,000 were used in the calculations. ... 106
Figure 7−6: Effect of spatial resolution on cluster particle velocity at the center line of the
downer unit. Operating condition: Ug=1.68 m/s, Gs=82 kg/m2s. Note: np=3,000, 7x7x557
and 9x9x702 grids were used in the calculations... 107
Figure 7−7: Effect of spatial resolution on particle volume fraction at the center line of the
downer unit. Operating condition: Ug=1.68 m/s, Gs=82 kg/m2s. Note: np=3,000, 7x7x557
and 9x9x702 grids were used in the calculations... 108
Figure 7−8: Effect of spatial resolution on pressure. Operating condition: Ug=1.68 m/s,
Gs=82 kg/m2s. Note np=3,000, 7x7x557 and 9x9x702 grids were used in the calculations. 108
Figure 7−9: X−Y Grids used in the CPFD simulations. ... 109
xvi
Figure 7−11: Simulated average pressure profile along the downer. Operating condition:
Ug=2.53 m/s; Gs=76 kg/m2s. ... 115
Figure 7−12: Average pressure gradient profile along the downer. Operating conditions:
Ug=2.53 m/s; Gs=76 kg/m2s. ... 116
Figure 7−13: Average axial velocity profile along the downer. Operating conditions:
Ug=2.53 m/s; Gs=76 kg/m2s. ... 116
Figure 7−14: Radial profiles for a) cluster particle velocity profile, and b) particle void
fraction profile. Axial position of the CREC−GS−Optiprobe z=0.15m, (1/2). ... 118
Figure 7−15: Radial profiles for a) cluster particle velocity profile, and b) particle void
fraction profile. Axial position of the CREC−GS−Optiprobe z=0.15m, (2/2). ... 119
Figure 7−16: Comparison of between CPFD simulations and experimental results for cluster
particle velocity and particle volume fraction. a) Cluster particle velocity (m/s), b) Particle volume fraction. ... 120
Figure 7−17: Comparison between CPFD simulations and experimental results omitting the
data in the near wall region. (a) Cluster particle velocity (m/s), (b) Particle volume fraction. ... 121
Figure 7−18: (a) Radial velocity profile, (b) Particle volume fraction. Operating conditions:
Ug=2.53 m/s; Gs=76 kg/m2s. ... 122
Figure 8−1: Baseline reference factor as a function of the solid mass flux. ... 127
Figure 8−2: Baseline reference factor as a function of the gas velocity. ... 128
Figure 8−3: Radial cluster slip velocity profiles. Figures (a) to (c) show lower, intermediate,
and higher gas velocity, respectively. ... 129
Figure 8−4: Radial cluster solid concentration profiles. Figures from (a) to (c), show results
xvii
Figure 8−5: Slip velocities of particles as a function of the number of particles in the 2 inch
internal diameter downer unit. Operating condition: Ug=1.5 m/s, Gs=34 kg/m2s. Data points included: 533 clusters. ... 132
Figure 8−6: Cluster slip velocity distribution. For N=1 to 2, 250 clusters are considered; For
N=7 to 8, 43 clusters are accounted. Operating condition: Ug=1.5 m/s, Gs=34 kg/m2s. ... 133
Figure 8−7: Individual particle cluster size distributions at various solid fluxes and gas
velocities. ... 135
Figure 8−8: Distribution of the number of particles in clusters for Ug=1.5 m/s,
Gs=34 kg/m2s. ... 136
Figure 8−9: Individual particle cluster size distribution averages. ... 136
Figure 8−10: Individual particle cluster size distribution weighted averages for all operational
conditions studied. ... 137
Figure 8−11: Individual cluster size distribution averages at r/R=0.9 radial position. ... 137
Figure 8−12: Effect of particle resolution on the calculated cluster particle velocity at the
center line of the downer unit. Operating condition: Ug=1.5 m/s, Gs=34 kg/m2s. Note: five different grids with np changing from 30−300,000 were used in the calculations. ... 141
Figure 8−13: Effect of particle resolution on particle volume fraction at the center line in the
downer unit. Operating condition: Ug=1.5 m/s, Gs=34 kg/m2s. Note: five different grids with
np changing from 30−300,000 were used in the calculations. ... 142
Figure 8−14: Effect of particle resolution on pressure in a downer unit of this study.
Operating condition: Ug=1.5 m/s, Gs=34 kg/m2s. Note: five different grids with np changing
from 30−300,000 were used in the calculations. ... 142
Figure 8−15: Effect of spatial resolution on cluster particle velocity at the center line of the
downer unit. Operating condition: Ug=1.5 m/s, Gs=34 kg/m2s. Note: np=30,000, 11x11x453
xviii
Figure 8−16: Effect of spatial resolution on particle volume fraction at the center line of the
downer unit. Operating condition: Ug=1.5 m/s, Gs=34 kg/m2s. Note: np=30,000, 11x11x453
and 13x13x518 grids were used in the calculations. ... 144
Figure 8−17: Effect of spatial resolution on pressure. Operating condition: Ug=1.5 m/s,
Gs=34 kg/m2s. Note: np=30,000, 11x11x453 and 13x13x518 grids were used in the
calculations. ... 144
Figure 8−18: Simulated average pressure profile along the downer. Operating condition:
Ug=1.5 m/s, Gs=34 kg/m2s. ... 148
Figure 8−19: Average pressure gradient profile along the downer. Operating condition:
Ug=1.5 m/s, Gs=34 kg/m2s. ... 149
Figure 8−20: Average axial velocity profile along the downer. Operating condition: Ug=1.5 m/s, Gs=34 kg/m2s. ... 149
Figure 8−21: Radial profiles for a) cluster particle velocity profile, and b) particle volume
fraction profile. Low gas velocities. Axial position of the CREC−GS−Optiprobes z=0.30 m.
... 151
Figure 8−22: Radial profiles for a) cluster particle velocity and b) particle volume fraction.
Intermediate gas velocities. Axial position of the CREC−GS−Optiprobes z=0.30 m. ... 152
Figure 8−23: Radial profiles for a) cluster particle velocity and b) particle volume fraction.
High gas velocities. Axial position of the CREC−GS−Optiprobes z=0.30 m. ... 153
Figure 8−24: Comparison between CPFD simulations and experimental results for cluster
particle velocity and particle volume fraction. (a) Cluster particle velocity (m/s), and (b) Particle volume fraction. ... 154
Figure 8−25: (a) Radial velocity profile, (b) Particle volume fraction. Operating condition:
xix
Figure 8−26: Comparison of the CPFD simulations and experimental data for the cluster void
xx
List of Appendices
Appendix A: Fluid Catalytic Cracking (FCC) Catalyst ... 177
Appendix B: Camera Beam Profiler ... 181
xxi
Nomenclature
A Downer reactor internal area, m2
Ac Cluster cross−section area, m2
As Single particle cross−section area, m2
Particle acceleration vector (, , ), m/s2
Cd Drag coefficient
ds Particle diameter, m
Drag coefficient at a particle location
fd Drag force, N
fb Buoyancy force, N
fg Force of gravity, N
Rate of momentum exchange between phases, N/m3
Particle drag force, N
Particle distribution function (PDF)
Particle distribution function with collision damping
Gs Solid mass flux, kg/m2·s
g Gravitational acceleration, m/s2
h Downer length, m; or Characteristic dimension of the sensing region (focal point), m
K Drag expression constant
, Functions of
lo Object distance, m
l1 Image distance, m
m Total number of cluster detected above the baseline for a specific time
Particle mass, kg
Gas molecular weight, g/mol
xxii
N Number of particles in a cluster having the same average diameter of 84.42 µm
Number of particles fed per average unit volume
Pressure, Pa
r Downer radial position, m
R Downer Internal Radio, m; or Universal gas constant, J/mol·K
Reynolds number
RXY Cross−correlation sequence
Equivalent cluster radio, m
! Rate of deformation, 1/s
" Temperature, K
# Time, s
Usg Superficial gas velocity, m/s
Us Terminal solid velocity, m/s
Ug Gas velocity, m/s
Uslip Slip velocity, m/s
$ Particle velocity vector (%, %, %), m/s
& Particle volume, m3
&' Cell volume, m3
Vc Cluster volume, m3
we Effective weight force, N
X Time series signal average, V
X Cluster time series, V
Y Cluster time series, V
Particle spatial location vector (xx, xy, xz), m
xxiii
Greek Symbols
( ! The Dirac delta function
∆ti Sensor signal time length, s
)* Particle volume fraction at the close packing limit
) Gas volume fraction
) Particle volume fraction + Gas dynamic viscosity, Pa·s
, Cell number
ρs Particle density, kg/m 3
- Gas density, kg/m3
σ Standard deviation
. Gas stress tensor, N/m2
. Particle normal stress tensor, N/m2 / Collision damping time, s
Sphericity
Acronyms
CCD Co−Current Downflow or Charge Coupled Device
CCU Co−Current Upflow
CDCFB Concurrent Downflow Circulating Fluidized Bed
CFB Circulating Fluidized Beds
CFD Computational Fluid Dynamics
CPFD Computational Particle Fluid Dynamics
CREC−GS−Optiprobe Chemical Reactor Engineering Centre Gas Solid Optiprobe
xxiv
ECT Electrical Capacitance Tomography
FCC Fluidized Catalytic Cracking
GRIN Graded Refractive Index
GUI Graphical User Interface
KTGF Kinetic Theory of Granular Flow
LPG Liquefied Petroleum Gas
MP−PIC Multiphase Particle−In−Cell
Chapter 1
1
Introduction
Circulating Fluidized Beds, commonly designated with the CFB acronym, have been used as efficient gas−solid contact reactors in a broad range of applications. The origins
of CFBs can be traced back to the 1940s. Starting in the 1960's to the 1970's CFBs have been the basis of a number of catalytic and non−catalytic processes for the manufacture
of a variety of intermediate and consumer end products (Squires, 1994; Reh, 1971).
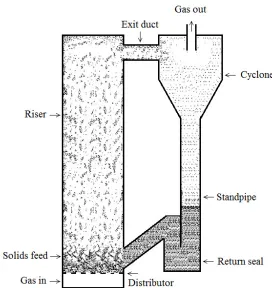
A typical configuration for gas–solid CFB systems includes the use of a riser: a tall reactor where the particles move upwards in contact with the gas phase. Following their circulation in the riser, solids flow through a system, usually involving: one or more cyclones, a standpipe, and a valve or seal. These external components constitute of a loop, allowing particles to be fed back into the riser unit. One should notice that individual particles circulate many times in this loop, while the fluid flows through the riser only once (Grace and Bi, 2003). A typical setup for a CFB is reported schematically
in Figure 1−1.
When comparing CFB reactors with conventional bubbling fluidized bed reactors and other gas−solid contactors such as packed beds, CFB present several advantages such as:
a) high gas throughputs, b) limited backmixing of gas, c) better temperature uniformity, d) flexibility in handling particles of widely differing sizes, densities, shapes and cohesivity, e) effective contact between gas and particles, f) limited gas bypassing with minimal mass transfer limitations, and g) opportunity for separate and complementary operation (e.g., catalyst regeneration or particle cooling) in the return loop.
Even though the predominant interest in CFB systems continues to be for gas–solid (two phase) contactors, in recent years, CFBs have also been used for liquid–solid systems and gas–liquid–solid (three−phase) systems. Furthermore, the technical literature also reports
Figure 1−−−−1: Circulating Fluidized Bed typical configuration.
One of the major applications of gas–solid CFB systems, using risers as the main reactor, can be found in Fluidized Catalytic Cracking (FCC) units. In these systems, it is imperative to simultaneously conduct the cracking reactions at the surface of the catalyst, limiting the coking of the catalyst (Chen, 2003).
When examining the key operating variables for the commercial operation of gas–solid CFB riser systems, one can notice that they are bracketed into the following operational ranges (Grace and Bi, 2003): Superficial gas velocity: 2−12 m/s; net solid flux through
the riser: 10–1000 kg/m2s; temperature: 20–950 oC; pressure: 100–2000 kPa; mean particle diameter: 50–500 µm; and overall riser height: 15–40 m.
While gas–solid CFB reactor systems, using risers, offer significant advantages over conventional bubbling fluidized bed reactors and packed beds, they may suffer from significant back mixing. Ideally, a uniform gas–solid suspension in the riser section is desirable, in which both the discrete and continuous phases move in plug flow mode. However, this regime is far from being achieved in some riser units and particularly, in
the feeder section. As a result, a core−annulus model has been proposed with a flow
structure inducing radial segregation of gas and solids. This flow structure reduces the overall contact between the two phases, diminishing the desired selectivity and leading to
a non−uniform distribution of the desired product (Zhu et al., 1995; Wang et al., 1992).
One should notice that the severe particle back mixing observed in risers is mainly the result of gas and solids moving upwards against the gravity. This, as a result, involves, an unfavorable hydrodynamics which can be largely overcome in a new gas−solid CFB
configuration designated as “downer unit”.
Regarding downer units, gas and particulates move concurrently downwards, in the same direction as gravity. As a result one benefits from a enhanced and more uniform radial gas and a solid flow structure. Thus, in downer reactors, the flow structure involves a gas−solid suspension with individual particles relatively well distributed in a continuous
These external field forces provide a relatively homogenous diluted particle flow displaying low solid hold−ups, short residence times and a relatively large loading ratio.
Due to these properties, downers have attracted attention both in fundamental research and for practical applications. (Brust and Wirth, 2004; Zhu et al., 1995; Wang et al., 1992).
Commonly, a downer reactor consists of a vertical column with gas and solid distributors at the top and one or more gas−solid separators at the bottom. Typically, the downflow
section is a straight vertical tubular conduit of constant diameter. For catalytic reactions, the reactor section is preferably manufactured to provide an inner surface which is as straight and smooth as possible.
Table 1−−−−1: Some application areas for gas−−−−solid Circulating Fluidized Bed systems using downers.
Applications Reference
Thermal cracking of waste plastics derived oil (Jiao et al., 1998) Fluid Catalytic Cracking (FCC) to maximize refinery
gasoline and/or propylene
(Jin et al., 2014; Chuachuensuk et al., 2013; Koratiya et al., 2010; Wu et al., 2009; Maadhah et al., 2008; Shaikh et al., 2008; Fujiyama et al., 2005; Abul−Hamayel, 2004; Deng et al., 2002; Talman et al., 1999)
Production of polymeric materials with superior physical
properties (Mei et al., 2006)
Coal pyrolysis (Coal gasification) (Cheng and Wang, 2014; Cheng et al., 2014, 2013; Dong et al., 2012; Cheng et al., 2008; Kim et al., 2001) Partial oxidation of n−butane to Maleic Anhydride (MAN) (Vaishali et al., 2010)
Ozone decomposition (Li et al., 2011)
Biomass pyrolysis (Ding et al., 2012; Berg et al., 1989) Carbon dioxide capture (Kongkitisupchai and Gidaspow, 2013)
In this respect, one can foresee that in a downer reactor FCC plant, the catalyst and gas contact times could be better controlled with a significant reduction in overcracking and particle backmixing. It is thus expected that, the use of downer reactors could increase the desired intermediate chemical species in the cracking of vacuum gas oil such as gasoline, in this new approach the function of the downflow section is to complete the cracking reactions while providing a flow field which prevents phase segregation (Chuachuensuk et al., 2013; Koratiya et al., 2010; Wu et al., 2009; Maadhah et al., 2008; Shaikh et al., 2008; Fujiyama et al., 2005; Deng et al., 2002; Talman et al., 1999).
In a cold model laboratory downer, gas−solid downflow and solid circulation are usually
achieved in a concurrent downflow circulating fluidized bed (CDCFB). Here, solids are separated from the gas stream at the bottom of the downer and are carried upwards in an accompanying riser to the top of the downer.
There have been, in recent years, valuable papers on downer fluid dynamics published in the technical literature. These articles chiefly consider slip velocity and solid concentration radial profiles while providing little reference regarding individual particle cluster properties (Abbasi et al., 2013; Islam et al., 2010; Islam, 2010; Qi et al., 2008; Nova et al., 2007, 2004b; Nova, 2005; Li et al., 2004; Manyele et al. , 2003, 2002; Krol et al., 2000; Talman et al., 1999; Tuzla et al., 1998; Zhu et al., 1995; Wang et al., 1992).
To enhance the study of cluster particles, de Lasa et al. (1998) patented a novel optical fiber sensor. This sensor is a relatively simple and economical device. It has the potential of being able to measure local parameters, as required by the fluid dynamic characterization in gas−solid downer units. This sensor designated as the
CREC−GS−Optiprobe uses a Graded Refractive Index (GRIN) lens. This GRIN lens
creates a highly irradiated region at a few millimeters in front of the probe tip. As a result, particles reflect laser rays while moving through the highly irradiated region. These rays are captured by strategically located receiver optical fibers and are then converted to corresponding electrical signals. As a result, the CREC−GS−Optiprobe
Since the patent described above was implemented, de Lasa’s research team has been considerably involved in experimental hydrodynamic studies in downer reactors using the patented fiber optical probe device. Nova et al. (2004a, 2004b) primarily discussed the novel CREC−GS−Optiprobe design principles, construction and experimental results.
Islam et al. (2011b) discussed the CREC−GS−Optiprobe, its effective focal region
estimation using geometrical optics. Furthermore, experimental data and time signal results have been analyzed in the CREC−labs using various statistical approaches. Nova
et al. (2004b) reported particle cluster properties in downflow reactors. Clusters were characterized by relating signal “trains” which complied with the constraint of being in 5% of the highest peak. In addition, peak widths were measured at a reference level, crossing the signal at 50% of the height of the highest peak in the signal train. On the other hand, Islam et al. (2011a, 2010) proposed that signal peak widths could be calculated with a baseline set at the signal average plus three times the standard deviation (x+3σ). Due to the technical limitations of the data analysis (Islam et al., 2011a, 2010; Nova et al., 2004b), it was not possible to correlate individual peak signals assigned to clusters.
Taking advantage of various data acquisition enhancements, Lanza et al. (2012) reported, for the first time, “individual cluster” information such as: a) cluster solid concentrations, b) individual cluster slip velocities, c) cluster sizes, and d) cluster drag coefficients. Lanza et al. (2012) developed a rigorous methodology setting the data baseline using the solid phase mass balance. Thus, using this approach, the baseline was selected for every operational condition in compliance with the solid mass balances. This approach provides a new data analysis method which circumvents the use of an arbitrary (empirical) and fixed data baseline level, as in prior studies. Additionally, Lanza et al. (2012) also proposed a mechanistic based method to calculate cluster drag coefficients, with this being a function of the cluster length and cluster particle size configuration of each particle cluster. To further characterize the gas−solid flow in downer units, Lanza et al.
Mathematical modeling of gas−solid flow has recently received considerable attention
because of issues of stability and formulation of well−posed governing equations (Cheng
and Wang, 2014; Kim et al., 2011; Zhao et al., 2010; Andrews and O’Rourke, 1996). A promising mathematical technique is presented using the Computational Particle Fluid Dynamics approach (CPFD). In the CPFD method, the gas phase is treated as a fluid and is calculated using Eulerian computational grids, while the particle phase is modeled as discrete particles using Lagrangian numerical−particles. The fluid phase is described by
mass and momentum conservation equations including the strong coupling to the particle phase. The particle phase is accounted for by using a particle probability distribution
function. The particle momentum equation is based on a multiphase particle−in−cell
(MP−PIC) method. In this regard, the use of CPFD, for downer simulations, may have
significant advantages in describing the particle−fluid patterns and special flow features
such as the inherent rotational flow properties.
Regarding the use of CPFD, to characterize the gas−solid flow in downers, Abbasi et al.
(2012) reviewed the intrusion effects of the CREC−GS−Optiprobes in a downer reactor.
These authors found that local axial gas and particle velocities, cluster sizes and particle volume fractions can be obtained by using the focal region of the CREC−GS−Optiprobes
with essentially undisturbed measurements. Furthermore, based on CPFD, Abbasi et al. (2013) discussed multiphase flow patterns in a downflow reactor using three dimensional numerical simulation algorithms, with the following being described: a) local and time variations of fluid dynamic properties in downers, and b) circumferential solid fluxes, which both leading to particle motion with radial velocity components.
Thus, given the status of the development of downer models and the potential interest in scaling them up, one can acknowledge the significance of specific model validation using
experimental data. As a result, in the present PhD dissertation, a gas−solid downflow
experimental and simulated results provides strong support for a phenomenologically based model for downer units.
During the development of the present PhD dissertation four articles were drafted, two of them were already published and the other two are going to be published in reputable chemical engineering journals as well. Professor H. de Lasa (supervisor) is co−author in
all of them. He provided helpful recommendations throughout the whole research project and suggested key corrections to the draft versions of all four manuscripts. Additionally,
Dr. M. Islam is co−author in the first three manuscripts. He performed the experiments in
one of the two downer units studied. His unprocessed data was used for the elaboration of the first three papers. Regarding the present PhD dissertation, chapters are presented as follows:
Chapter 2 summarizes the literature review, relevant to the area of research. Chapter 3 of this thesis, outlines the main objectives of the research project and the accomplishment of the research objectives. Chapter 4 describes the experimental equipment and measurement methods used in this study.
Chapter 5 and partially Chapter 6 are based on a first publication, entitled "Particle
Clusters and Drag Coefficients in Gas−Solid Downer Units". This article was published
in Chemical Engineering Journal, volumes 200–202, pages 439–451, in June 2012. The PhD Candidate developed a new methodology for signal analysis, elaborated the computational program for his new data analysis method, estimated for the first time, “individual cluster” information such as: a) cluster solid concentrations, b) individual cluster slip velocities, and c) cluster sizes. He also proposed a mechanistic based method to calculate cluster drag coefficients in downer units, with this being a function of the cluster length and cluster particle size configuration of each particle cluster. He prepared the draft writing and implemented the corrections to the final manuscript.
The second part of Chapter 6 is based on a second publication, entitled "Particle Cluster
Size Distribution in Gas−Solid Downer Units". This article was published in the in "The
May 2013. The PhD candidate calculated cluster size distributions based on the results obtained using his new methodology, proposed for cluster analysis, in downers reactor units. He implemented modifications to his computational programs to account for radial position influence on cluster size distribution. He also prepared the draft writing and implemented the corrections to the final manuscript.
Chapter 7 is based on a third publication, entitled "Gas
−
Solid Fluid Dynamics in aDownflow Reactor: A CPFD Based Model" This manuscript is still under revision. The
PhD Candidate developed the Computational Particle Fluid Dynamics Simulations. He used the cluster size distribution and sphericity determined with his new methodology as an input for the simulations. He performed a discretization sensitivity analysis to obtain independent solutions. He determined all the computational parameters and compared them with the experimental data. He also prepared the draft writing and implemented the corrections of the final submitted version.
Chapter 8 is based on a four publication, entitled "Cluster Fluid Dynamics in Gas−Solid
Downflow Reactors: Experiments and CPFD Simulations ". This article is still under
Chapter 2
2
Literature Review
In a down flow reactor, the flow direction of both the gas and the solids is downwards in the same direction as gravity. This hydrodynamics is a distinctive characteristic of this unit which makes it unique when compared to other gas–solid systems. The down flow unit, designated frequently as a “downer” provides a relatively homogenous dilute flow structure, nearly plug−flow for both phases, low solid hold−ups, short residence times
and a relatively large solid/gas mass ratio. Due to these properties, downers attract the attention of researchers in both fundamental and applied technology areas. In this section, the hydrodynamics, feeders/distributors, cyclones/separators, cluster formation, numerical simulation, measurements of solid concentration, heat transfer, and applications of downer reactors are reported and discussed.
2.1 Downer Reactor Units
Down flow circulating fluidized beds, have attracted the interest of research engineering community, given their significant advantages when compared to other gas−solid systems
such as riser units (Arsenijević et al., 2014).
One of the first designs of downer reactors, dates back to the early 1970s, when Stone
and Webster began to develop a new type of reactor which consisted of a solid−gas feed
mixer, a downflow reactor section and a specially designed one−quarter−turn cyclone for
ultra fast gas−solid separation (Gartside, 1983; 1989). This reactor was reported to offer
very short residence times (~200 ms), near plug flow and a high temperature reaction environment. However, its jets displayed very high velocities (over 100 m/s), leading to considerable catalyst attrition in the mixing zone.
In down flow units, the solid particle flow is assisted by gravity since particle flow and gas flow are in a direction coincident with gravity. Solid particles, as a result, experience a so−called “slip velocity” or difference between particle velocity and gas velocity, with
The slip velocity can, for a single particle, be estimated using the law of particle mechanics, which accounts for the balance of forces exerted on a particle. In this respect, in downers units, where there is a high population of particles moving simultaneously, particles may influence each other, while falling side−by−side or while travelling one
behind the other. This condition may favor a drag force reduction, with a mass increment due to the consolidation of agglomerates. All this, may contribute to a rise in slip velocity. For instance, if two identical spheres fall one behind the other, with a separation distance smaller than a critical distance, their velocity may be increased by up to 50% (Islam, 2010; Nova, 2005; Krol et al., 2000).
2.2 Hydrodynamics of Downers
The main difference in the operation of risers and downers, lies in the fact that the flow direction is against or along the gravity force. As a result, the hydrodynamics in downer units show a unique flow structure across both the axial and radial directions.
The technical literature describes downers as having unique hydrodynamic characteristics (Wang et al., 1992). These distinctive hydrodynamic characteristics are described referring to three axial flow sections with different pressure drops as follows: a) inlet section, b) acceleration section and c) fully developed flow section.
Herbert et al. (1998) studied the axial pressure gradient profile in pilot scale downflow circulating fluidized beds and concluded that the system pressure gradient remained constant beyond the inlet section. Zhang (1999) obtained axial profiles of other measured variables such as solid holdup, solid velocity, solid mass flux and pressure loop in a downer system.
non−uniform property distribution. In this respect, Lehner and Wirth (1999) and Wang et
al. (1992) claim that there is a dense ring of solid particles located near the unit wall.
In summary, in spite of the promise of downer reactor units, there are still issues that need to be clarified regarding the radial distribution of properties in downers.
2.2.1 Axial Flow Sections
In a downer reactor, gas and particles are fed from the top of the downer using gas and particle distributors. While particle velocities are initially close to zero, their contact gas is evolving at high velocity (somewhat in excess of the superficial velocity). Solids are then accelerated by both the combined effect of gas flow (drag) and gravity.
As a result, particles accelerate, until their velocity reaches the gas velocity. This segment is designated as the first acceleration section. As particle velocity increases in the first acceleration section, the actual average linear gas velocity decreases moderately due to the reduced solids concentration across the downer section (Zhu et al., 1995; Wang et al., 1992).
Furthermore, after acquiring the same velocity of the gas phase, solids are further accelerated by gravity. This occurs while encountering drag forces exerted by the now slower moving gas phase. Therefore, particle velocity augments further, until the slip velocity between the particles display such as values, where gas drag forces fully counterbalance the gravitational force. This second segment is designated as a second acceleration section. In this section, particle velocity continues to augment, but at a reduced rate, compared with the increases observed in the first acceleration section. The reduction of gas velocity due to the change of solids concentration also remains small. One should mention that when the gravitational force balances the drag forces, both particle and gas velocities remain constant. This section (excluding any exit effect) is being designated as the constant velocity section. In this section, particles travel faster than gas, displaying a constant differential velocity designated as “slip velocity” (Zhu et
al., 1995; Wang et al., 1992). Figure 2−1 illustrates the three acceleration sections axially
Figure 2−−−−1: Axial gas−−−−solid flow structure in downers (Zhu et al., 1995).
2.2.2 Axial Distribution of Pressure
The axial distribution of pressure gradient profiles reported by Wang et al. (1992) and redrawn as a function of solids and gas velocity by Zhu et al. (1995) are shown in Figure 2−2.
Figure 2−−−−2: Axial distribution of pressure gradient. Effects of solids flux and gas velocity (Zhu et al., 1995).
It can be observed in Figure 2−2, that the pressure in the flow direction drops
is smaller than the gas velocity. As a result, particles are accelerated by both gravitational and gas drag forces. In order to describe pressure changes, a momentum balance equation can be considered along the downer as follows:
0 = − = 034-567 898 * ;9<
− 05AAA6AAA79**=>98 ?@ @> =?
− 05AAA6AAA7B9== C> *8 ?@ @= D=
(2−−−−1)
where and are the pressure at: point 1 at the downer top, and point 2 at the downer bottom, respectively. The 034- term represents the pressure losses due to solid hold up static head, 09**=>98 ?@ accounts for the energy loss due to solids acceleration and
0B9== C> *8 ?@ stands for the wall friction between point 1 and 2.
One should notice, that in the first acceleration section, the static head due to gravity is smaller than the one required to overcome the energy loss due to the drag exerted on particles. Thus, the 0 pressure change is negative.
In the second acceleration section, however, the particle velocity reaches the gas velocity. At this point, the pressure drop due to gravitational acceleration of particles, counterbalances the static head, resulting in a zero−drag free fall situation with zero
pressure gradients. This zero drag point establishes the boundary between the first and second acceleration regions.
Beyond the point of zero drag, the 0 pressure gradient increases monotonically as particles are further accelerated by gravity. The increase in particle velocity continues until particles reach a point where the gas particle slip velocity is established, as a result of the upward drag force counterbalancing the gravitational force. At this point of the axial position, the pressure gradient becomes constant, with the pressure continuing to increase linearly in the flow direction.
2.2.3 Radial Flow Sections
The structure of the gas and solid flow, in the radial direction, is still a controversial topic, with various researchers reporting different views. Irrespective of these differences, there is agreement in the technical literature about downers leading to flows with smaller radial changes than risers.
The radial distributions of the local solid holdups and the pressure gradients along the downer column were studied by Zhang et al. (1999a, 1999b). These authors characterized
the local and overall gas−solid flow structure, using a fibre optical solids concentration
probe and a series of pressure transducers. They found that in the fully developed section, the radial solid holdup changes were as follows: a) Quite uniform in the central core region, and b) Decreased either quite quickly or slowly in near wall annular region with this depending upon solids circulation, These authors claim that the uniform radial distribution of the solid flow can provide an almost ideal plug flow condition in the downer, with this being one key advantage of downers over risers. These authors also suggested that the excellent radial uniformity in the core of the downers could be assigned to the gravitational force influence acting in the same direction than the particle flow as well as to a self−limiting mechanism preventing formation of large particle
clusters.
On the other hand, Cao and Weinstein (2000a) studied radial solid density profiles in a downer using a X−ray imaging system. These authors found the existence of a
core−annulus dilute flow surrounded by a denser wall region.
Furthermore, Fan et al. (2008) studied radial distribution profiles of ozone concentrations in a gas−solid concurrent down flow circulating fluidized bed (downer) to characterize
al. (2008) also reported that the significant fall of the ozone concentration near the reactor wall corresponds to higher superficial gas velocities at a given solid circulating rate. These authors pointed out that in the fully developed section, ozone decomposition is facilitated vis−a−vis the ozone conversion in the acceleration region due to the lateral
particle migration. They suggested that a more systematic work should be done to understand the mass transfer in the near−wall region of the downer.
2.3 Feeders/Distributors
A major issue in the design of solid distributors of downer reactors is the gas and solid feeder design and operation. Downer feeders are characterized by ultra−short contact
times (less than 1 s). The particulate phase needs to be rapidly dispersed in the gas flow. If this is not accomplished, a poor designed distribution at the downer entry, may cause fast reaction rates at some locations. In this respect, it is desirable that the inlet distributor of the downer provide a uniform distribution of phases from the very beginning with, quick solid acceleration and excellent control of gas–solids mixing. This will ensure that claimed advantages of downer reactors are implemented.
Cheng et al. (2008) mentioned that the major challenge to promote good initial gas–solid mixing comes from the gravity forces acting on the particles. At the entry, solids tend to drop immediately downward and cannot reflux or circulate. Recent studies on downer reactors have shown that a plug flow condition may not always be achieved in the fully developed section (Zhang et al. 1999a, 1999b). It has also been demonstrated that the design of the gas/solid distributors at the top of the reactor influences the flow pattern significantly (Johnston et al., 1999).
Given the interest in these matters, in the upcoming sections, the influence of the inlet distributor of downers on the gas−solid flow behavior is presented.
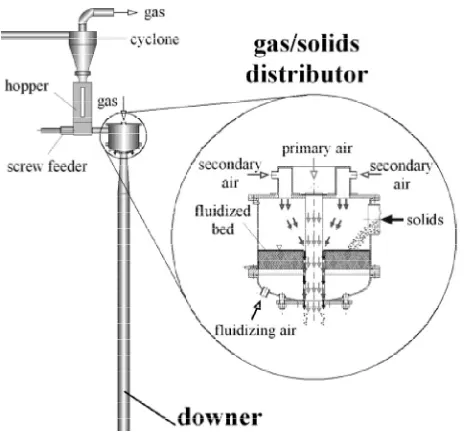
distributor. The application of additional air improves the gas/solid mixing process at the outlet of the distributor. In fact, the operation of the unit at high gas/particle velocity ratio generates a strong backmixing of the solid material at the entrance region of the downer. This leads, as a consequence, to a wide residence time distribution of the gas. Nevertheless, they also reported that it is possible to operate the downer in plug−flow like
conditions. To achieve this, researchers suggested that both high superficial gas velocities and low solid velocities are essential at the feeder inlet.
Figure 2−−−−3: Gas/solid distributor section of the downer unit used by Brust and Wirth (2004).
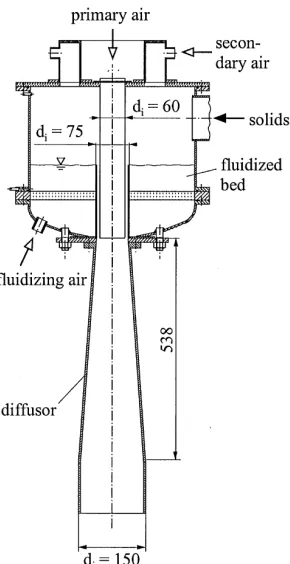
A detailed design of the distributor used by Lehner and Wirth (1999) is shown in Figure 2−4. Solids are fed to a fluidized bed with a screw feeder. The main feature of the
Figure 2−−−−4: Setup of the gas/solid distributor used by Lehner and Wirth (1999). In this Figure the units are reported in mm.
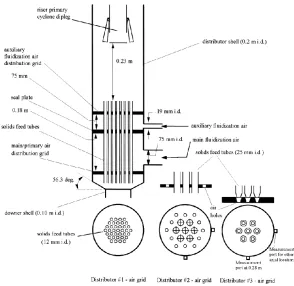
Three distributor designs were used by Johnston et al. (1999) to test the gas/solid flow conditions at the entrance region of a downer unit. Pressure gauges were employed to measure the pressure gradient profiles, while fibre−optic probes were used to measure
particle velocity and solids hold−ups. These authors found that the development of the
axial gas/solid flow is highly dependent on the distributor type.
Cheng et al. (2008) reports a description of six of the representative inlet configurations of downer reactors found in the literature.
Regarding the effects of the distributor design on the hydrodynamics of a high−density
downer reactor, they were considered by Song et al. (2005). These authors identified significant differences in local flow structure between low−density and high−density
operating conditions in downers. They reported that as the gas velocity was raised from 0
became less uniform (denser near the wall and more dilute at the centre). These results are distinctively different from the ones found at low solids fluxes.
Figure 2−−−−5: Three distributor designs used by Johnston et al. (1999).
Regarding the design of the downer inlet, one can notice that it has drawn much attention because of its strong potential impact on the overall reactor performance. This is especially important, given that in downers, the overall residence time can range from milliseconds to seconds. Thus, a good distribution of solids at the injection section is critical. Although many designs have been studied in the literature, more work has to be carried out to achieve reliable designs as may be required for large scale units in industry.
2.4 Cyclones/Separators
primary reasons for separating gases from solids in solid processing plants: 1) to minimize emissions for environmental purposes, 2) to protect other processing equipment (turbines, etc) from particle streams, 3) to avoid losing the solids, and 4) to stop unwanted gas–solid reactions from occurring.
Downer reactors typically accommodate short contact time fast reactions, especially those where an intermediate product is the desired product. Fast separation, is therefore, very critical. When the gas and solid residence/reaction time in the downer itself, is only a fraction of a second, a cyclone with solid residence times in the order of 1−2 s is still
unacceptable. Non−traditional ultra fast and more efficient gas−solids separators are,
therefore, needed to achieve quick separation.
In 2010, an integrated gas−solid inertial separator was designed by Huard et al. (2010) for
implementation in a downer reactor used for the pyrolysis of biomass feedstock. In the case of a pyrolysis unit, product gases emerging from the pyrolysis reactor must be quickly separated from the heat−bearing solids in order to terminate the reaction, thereby
Figure 2−−−−6: Inertial separator designed by Huard et al. (2010).
Figure 2−−−−7: Short−−−−contact cyclone reactor designed by Zhang et al. (2013).
A short−contact cyclone reactor for fluid catalytic cracking was designed by Zhang et al.,
(2013), see Figure 2−7. This reactor mainly includes two sections: a reaction chamber
reactor had a good contact and separation effect. Simulated results were in reasonable agreement with the experimental findings.
One can then notice, that the gas–solid separator at the downer outlet plays a similarly significant role to the downer inlet design. The short, uniform contact times between catalysts and gas, require fast separation of gas and solids at the outlet to avoid consecutive reactions.
2.5 Cluster Formation in Downers, Radial an Axial
Distribution
In a downer, the different phases (gas and solids) can aggregate to form transient structures. These structures can be grouped into two types, a dilute phase (more dispersed) and a cluster phase (more dense). These structures can be affected by the system boundaries and by their own interactions forming complex macro−structures
characterized by mean radial and axial solids distributions. It is also known, that particle clusters may limit good multiphase mixing inside the system. Thus, particle clustering may have a negative effect on the system chemical reaction conversion. Therefore, the study of these transient flow structures in downers, can elucidate which mechanisms are important, for the control of flow behavior, and for the design, scale−up and overall
control of downers.
Several researchers have performed experimental studies on the flow structures in downers. Wang et al. (1992) showed that in a downer, the particle concentration was uniform in the radial direction except for the position near the wall, where a dense phase zone existed. Krol et al. (2000) studied the cluster formation in down flow reactors by using a new optical sensor, the CREC−GS−Optic probe. These authors found that solids
evolved as strings of particles and that the average cluster size ranged from 2 to 6 dp with a most probable string size of 3.5 dp. Manyele et al. (2003) reported that the flow
non−uniformities in downers are mainly influenced by operating conditions (especially
the gas velocity). Non−continuous trends of microscopic parameters were observed with
Lu et al. (2005) studied the flow structures in downers by a micro−video analysis of local
voidage signals. The micro−video action shot showed that there were particle clustering
phenomena in the downer and that the clusters existed mainly in the form of flocks and sticks. Through wavelet analysis of local voidage signals, a probability density of cluster sizes at different bed lengths was obtained. The probability density distributions of local voidage signals confirmed that the clusters in the downer were unstable and could not form a stable phase.
These researchers reported that the size of the clusters is augmented with an increase in the solid circulation rate and/or a decrease in the superficial gas velocity in the downer. This could be attributed to the fact that the higher the solid concentration is, the more easily the larger clusters can be formed. With an increasing number of particles in the cluster, the effective drag force that each particle sustains is reduced. This results in an increase of the cluster velocity (Krol et al., 2000). However, a further increase in the velocity of the cluster leads to a decrease in the cluster size. This is due to the dissipation and the break of clusters. On the other hand, increasing the solid circulation leads to an increase in the concentration of solids, followed by formation of larger clusters (Karimipour et al., 2006).
Cheng et al. (2008) reported a core−annulus system flow pattern in downers, at the
annulus or wall region, where solid particles agglomerate and form particle clusters. It can be noticed that, the way to identify and characterize the important parameters of particle clusters, diameter and concentration, in the technical literature, is still in a development stage.
loosely collected particles, and these particles have the same flow direction as the bulk flow so that no particle backmixing could be observed. One of the most recent publications on cluster formation in downers using computational fluid dynamics was presented by Chalermsinsuwan et al. (2013). These researchers calculated the particle cluster diameters and concentrations from two−dimensional CFD simulation results by
using the concepts of kinetic theory of granular flow and statistic, in the CFB downer, a dilute core−annulus flow structure was reported. They claimed that the computer capacity
remains the limitation for simulating a complex system. Although the two−dimensional
model is proven to represent the three−dimensional system in their study, the
three−dimensional model is more realistic than the two−dimensional model with higher
computational effort.
2.6 Computational Fluid Dynamics
With the development of computing facilities nowadays, computer simulations have become an important experimentation complement in the study of multiphase hydrodynamics. In particular, various computational approaches and numerical schemes have been adopted to study flow characteristics in downer systems (Ge et al., 2011).
Cheng et al. (2001) reported a gas−turbulence solid−turbulence model to simulate the
hydrodynamics in the entrance region of a downer. They showed that predicted profiles of local solid fractions and particle velocity display good agreement with the experimental results. Bolkan et al. (2003) integrated hydrodynamic features of circulating fluidized beds into a computer simulation of a downer reactor. They reported an empirical correlation when estimating average cluster sizes. They also presented a correlation for estimating the particle–wall friction factor. The hydrodynamic behavior of the gas–solid suspension, within the downer both in the developing−flow as well as in the
downer fully developed flow regions, was successfully estimated.