ISSN (Print) : 2320 – 3765 ISSN (Online): 2278 – 8875
I
nternational
J
ournal of
A
dvanced
R
esearch in
E
lectrical,
E
lectronics and
I
nstrumentation
E
ngineering
(An UGC Approved Journal)
Website: www.ijareeie.com
Vol. 6, Issue 8, August 2017
Impulsive Noise Removal in Standard Images
Using Different Filters
Swapna S. Bhapkar
1, Babasaheb V. Pawar
2PG Student, Dept. of E&TC, PVPIT, Bavdhan, Pune, Maharashtra, India 1
Professor, Dept. of E&TC, PVPIT, Bavdhan, Pune, Maharashtra, India 2
ABSTRACT: The sources of impulse noise in digital images are image digitization or image transmission. Environmental conditions during image acquisition and quality of sensing elements affect the performance of sensors. Images are corrupted by noise during transmission due to interference in the channel which is used for transmission. Image processing is used in various applications such as face recognition, image segmentation, and edge detection. Hence it is necessary to remove noise in image before these subsequent processing. In this paper impulse noise is removed by using median filter, adaptive median filter and DTBDM method.
KEYWORDS: Impulse noise, Median filter, Adaptive median filter and DTBDM.
I.INTRODUCTION
The impulse noises are of two types. First is fixed-valued impulse noise and second is random-valued impulse noise. Fixed value impulse noise is also known as salt and pepper noise. In the former method pixel value of the noisy pixel is either minimum or maximum in grey-scale images. In the latter method pixel value of the noisy pixel is uniformly distributed in [0,255] range in the grey-scale images.The removal of SPN (salt and pepper noise) is easier rather than RVIN (Random valued impulse noise). Most of the reported schemes work well under the SPN but fails under RVIN, which is more realistic when it comes to real world applications. It is also observed the performance of any filtering
scheme is dependent on the detection mechanism. The better is the detector, the superior is the filtering performance. Hence the performance of a detector plays a vital role. The detector performance is solely dependent on a threshold value which is compared with a pre computed numerical value. To improve the detector performance need for an adaptive threshold is an utmost necessity which can be automatically determined from the characteristics of an image and the noise present on it. Impulse noise which is added in images can be removed by using median, adaptive median and DTBDM method.
II. MEDIAN FILTER
ISSN (Print) : 2320 – 3765 ISSN (Online): 2278 – 8875
I
nternational
J
ournal of
A
dvanced
R
esearch in
E
lectrical,
E
lectronics and
I
nstrumentation
E
ngineering
(An UGC Approved Journal)
Website: www.ijareeie.com
Vol. 6, Issue 8, August 2017
III.ADAPTIVE MEDIAN FILTER
For good impulse classification it is preferred to remove the positive and negative impulse noise one after another. There are number of algorithms which resolve this problem, but they are more complex. This algorithm is simple and better performing in removing a high density of impulse noise as well as non-impulse noise while preserving fine details. The size of filtering window of median filter is adjusted based on noise density. This algorithm is based on two level tests. In the first level of tests, the presence of residual impulse in a median filtered output is tested. If there is no impulse in the median filtered output, then the second level tests are carried out to check whether the center pixel itself is corrupted or not. If the center pixel is uncorrupted then it is retained at the output of filtered image. If not, the output pixel is replaced by the median filter output. On the other hand, if the first level detects an impulse, then the window size for median filter is increased and the first level tests are repeated. The maximum filtering window size taken is 11×11 if the noise density is of the order of 70%.
IV.DECISION TREE BASED DENOISING METHOD
The decision tree is a simple but powerful form of multiple variable analysis. It can break down a complex decision-making process into a collection of simpler decisions, thus provide a solution which is often easier to interpret. It has detector and edge preserving filter. To detect the noise it has different modules like Isolation module, fringe module and similarity module.
V. RESULT AND DISCUSSION
The path of the input image is defined in MATLAB. Input image of size 256x256 pixels is used in MATLAB and converted into grayscale image, if image is color image, using matlab code. Random valued impulse noise is added in input images in MATLAB environment. 1%, 2%, 3%, 4%, 5%&15% impulse noise is added and tested for input images.
1. MATLAB Results for Cameraman Image:
ISSN (Print) : 2320 – 3765 ISSN (Online): 2278 – 8875
I
nternational
J
ournal of
A
dvanced
R
esearch in
E
lectrical,
E
lectronics and
I
nstrumentation
E
ngineering
(An UGC Approved Journal)
Website: www.ijareeie.com
Vol. 6, Issue 8, August 2017
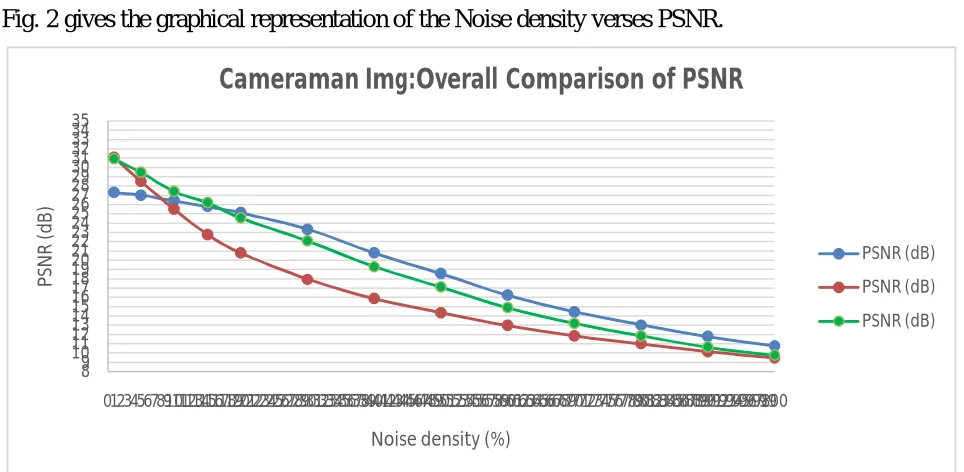
The increase in noise variation affects the PSNR of the image. The results for various filter are shown below
.
Noise %
PSNR (dB) Median
filter
Adaptive
filter DTBDM
1 27.2901 31.0501 30.9085 5 26.9992 28.466 29.4458 10 26.42 25.4895 27.3929 15 25.7885 22.7523 26.1894 20 25.116 20.7683 24.5444 30 23.3273 17.9632 22.0773 40 20.7744 15.853 19.2955 50 18.5566 14.3325 17.1021 60 16.234 12.9687 14.8824 70 14.4371 11.8524 13.1895 80 13.0525 11.0016 11.8553 90 11.7722 10.1552 10.6447 100 10.7674 9.4903 9.7621
Table 1. : PSNR value for different noise density using cameraman image
Fig. 2 gives the graphical representation of the Noise density verses PSNR.
Fig.2 Comparison of PSNR with Different Noise density using cameraman image 8
9 10 11 12 13 14 15 16 17 18 19 20 21 22 23 24 25 26 27 28 29 30 31 32 33 34 35
0123456789101112131415161718192021222324252627282930313233343536373839404142434445464748495051525354555657585960616263646566676869707172737475767778798081828384858687888990919293949596979899100
P
SN
R
(
d
B
)
Noise density (%)
Cameraman Img:Overall Comparison of PSNR
PSNR (dB)
PSNR (dB)
ISSN (Print) : 2320 – 3765 ISSN (Online): 2278 – 8875
I
nternational
J
ournal of
A
dvanced
R
esearch in
E
lectrical,
E
lectronics and
I
nstrumentation
E
ngineering
(An UGC Approved Journal)
Website: www.ijareeie.com
Vol. 6, Issue 8, August 2017
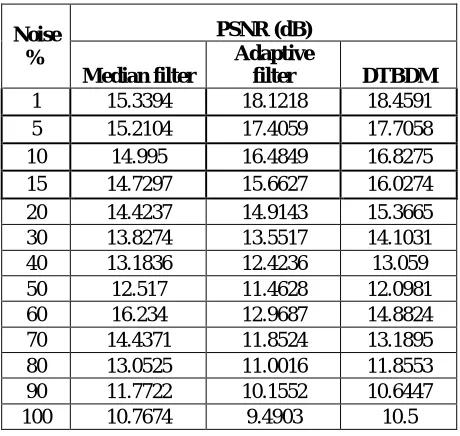
2. MATLAB Results for Board Image:Impulse noise is added in Board image and is removed by using different filters.The increase in noise variation affects the PSNR of the image. The results for various filter are shown below.
Table 2. PSNR of Board Image
Fig 3 gives the graphical representation of the Noise density verses PSNR.
Fig 3. Comparison of PSNR with Different Noise density using Board image 8
9 10 11 12 13 14 15 16 17 18 19 20 21 22 23 24 25 26 27 28 29 30 31 32 33 34 35
0 5 10 15 20 25 30 35 40 45 50 55 60 65 70 75 80 85 90 95 100
P
SN
R
(
d
B
)
Noise density (%)
Board Img:Overall Comparison of PSNR
PSNR (dB)
PSNR (dB)
PSNR (dB)
Noise %
PSNR (dB) Median filter
Adaptive
filter DTBDM
ISSN (Print) : 2320 – 3765 ISSN (Online): 2278 – 8875
I
nternational
J
ournal of
A
dvanced
R
esearch in
E
lectrical,
E
lectronics and
I
nstrumentation
E
ngineering
(An UGC Approved Journal)
Website: www.ijareeie.com
Vol. 6, Issue 8, August 2017
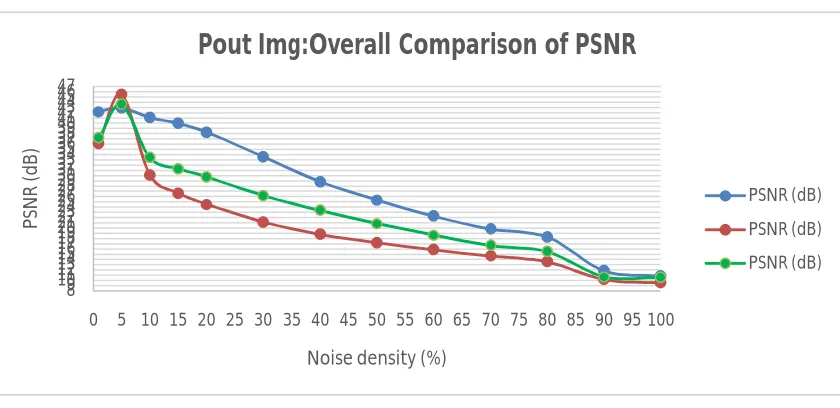
3. MATLAB Results for Pout Image: Impulse noise is added inpout image and is removed by using different filters.The increase in noise variation affects the PSNR of the image. The results for various filter are shown below.
Noise %
PSNR (dB) Median filter
Adaptive
filter DTBDM
1 42.1811 36.1027 37.1662 5 42.883 45.4654 43.5687 10 41.0631 30.0659 33.4179 15 39.9405 26.5679 31.2613 20 38.208 24.4969 29.707 30 33.5307 21.0734 26.1256 40 28.7797 18.765 23.3126 50 25.3152 17.1456 20.819 60 22.2294 15.8253 18.63 70 19.7772 14.6374 16.6459
80 18.234 13.54 15.453
90 11.7722 10.1552 10.6447 100 10.7674 9.4903 10.5
Table 3. PSNR of Pout Image
Fig 4 gives the graphical representation of the Noise density verses PSNR.
Fig.4 Comparison of PSNR with Different Noise density using Pout image 8 9 10 11 12 13 14 15 16 17 18 19 20 21 22 23 24 25 26 27 28 29 30 31 32 33 34 35 36 37 38 39 40 41 42 43 44 45 46 47
0 5 10 15 20 25 30 35 40 45 50 55 60 65 70 75 80 85 90 95 100
P SN R ( d B )
Noise density (%)
Pout Img:Overall Comparison of PSNR
PSNR (dB)
PSNR (dB)
ISSN (Print) : 2320 – 3765 ISSN (Online): 2278 – 8875
I
nternational
J
ournal of
A
dvanced
R
esearch in
E
lectrical,
E
lectronics and
I
nstrumentation
E
ngineering
(An UGC Approved Journal)
Website: www.ijareeie.com
Vol. 6, Issue 8, August 2017
Following fig 5 shows MATLAB results of PSNR value in dB for 7 different images.
Sr.
No Image Name
PSNR(dB)
0.05 ND 0.1 ND 0.15 ND 1 board 17.6618 16.8167 16.043 2 pout 37.1989 33.4147 31.1956 3 tire 33.8653 30.0666 27.8064 4 rice 35.4031 31.64442 29.4287 5 fabric 35.3089 31.9305 29.4898 6 pears 37.5278 34.0124 31.5775 7 bag 28.5796 26.8094 25.3238
Fig.5 PSNR Performance Measures of MATLAB for DTBDM
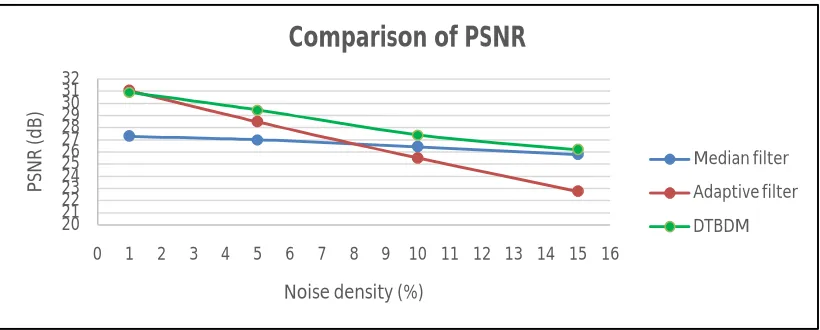
Following figuregives the graphical representation of the Noise density verses PSNR.
Fig 6. Comparison of PSNR with different Noise Density
Performance Metrics: Performance evaluation metrics like Peak-Signal-to-Noise Ratio (PSNR) is calculated for the input images for median filter and adaptive median filter technique in MATLAB. Peak-Signal-to-Noise Ratio (PSNR) The performance is calculated by PSNR. It is given by eq.
= 10 255
= ∑ −
Where, PSNR is peak-signal-to-noise ratio, MSE is mean square error, MxN is size of image, R is original image and X
20 21 22 23 24 25 26 27 28 29 30 31 32
0 1 2 3 4 5 6 7 8 9 10 11 12 13 14 15 16
P
SN
R
(
d
B
)
Noise density (%)
Comparison of PSNR
Median filter
Adaptive filter
ISSN (Print) : 2320 – 3765 ISSN (Online): 2278 – 8875
I
nternational
J
ournal of
A
dvanced
R
esearch in
E
lectrical,
E
lectronics and
I
nstrumentation
E
ngineering
(An UGC Approved Journal)
Website: www.ijareeie.com
Vol. 6, Issue 8, August 2017
V.CONCLUSION
Image denoising using adaptive median and median filter was also performed and compared. From the image filtering operations performed by adaptive median and median, it was then compared with the proposed method.
1. The PSNR decreases with increase in noise density.
2. The DTBDM method gives better result than those are given by median filter and adaptive median filters.
3. The computational complexity in DTBDM is low compared with other two methods consider. Hence it provide superior quality of result in terms of PSNR and image quality.
REFERENCES
1. Chih-Yuan Lien, Chien-Chuan Huang, Pei-Yin Chen, Member, IEEE, and Yi-Fan Lin, “An Efficient Denoising Architecture for Removal of Impulse Noise in Images,” IEEE Trans.Computers, vol. 62, no. 4, pp. 631-643, April 2013.
2. T. Matsubara, V.G. Moshnyaga, and K. Hashimoto, “A FPGA Implementation of Low-Complexity Noise Removal,” Proc. 17thIEEE Int’l Conf. Electronics, Circuits, and Systems (ICECS ’10), pp. 255-258, Dec. 2010.
3. H. Yu, L. Zhao, and H. Wang, “An Efficient Procedure for Removing Random-Valued Impulse Noise in Images,” IEEE Signal Processing Letters, vol. 15, pp. 922-925, 2008.
4. W. Luo, “An Efficient Detail-Preserving Approach for Removing Impulse Noise in Images,” IEEE Signal Processing Letters, vol. 13, no. 7, pp. 413-416, July 2006.
5. I. Andreadis and G. Louverdis, “Real-Time Adaptive Image Impulse Noise Suppression,” IEEE Trans. Instrumentation and Measurement, vol. 53, no. 3, pp. 798-806, June 2004.
6. I. Aizenberg and C. Butakoff, “Effective Impulse Detector Based on Rank-Order Criteria,” IEEE Signal Processing Letters, vol. 11, no. 3, pp. 363-366, Mar. 2004.
7. T. Chen and H.R. Wu, “Adaptive Impulse Detection Using Center-Weighted Median Filters,” IEEE Signal Processing Letters, vol. 8, no. 1, pp. 1-3, Jan. 2001.
8. T. Nodes and N. Gallagher, “Median Filters: Some Modifications and Their Properties,” IEEE Trans. Acoustics, Speech, Signal Processing, vol. ASSP-30, no. 5, pp. 739-746, Oct.1982.