A Novel Approach Towards K-Mean Clustering
Algorithm With PSO
Gursharan Saini M.Tech (Scholar) Department of CSE SBBSIET, Padhiana, Punjab (India)
Harpreet Kaur Sr. Assistant Professor
Department of CSE SBBSIET, Padhiana, Punjab (India)
Abstract—In this paper, the proposed approach is an unique combination of two most popular clustering algorithms Particle Swarm Optimization (PSO) and K-Means to achieve better clustering result. Clustering is a technique of grouping homogeneous objects of a dataset with aim to extract some meaningful pattern or information. K-Means algorithm is the most popular clustering algorithm because of its easy implementation and quick response. But it is inclined to produce local optimal solution due to its initial partition. The proposed method applied meta-optimization technique to overcome this limitation of K-Means with the help of PSO that offers a globalized search methodology but suffers from slow convergence near optimal solution. Here the proposed technique apply the result of PSO as the input seed of K-Means to obtain better result. Clustering performance of proposed algorithm is also evaluated of the basis of accuracy, execution time, quantization error, inter and intra cluster distance.
Keywords-Clustering, K-Mean, PSO, Quantization Error, Inter and Intra Cluster Distance, Execution Time
1. INTRODUCTION
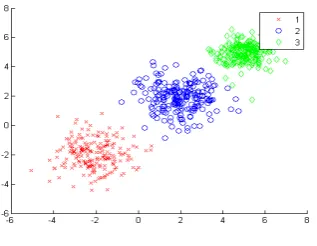
Data Clustering is an unsupervised learning problem. It is a fundamental operation in classification of multi-dimensional data items into specified set of clusters [1]. Data clustering is illustrated in Figure No 1.
Clustering algorithms have been applied to a wide range of problems, including exploratory data analysis, knowledge discovery, vector quantization such as data mining, image segmentation, data mining, pattern recognition, mathematical programming and etc [2].
Fig 1 : Data Clustering
The motivation behind the data clustering is to find inherent structure (similarity) in the data items and grouping then on the basis of their mutual similarity. A good clustering is one that achieves- High within-cluster similarity and Low inter-cluster similarity [3]. In other words Similarity among the same cluster should be high as compared to the data objects among different clusters [4]. Similarity measurement is a very important concern in data clustering. It is inversely related to distance. There are two major classification of clustering techniques: “Flat or Partitioning clustering” and “Hierarchical clustering” [1, 5].
Hierarchical techniques produce a nested sequence of classification and it is possible to view partitions at different levels of granularities. Here partitions can be visualized using tree structure with a single, all- inclusive cluster at the top and single clusters of individual points at the bottom. Hierarchical clustering is illustrated in Figure No 2.
Fig 2 : Hierarchical Clustering
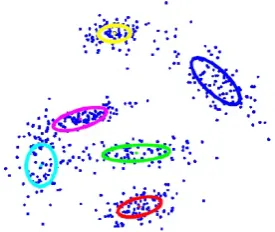
On other hand flat clustering seeks to classify a collection of data item into a set of non-overlapping groups, according to their similarity. Flat clustering is illustrated in Figure No 3.
Fig 3 : Flat or Partitioning Clustering
The best-known partitioning clustering algorithm is K-Means algorithm [9], which is very simple, flexible and straightforward. K-Means clustering algorithm clusters a group of data items into a predefined number of clusters. Clustering process starts with randomly generated initial centroids and keeps reassigning the data objects various clusters based on the similarity between the data object and the cluster centroids until a termination criteria is met (e.g., the fixed number of iterations or stability in movement of data points among clusters) [10]. K-Means is the most efficient algorithm in terms of the execution time but it has a drawback that the cluster results are extremely sensitive to the selection of the initial cluster centroids and may converge to the local optimal solution [11]. Bad initialization leads to bad clustering and poor convergence speed. Therefore, the initial selection of the cluster centroids decides the main processing of K-Means and the clustering result of the dataset as well. Considering these limitation, it has been proposed to use meta-optimization to improve the processing capabilities of existing clustering algorithms. Meta-optimization is an approach which allows using the combination of two or more than two algorithms to achieve a common goal. In current scenario, it will be good to utilize any global optimal searching algorithm for generating the initial cluster centroids for K-Means [12]. The Particle Swarm Optimization (PSO) algorithm is a population based stochastic optimization technique that can be used to find an optimal, or near optimal, solution [13, 14]. The PSO algorithm can be used to generate good initial cluster centroids for the K-Means [15]. In this paper, we present a sequential combination of PSO and K-Means data clustering algorithm that performs fast data clustering and can avoid being trapped in a local optimal solution [16]. The results from our experiments indicate that the sequential hybridization of Particle Swarm Optimization and K-Means algorithm can generate the best compact clustering results in comparison with the K-Means algorithm and the PSO algorithm.
1.1 Particle Swarm Optimization (PSO) Clustering Algorithm
PSO is a stochastic global optimization method which is based on simulation of social behavior like ‘bird flock’ and ‘fish school’ [17]. It was originally developed by Eberhart and Kennedy in 1995 [18]. Here each individual is considered as a particle and the collection of such particles are called swarm. Location of a particle in the
multi-dimensional problem space represents one solution for the problem [19]. A new solution is generated at every move of the particles and its effectiveness can be evaluated by a fitness function that provides a quantitative value for each the solution [20, 5].
= ∑ ∑ − (1)
These values are the measure of global optimal solution of the swarm called gbest value and the best local solution of that particle which is called as pbest value. Final optimal result can be derived by using gbest value and pbest value of all the particles [21]. In addition to that a particle is associated with 2 vectors, position and velocity, and have been recorded in every time stamp.The movement of particle in search space depends on the information it receives from its adjacent particles [22].
PSO consists of 3 major steps: generation of particles and their information, movements and new information vector [23]. It can also be considered as generating particle’s positions and its velocities, velocity update, and position update. At initial stage, the positions, and velocities, of the particles in the swarm are randomly generated using upper andlower bounds [5] on the search variables values, LB and UB, as expressed in equations (2) and (3).
= + ( − ) (2)
= ∆( ) (3) Where
∆ is the time interval.
is current velocity
is current position
is a uniformly distributed random variable
that can take any value between 0 and 1.
This initialization process allows the swarm particles to be randomly distributed across the search space.
The movement of particle in the next time step is the function of its current velocity and current position. There are 3 parts in velocity update of a particle:
1. Current speed of particle i.e. shows its present state
2. Cognition term which shows the thought of the
particle itself
3. Social term that shows the ability of information sharing among the swarms.
Velocity update formula is given in equation (4)
= + ∆ + ∆ (4)
Where
is a uniformly distributed random variable
that can take any value between 0 and 1.
is current velocity
is current position
is thelocation of the particle that
experiences the best fitness
is the location of the particle that
experiences a global best fitness value
and are two positive acceleration constants
responsible for degree of information consideration of personal and swarm memory respectively
represents inertia weight which is usually
linearly decreasing during the iterations.
Position update is the last step in each iteration [20], it is updated using its velocity vector. It can be better understood given by equation (5).
= + ∆ (5) Where
stands for next position
stands for current position
denotes updated velocity
∆ denotes the time interval.
The best fitness values are updated [7] at each generation, based on equation (6),
( + 1) = ( ) ( ( + 1)) ≤ ( ( )) ( + 1) ( + 1) > ( ( )) (6)
Where
denotes the fitness function equation (1)
( )stands for the best fitness values and the coordination where the value was calculated
( ) stands for current position
denotes the generation step.
These three steps: velocity update, position update, and fitness calculations are repeated in PSO until a desired termination criterion is met. PSO algorithm is simple, fast and easy to understand and implement [19]. It requires a little memory for computation. PSO also has a major limitation, when the search space is high its convergence speed becomes slow near global optimum solution [21].
1.2 K-MEANS CLUSTERING ALGORITHM
K-Means is one of the simplest unsupervised learning algorithms that solve the well-known clustering problem because of its fast execution and easy implementation [24].
To classify a given data set into a fixed number of clusters (assume k clusters), it defines k centroids, one for each cluster. These centroids should be placed shrewdly to obtain a global optimal solution. So, the better choice is to place them as much as possible far away from each other. Then associate each data point to any of these clusters having nearest centroid. Then re-calculate k new centroids as bary centers of the clusters and rebind the same data set points to nearest new centroid. Repeat this process either for a fixed number of iterations or until two sub-sequent iteration having same centroids [25].
Finally, the objective function of this algorithm aims at minimizing the total distortion (squared error). Distortion is also known as sum of distances of points from their cluster centroids [5]. Mathematical description for objective function of K-Means is given in the equation (10):
= ∑ ∑ − (7)
Where
− is a the Euclidean distance between
a data point and the cluster centre ,
is the number of data point
is the number of cluster
Algorithmic steps for K-Means data clustering is given below-
Step 1. Point K data items into the space to represent initial group centroids.
Step 2. Assign each data item to a group that has the closest centroid to that data item.
Step 3. Repeat Steps 2 until all data item gets assigned Step 4. Recalculate the positions of K cluster centroids. Step 5. Repeat Steps 2 to 4 until the centroids no longer
move.
K-Means algorithm does not necessarily find the most optimal solution at every run. The algorithm is also significantly sensitive to the randomly selected initial group centroids, so it is more sensitive to local optimal solutions. The K-Means algorithm can be run multiple times to reduce this effect [16].
2. RELATED WORK
Purohit and Ritesh Joshi proposed that the Algorithm first calculates the initial centroids k as per requirements of users and then gives better, effective and good cluster . It generates stable clusters to improve accuracy. It also reduces the mean square error and improves the quality of clustering .The results show that new algorithm improves the execution time of k-means algorithm, with no miss of clustering quality and gives more accuracy for dense dataset rather than sparse [31].
Pritesh Vora and Bhavesh Oza proposed that K-mean clustering is widely used to minimize squared distance between features values of two points reside in the same cluster. Particle swarm optimization is an evolutionary computation technique which finds optimum solution in many applications. Using the PSO optimized clustering results in the components, in order to get a more precise clustering efficiency. In this paper, they present the comparison of K-mean clustering and the Particle swarm optimization [27].
This paper is intended to give the introduction about K-means clustering and its algorithm. The results of K-K-means clustering and its performance in case of execution time are discussed here [33] .
(PSO) is emerging as an alternative to more conventional clustering techniques. PSO is a population-based stochastic search algorithm that mimics the capability of swarm (cognitive and social behavior). Data clustering with PSO algorithms have recently been shown to produce good results in a wide variety of real-world data. In this paper, a brief survey on PSO application in data clustering is described [34].
Mehdi Neshat, Shima Farshchian Yazdi, Daneyal
Yazdani and Mehdi Sargolzaei proposed that they uses Particle Swarm Optimization (PSO) algorithm which is one of the swarm intelligence algorithms, which is applied in determining the optimal cluster centers. In this study, a cooperative algorithm based on PSO and k-means is presented [35].
Sandeep Rana ,Sanjay Jasola and Rajesh Kumar
proposed a new Hybrid Sequential clustering approach, which uses
PSO in sequence with K-Means algorithm for data clustering. This approach overcomes drawbacks of both algorithms, improves clustering and avoids being trapped in a local optimal solution [5].
D. Napoleon and P. Ganga lakshmi, proposed a method which calculates the distance between each data points and select that pair which show the minimum distance and remove it from actual dataset. Then took one data point from data set and calculate the distance between selected initial point and data point from data set and add with initial data point which show the minimum distance. Repeat this process till threshold value achieved. If number of initial data points is less than k then again calculate the distance between each data point from the rest data set and repeat that process till k cluster formed [37].
3. PROPOSED APPROACH
Our proposed hybridization technique includes two clustering algorithms; first one is PSO and second one is K-Means. Although PSO is a good clustering algorithm, it does not perform well when the dataset is large or complex. PSO is efficient in global search but its local search ability is poor. While K-Means is a good option (fast, robust and easier to understand) for local search ability but it didn't work well with global clusters [26]. Even its performance is un-consistent at different initial partitions, it produce different results at different initial partitions. These considerations were main objective behind this research. Our proposed hybridization technique is resolving these limitations by sequentially applying PSO and K-Means to the search space [27]. At the initial stage, the PSO clustering algorithm is executed to search for the location of clusters’ centroid. These locations are used as initial centroid for K-means clustering algorithm for refining and generating the optimal clustering solution. This arrangement is not only resolving the limitations of these algorithms but multiplying the advantages of both algorithms as well [28].
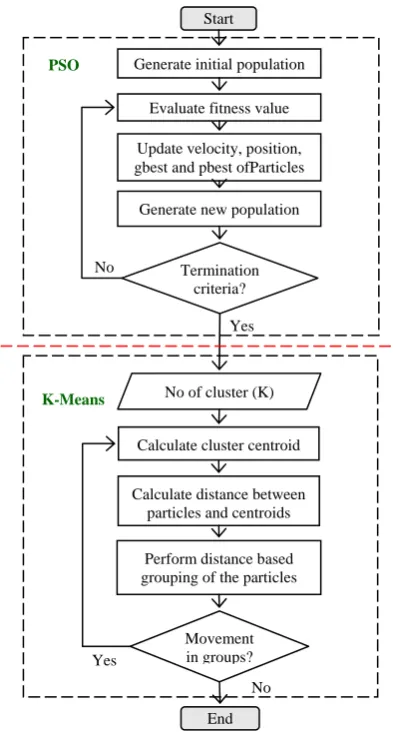
Fig 4: Flowchart of Proposed Approach
Steps of our proposed approach is given below-
Step 1. Randomly generate particles(or pick particles from a given dataset) and form a population by grouping these particles.
Step 2. Initialize the position and velocity of particles using equations (2) and (3).
Step 3. Calculate the fitness value based on equation (6).
Step 4. Update the position, velocity, gbest and pbest of particles using equations (4) and (5).
Step 5. Repeat step 3and 4 until one of following
termination conditions is satisfied.
a. The maximum number of iterations is
exceeded.
b. The average change in centroid vectors is less than a predefined value.
Step 6. Input the number of clusters (K) to be generated. Step 7. Initialize cluster centroids for K-Means using
the K best position particles ofPSO.
Step 8. Assign each particle of the population to the closest centroid cluster of K-Means.
Step 9. Recalculate the cluster centroid of K-Means using equation (7).
Step 10.Repeating step 8 and 9 until the centroids no longer move.
Start
Generate initial population
Termination criteria?
End Evaluate fitness value
Update velocity, position, gbest and pbest ofParticles
Generate new population
No of cluster (K)
Calculate cluster centroid
Calculate distance between particles and centroids
Perform distance based grouping of the particles
Movement in groups?
PSO
K-Means
Yes
Yes No
This unique combination of PSO and K-Means algorithm will generate the better result compared to the result of both individual algorithms [29].This algorithm can be better understood by a flowchart given below.
PSO algorithm is a probabilistic approach to find the optimal solution. 10 runs are suggested for the termination criteria for PSO, it generates a new optimal solution near around global optimal point at every run. 10 runs are enough for further processing with K-Means to obtain better result []7, 30]. PSO algorithm is used at the initial stage to discover the optimal solution by a global search. The result from PSO is proximity of global solution and it will be used as the initial seed to the K-Means data clustering algorithm for refining and generating the final optimal solution [26].
4.
R
ESULTSComparative analysis of proposed method with both individual algorithms (PSO and K-Means) are performed to evaluate the performance of proposed method.
These algorithms were implemented in Matlab Version 7.6.0 (R200a) at intel® core i3-2310@ 2.10 GHz with 4GB of RAM running 32 bit OS (Windows 8). Figure No 5 represents the 2 dimensional solution space of the proposed approach.
Fig 5: 2-D Solution space of proposed approach
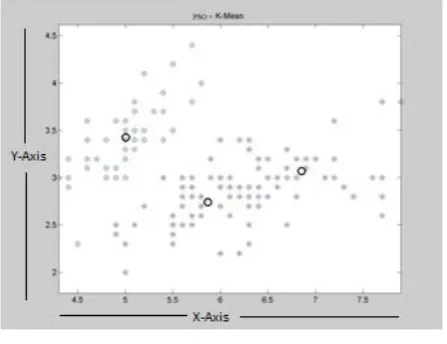
Figure no 6 represents the scatter plot of the solution space of the proposed approach.
Fig 6: Scatter Plot representation of solution space
This is organized as follows: Section A, presents the description of the test data set. Section B, presents various quality measuring parameters and Section C, presents the experimental results.
A. Testing Data Sets
These are Experimental data- 1) Iris Data Set
This is perhaps the best known database to be found in the pattern recognition literature. The data set contains3 classes of 150 instances each, where each class refers to a type of iris plant. There are 4attributes, 3 classes and 150 data vectors. It can be found at url: http://archive.ics.uci.edu/ml/datasets/Iris.
2) Wine Problem
These data are the results of a chemical analysis of wines grown in the same region in Italy but derived from three different cultivars.The analysis determined the quantities of 13 constituents found in each of the three types of wines.There are 13 attributes, 3 classes and 178 data vectors. But we picked only 4 (‘Malic acid’, ‘Ash’, ‘Alcalinity of ash’ and ‘Magnesium’) attributes for our study. It can be found at url: http://archive.ics.uci.edu/ml/datasets/wine.
3) Artificial problem[Random Function ]
This matrix is randomly generated by rand function of Matlab. For our study we generated a matrix of 4attributes and 100 data vectors.
B. Basic Criterias
These are somecriterias to measure the quality of clustering algorithms.
1) Quantization Error
In vector quantization the goal is to minimize the average (squared) quantization error [5], the distance between a sample and its representation.The quantization error is defined in equation (8).
= ∑ ∑ − / ⁄ (8)
Where,
isnumber of cluster
iscentroid of cluster
isnumber of particles in cluster
− is distance between particles and
centroid.
Lower quantization errors represent a good data cluster.
2) Execution Time
Total time spent in data clustering job is coined as Execution Time. Execution time should be less [10].
3) Inter cluster distance
Distance between the centroids of the clusters is known as inter cluster distances [7,5], it can be better understood by given formula which is given in equation (9).
= − (9)
Maximum inter cluster distances represent a good data cluster.
4) Intra cluster distance
Distance between particles and centroid within a cluster is known as intra cluster distances [5], it can be better understood by given formula which is given in equation (10).
=1∑=1 − 2 (10)
Where,
isnumber of cluster
is centroid of cluster
is number of particles
− is distance between particles and
centroid.
Minimum Intra cluster distances represent a good data cluster
5) Accuracy
Clustering is based on the concept to assign two documents to the same cluster if and only if they are similar. The Accuracy measures the percentage of decisions that are correct. It is also known as “Rand Index”. It can be better understood by given formula which is given in equation (11).
=
(11) Where,
is a true positive (TP) decision assigns two similar documents to the same cluster.
is a true negative (TN) decision assigns two dissimilar documents to different clusters.
is a false positive (FP) decision assigns two dissimilar documents to the same cluster.
is a false negative (FN) decision assigns two similar documents to different clusters.
Better accuracy represents a good data cluster.
C. Experimental Results
Here we consider 4 major criteria for performance evaluation: Execution Time, Quantization Error, Intra Cluster Distance and Inter Cluster Distance.
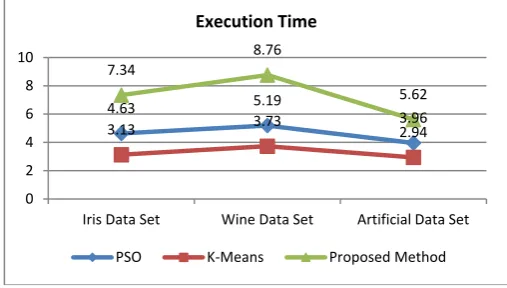
1) Comparison on the basis of Execution Time
Total time spent in data clustering job is called as Execution Time. Table 1 summarizes the comparison of these algorithms on the basis of execution time.
Table 1:Comparison on the basis of Execution Time
Algorithms
Execution Time (in sec.)
Iris Data Set Wine Data Set Artificial Data Set
PSO 4.63 5.19 3.96
K-Means 3.13 3.73 2.94
Proposed Method
[PSO + K-Means] 7.34 8.76 5.62
A algorithm having relativily less execution time is considered as a good algorithm. Figure No 7 is illustrated the execution time of these algorithms is line chart for better visualizing the result.
Fig 7: Line chart for Inter Execution Time Comparison
Proposed Algorithm is relatively slow to individual algorithms because it applies both algorithms in sequential manner.
2) Comparisonon the basis of Quantization Error The quantization error is defined in equation (8). Table 2 summarizes the comparison of these algorithms on the basis of Quantization Error.
Table 2: Comparison on the basis of Quantization Error
Algorithms Quantization Error
Iris Data Set Wine Data Set Artificial Data Set
PSO 0.5782 1.4199 1.8758
K-Means 0.6521 1.5901 2.2266
Proposed Method [PSO + K-Means]
0.4873 1.1167 1.6364
Lower quantization error represents good clustering algorithm. Figure No 8 is illustrated the quantization error of these algorithms is line chart for better visualizing the result.
Fig 8: Line chart for Quantization Error Comparison
4.63 5.19
3.96
3.13 3.73 2.94
7.34
8.76
5.62
0 2 4 6 8 10
Iris Data Set Wine Data Set Artificial Data Set Execution Time
PSO K-Means Proposed Method
0.5782
1.4199
1.8758
0.6521
1.5901
2.2266
0.4873
1.1167
1.6364
0 0.5 1 1.5 2 2.5
Iris Data Set Wine Data Set Artificial Data Set Quantization Error
Proposed approach has low quantization error as compared to both individual algorithms, Which indicated that proposed algorithm is better that both individual algorithms.
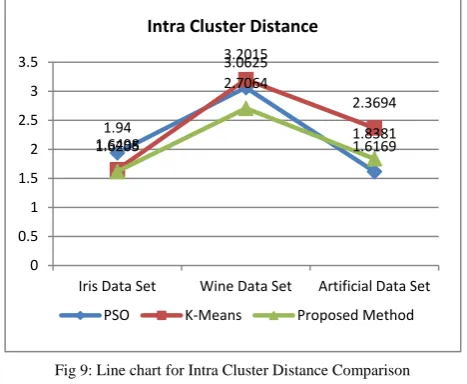
3) Comparisonon the basis of Intra Cluster Distance Distance between particles and centroid within a cluster is known as intra cluster distances. Intra cluster distance is defined in equation (10). Table 3 summarizes the comparison of these algorithms on the basis of Intra Cluster Distance.
Table 3: Comparison on the basis of Intra Cluster Distance
Algorithms Intra Cluster Distance
Iris Data Set Wine Data Set Artificial Data Set
PSO 1.94 3.0625 1.6169
K-Means 1.6498 3.2015 2.3694
Proposed Method
[PSO + K-Means] 1.6205 2.7064 1.8381
A algorithm having less intra cluster distance represents a good clustering algorithm. Figure No 9 is illustrated the intra cluster distance of these algorithms is line chart for better visualizing the result.
Proposed approach has relatively less intra cluster distance which is enough to conclude that proposed approach is better than both individual algorithms.
Fig 9: Line chart for Intra Cluster Distance Comparison
4) Comparisonon the basis of Inter Cluster Distance Distance between the centroids of the clusters is known as inter cluster distances. It can be better understood by equation (9).Table 4 summarizes the comparison of these algorithms on the basis of Inter Cluster Distance.
Table 4: Comparison on the basis of Inter Cluster Distance
Algorithms
Inter Cluster Distance
Iris Data Set Wine Data Set Artificial Data Set
PSO 1.4134 1.2476 1.3937
K-Means 1.6598 1.1863 1.4869 Proposed Method
[PSO + K-Means] 1.7579 1.4346 1.5976
More inter cluster distances represent a good clustering algorithm.Figure No 10 is illustrated the Inter cluster distance of these algorithms in line chart for better visualizing the result.
Fig 10: Line chart for Inter Cluster Distance Comparison
Proposed approach has more inter cluster distanceas compared to both individual algorithms, which is a clear indication that proposed approach is better than both individual algorithms.
5) Comparisonon the basis of Accuracy
Ratio of grouping of data items in most suitable (correct) cluster is known as Accuracy. It can be better understood by equation (11). Table 5 summarizes the comparison of these algorithms on the basis of Accuracy.
Table 5: Comparison on the basis of Accuracy
Algorithms
Accuracy
Iris Data Set Wine Data Set Artificial Data Set
PSO 81.27% 82.12% 78.32%
K-Means 76.18% 72.63% 68.69% Proposed Method
[PSO + K-Means] 88.20% 86.73% 82.31%
Better Accuracy represent a good clustering algorithm. Figure No 11 is illustrated the Accuracy of these algorithms in line chart for better visualizing the result.
Fig 11: Line chart for Accuracy Comparison 1.94
3.0625
1.6169 1.6498
3.2015
2.3694
1.6205
2.7064
1.8381
0 0.5 1 1.5 2 2.5 3 3.5
Iris Data Set Wine Data Set Artificial Data Set Intra Cluster Distance
PSO K-Means Proposed Method
1.4134
1.2476 1.3937
1.6598
1.1863
1.4869 1.7579
1.4346 1.5976
0 0.5 1 1.5 2
Iris Data Set Wine Data Set Artificial Data Set Inter Cluster Distance
PSO K-Means Proposed Method
81.27%
76.18%
88.20% 82.12%
72.63%
86.73% 78.32%
68.69%
82.31%
0.00% 10.00% 20.00% 30.00% 40.00% 50.00% 60.00% 70.00% 80.00% 90.00% 100.00%
PSO K-Means Proposed Method
Accuracy
Proposed approach has more accuracy as compared to both individual algorithms, which is a clear indication that proposed approach is much suitable than both individual algorithms.
5. CONCLUSION AND FUTURE SCOPE
In this research paper a sequential hybridization of two popular data clustering approach (PSO and K-Means) has been proposed. Implementation of the proposed approach with both individual algorithms has been done using on Matlab Version 7.6.0 (R200a)and their performance are evaluated on intel® core i3-2310@ 2.10 GHz with 4GB of RAM running 32 bit OS (Windows 8). Comparative analysis shows that proposed approach have better convergence to lower quantization errors, larger inter-cluster distances, smaller intra-inter-cluster distances and approx. same execution time. Accuracy measurement signifies the real impact of the proposed algorithm; proposed approach is 6% more accurate than PSO and 15.5% more accurate than K-Means Algorithm. Comparison result concludes that the drawback of finding optimal solution by K-Means can be minimized by using PSO over it. The variations in PSO algorithm and its sequential hybridization with K-Means algorithm if done more efficiently then execution time can be reduced is proposed for future research.
ACKNOWLEDGMENT
Author of this paper is very thankful to Asst. Prof. Harpreet Kaur for her moral support and encouraging ideas. Author would also like to thank Ravindra Kumar Singh for giving his valuable time and help. At last but not the least to their friends, teachers, guides and other people for providing their support and helpful comments.
REFERENCES
[1] Jain A. R., Murthy M. N. and Flynn P. J.. “Data clustering: A Review”. ACM Computing Surveys, Vol. 31, No 3, pp. 265-323. , 1999.
[2] Jiawei Han and MichelineKamber, “Data Mining: Concepts and Techniques”, Morgan Kaufmann Publishers, second Edition, 2006.
[3] Kumar A., Sabharwal Y. and Sen S., “Linear time approximation schme for clustering problems in any dimensions”. Journal of ACM, Vol.57, No 2 .pp 5:1-32. 2010.
[4] Berkhin, P., “Survey of clustering data mining techniques”. Accrue Software Research Paper. 2002.
[5] Rana S., Jasola Kumar R., “A hybrid sequential approach for data clustering using K-Means and particle swarm optimization algorithm”, International Journal of Engineering, Science and Technology, Vol. 2, No. 6, pp. 167-176, 2010
[6] Pyle D., “Data preparation for data mining”. Morgan Kaufmann Publishers, Inc. 1999.
[7] DW van der Merwe, AP Engelbrecht, “Data Clustering using Particle Swarm Optimization”. IEEE, the 2003 Congress on Evolutionary Computation, 2003.
[8] Mitra S. and Acharya T., “Data Mining”. Wiley Publications. 2004.
[9] Kanungo T., Mount D.M., Netanyahu N., Piatko C., Silverman R. and Wu A.Y., “A local search approximation algorithm for K-Means clustering”. Computational Geometry: Theory and Applications, SoCG’02, pp. 89-112. 2002.
[10] Kanungo T., Mount D.M., Netanyahu N., Piatko C., Silverman R. and Wu A.Y., “An efficient K-Means clustering algorithm: Analysis and implementation”. IEEE Trans. Patterns Analysis and Machine Intelligence, Vol. 24, No 7, pp. 881-892. 2002.
[11] AhamedShafeeq B M, Hareesha K S, “Dynamic Clustering of Data with Modified K-Means Algorithm”, International Conference on Information and Computer , IACSIT Press, Singapore, 2012.
[12] Khan, S.S., Ahmad, A., “Cluster center initialization algorithm for kmeans clustering”, Pattern Recognition Letter. 25, 2004, pp. 1293–1302.
[13] J Kennedy, RC Eberhart, Y Shi, “Swarm Intelligence”, Morgan Kaufmann Publishers, Inc. 2002.
[14] Youcheng Lin, Nan Tong, Majie Shi, Kedi Fan, Di Yuan, Lincong Qu, Qiang Fu, “K-means Optimization Clustering Algorithm Based on Particle Swarm Optimization and Multiclass Merging”, Advances in Intelligent and Soft Computing, Springer Berlin Heidelberg, pp 569-578, 2012. [15] Asha GowdaKaregowda , SeemaKumari, “Particle Swarm
Optimization Algorithm Based k-means and Fuzzy c-means clustering”, International Journal of Advanced Research in Computer Science and Software Engineering, Volume 3, Issue 7, July 2013.
[16] Tsai C. Y. and Chiu C. C., “Developing a feature weight self-adjustment mechanism for a K-Means clustering algorithm”. Computational Statistics and Data Analysis, Vol. 52, pp. 4658-4672. 2008.
[17] Chen C. Y. and Fun Y., Particle swarm optimization algorithm and its application to clustering analysis. IEEE International Conference on networking sensing and Control, pp.789-79. 2004.
[18] Kennedy J. and Eberhart R. C., Particle swarm optimization. IEEE International Conference on Neural Networks, Perth Australia, Vol. 4, pp. 1942-1948. 1995.
[19] Cui X., Potok, T. E. and Palathingal. P., Document clustering using particle swarm optimization. International Journal of Pattern Recognition and Artifcial Intelligence, Vol. 19, No 3, pp. 185-191. 2005.
[20] El-abd M. and Kamel M., Information exchange in multiple cooperating swarms. IEEE swarm Intelligence Symposium, pp. 138-142. 2005.
[21] T Kohonen, “Self-Organizing Maps”, Springer Series in Information Sciences, Vol 30, Springer-Verlag, 1995. [22] Shi Y. and Eberhart R. C., Parameter selection in particle
swarm optimization. Evolutionary Programming, Vol. 1441 of Lecture Notes in Computers Science, Springer. pp. 591-600. 1998.
[23] Xindong W., “Data mining: Artifcial intelligence in data analysis”. IEEE/WIC/ACM International Conference on Web Intelligence. 2004.
[24] MacQueen, J. B., "Some Methods for classification and Analysis of Multivariate Observations", Proceedings of 5th Berkeley Symposium on Mathematical Statistics and Probability. University of California Press. pp. 281–297, 1967.
[25] Zalik K. R., “An effcientk'means clustering algorithm”, Pattern Recognition Letters, Vol. 29, pp. 1385-1391. 2008. [26] Hai Shen ; Li Jin ; Yunlong Zhu ; Zhu Zhu, “Hybridization
on Bio-Inspired Computing: Theories and Applications (BIC-TA), 2010.
[27] PriteshVora, BhaveshOza, “A Survey on K-mean Clustering and Particle Swarm Optimization”, International Journal of Science and Modern Engineering (IJISME), Volume-1, Issue-3, 2013.
[28] Yucheng Kao; Szu-Yuan Lee, “Combining K-means and particle swarm optimization for dynamic data clustering problems”, IEEE International Conference on Intelligent Computing and Intelligent Systems, 2009.
[29] NadjetKamel, ImaneOuchen, Karim Baali, “A Sampling-PSO-K-means Algorithm for Document Clustering”, Advances in Intelligent Systems and Computing, Springer International Publishing Switzerland, pp 45-54, 2014. [30] J. Avanija, K. Ramar, “A hybrid approach using pso and
K-means for semantic clustering of web documents”, Journal of Web Engineering archive, Volume 12 Issue 3-4, pp 249-264, July 2013.
[31] Pallavi Purohit and Ritesh Joshi, “A New Efficient Approach towards k-means Clustering Algorithm” International Journal of Computer Applications, March 2013.
[32] Manpreet Kaur and Usvir Kaur, “A Survey on Clustering Principles with K-means Clustering Algorithm Using Different Methods in Detail” IJCSMC, 2013.
[33] Sunita Sarkar,Arindam Roy, Bipul Shyam Purkayastha, “Application of Particle Swarm Optimization in Data Clustering” International Journal of Computer Applications , 2013.
[34] Mehdi Neshat, Shima Farshchian Yazdi, Daneyal Yazdani and Mehdi Sargolzaei, “A New Cooperative Algorithm Based on PSO and K-Means for Data Clustering” Journal of Computer Science 8 (2): 188-194, 2012.
[35] D. Napoleon and P. Ganga lakshmi, “An Efficient K-Means Clustering Algorithm for Reducing Time Complexity using Uniform Distribution Data Points”, IEEE 2010.
Gursharan Saini obtained her B.Tech degree in computer Science and Engineering from PTU University, doing M.Tech in Computer Science and Engineering from Sant Baba Bhag Singh Institute of Engineering & Technology, Padhiana. A Lifetime member of Indian Society for Technical Education