Study of the process
e
+e
−→
π
+π
−π
0η
at the SND detector
A.A.Botov1,?
1Budker Institute of Nuclear Physics, Novosibirsk, 630090, Russia
Abstract. The reactione+e− → π+π−π0ηhas been studied in the experiment with the SND detector at the VEPP-2000e+e−
collider. The reaction proceeds via the four inter-mediate states:ωη,φη,a0ρ, and structurelessπ+π−π0ηstate, which may be, for example, ρ(1450) withρ(1450)→ ρ(770)η. The totale+e− → π+π−π0ηcross section and cross section for the four intermediate states have been measured and fitted in the vector meson dominance model.
1 Introduction
The main goal of experiments with the SND detector at the VEPP-2000e+e− collider is precision measurement of the total cross section of e+e− annihilation to the hadrons in the center-of-mass (c.m.) energy region below 2 GeV. The total cross section is necessary for calculation of the run-ning electromagnetic coupling constant and the muon anomalous magnetic moment. Below 2 GeV the total hadronic cross section is calculated as a sum of exclusive cross sections for all possible hadronic modes. The processe+e−→π+π−π0ηgives a sizeable contribution to the total cross section above 1.6 GeV. It was established [1] that thee+e− → π+π−π0ηreaction proceeds throughωη,φη,
ρa0(980) intermediate states and a structurelessπ+π−π0ηmechanism. The latter may be, for example,
rho(1450)πwithρ(1450)→ ρ(770)ηdecay. The cross sections fore+e− → ωηandφηwere previ-ously measured in several final states [2–4]. The only measurement of thee+e− →π+π−π0ηreaction was performed very recently in the CMD-3 experiment [5] also at VEPP-2000.
This work is dedicated to the measurement of thee+e− → π+π−π0η cross section at the SND detector. We analyze theπ+π−π0ηfinal state with theηmeson decayed toγγ.
SND [6] is a general purpose nonmagnetic detector. The main part of SND is a spherical three-layer electromagnetic calorimeter containing 1640 NaI(Tl) crystals and covering a solid angle of 95% of 4π. Directions of charged particles are measured by a tracking system based on a nine-layer cylin-drical drift chamber and a proportional chamber with cathode-strip readout in a common gas volume. The tracking system covers a solid angle of 94% of 4π. The particle identification is provided by dE/dxmeasurements in the tracking system and a system of aerogel Cherenkov counters. Outside the calorimeter a muon detector is located.
SND collected data at the VEPP2000 [7]e+e−collider operating in the c.m. energy region 0.3– 2.0 GeV. A 69 pb−1 data sample was collected during 2010–2013. At the end of 2016 year, after finishing of upgrade, VEPP2000 resumed operation. About 50 pb−1of integrated luminosity has been accumulated during 2017 data taking run.
2 Data and simulation
This analysis is based on data with an integrated luminosity of 27 pb−1recorded with the SND detector in 2011–2012 in 36 energy points of the range 1.34–2 GeV, above the threshold of the process under study. Experimental energy points are merged into 13 energy intervals with 50 MeV width.
Simulation of the signal and background processes is done with Monte Carlo (MC) event gen-erators. The generators take into account radiative corrections to the initial particles calculated ac-cording to Ref. [8]. The cross-section energy dependences needed for radiative-correction calcula-tion are taken from existing data, e.g., from Ref. [2] for the processe+e− → ωη. For the processes e+e−→a0ρand structureless mechanism of thee+e−→π+π−π0ηreaction, we use cross sections from our measurements through iterations. For simulation of the structureless mechanism the hypothesis e+e−→ρ(1450)πwithρ(1450)→ρ(770)ηis used.
Interactions of generated particles with the detector material are simulated using GEANT4 soft-ware [9]. The simulation takes into account variation of experimental conditions during data taking, in particular dead detector channels and beam-induced background.
The luminosity is measured using the process of Bhabha scatteringe+e− → e+e−. The detec-tion efficiency and cross section for Bhabha events are determined using the event generator BH-WIDE [10]. The systematic uncertainty of the luminosity measurement does not exceed 2%.
3 Event selection
The following preselection is used. There are two or three charged particles originated from the interaction region and at least four photons with energy greater than 20 MeV in an event. The total energy deposition in the calorimeter for these events is required to be greater than 300 MeV.
For preliminary selected events the vertex fit characterized by the parameterχ2
ris performed using
the parameters of two charged tracks. If there are three charged tracks in an event, the two tracks with the lowestχ2
r value are selected. The found vertex is used to refine the measured angles of charged
particles and photons. Then, a kinematic fit to thee+e−→π+π−π0γγhypothesis characterized by the parameterχ2
3π2γis performed with the requirement of energy and momentum balance and the invariant mass of theπ0candidate constrained to its world average value [11]. The fit uses the measured polar and azimuthal angles of charged particles, and the measured angles and energies of photons. The invariant mass of the photon pair, which are assumed to be theη-meson candidate, must be in the range 400<Mγγ <700 MeV. All possible combinations of photons are tested and the combination with the smallestχ23π2γis chosen. The photon parameters after the kinematic fit are used to recalculate theη-candidate invariant mass (Mη). The event is then refitted with theη-mass constraint. The refined η-candidate energy is used to calculate the invariant mass of the system recoiling against theηmeson (Mrecη ).
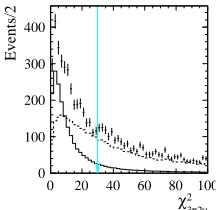
Events of the process under study are selected by the conditions χ2
3π2γ < 30. To suppress background from the process e+e− → π+π−π0π0 we perform a kinematic fit to the hypothesis
e+e− → π+π−π0π0(γ) (radiation of an additional photon along the beam axis is allowed) and reject events withχ2
4π(γ) <200.
γ 2 π 3 2 χ
0 20 40 60 80 100
Events/2
0 100 200 300 400
Figure 1. The χ2
3π2γ distribution for selected data events (points with error bars). The solid and dashed histograms represent the shapes of signal and back-grounde+e− →π+π−π0π0distributions obtained us-ing MC simulation, respectively. The arrow indicates the boundary of the conditionχ2
3π2γ<30.
(GeV)
η
M
0.4 0.5 0.6 0.7
Events/0.006
0 200 400
Figure 2. The spectrum of the two-photon invari-ant mass of theη-meson candidate for selected data events (points with error bars). The solid histogram is the result of the fit to the data spectrum with a sum of signal and background distributions. The background distribution is shown by the dashed his-togram. The dotted histogram represents thee+e−→
π+π−π0π0background contribution.
4 Determination of the number of signal events
The Mη spectrum for selected data events is shown in Fig. 2. To extract the number of signal
e+e− → π+π−π0η events the spectrum is fitted with a sum of signal and background distributions. The background distribution is a sum of the simulated distribution fore+e−→π+π−π0π0and a linear function. The signal distribution is described by a sum of three Gaussian distributions with parameters determined from the fit to the simulatedMηdistribution fore+e−→π+π−π0ηevents.
The distributions of the signal events for invariant massMrec
η for different c.m. energy intervals are shown in Fig. 3. Theω- andφ-meson peaks are clearly seen. We define contributions of the inter-mediate states through approximation of these spectra with a sum of simulated distributions for them. To cleara0ρcontribution for energies greater than 1.694 GeV we use simultaneous approximation of the three distributions forMηrec, Mπ0η andMπ±η also shown in Fig. 3. Thea0 peaks are seen in the
latter two distributions.
Forωηandφηchannels we use three Gaussian distributions with parameters determined from the fit to the simulated distributions. For thea0ρand structurelesse+e− → π+π−π0ηdecay channels simulated histograms are used.
5 The Born cross section
The experimental values of the each visible cross section are calculated as follows,
σvis,i=
Ni
LiεiB
, (1)
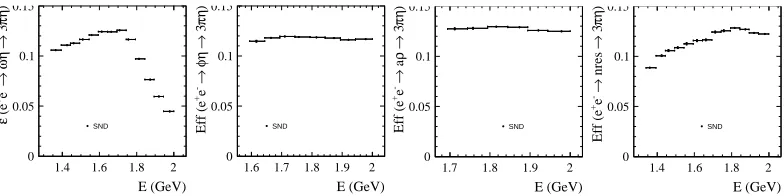
whereNi, Li, and εi are the number of selected data events, integrated luminosity, and detection
efficiency for thei-th energy interval shown in Fig. 4, andBis the branching fraction of decay to the π+π−π0ηfinal state which for theωηandφηchannels are taken from Particle Data Group (PDG) [11] and for the rest two are equal to unit. For the total cross section we calculatedNi/εias the following,
N ε =
Nωη
εωη +
Nφη
εφη +
Na0ρ
εa0ρ
+Nnres
εnres
, GeV rec
η
M
0.7 0.8 0.9 1
Events/0.025
0 20 40
E = 1.544-1.594 GeV
, GeV rec
η
M
0.7 0.8 0.9 1 1.1
Events/0.025
0 50 100
E = 1.594-1.644 GeV
, GeV rec
η
M
0.7 0.8 0.9 1 1.1
Events/0.025 0 50 100 150 200
E = 1.644-1.694 GeV
, GeV rec
η
M
0.8 1 1.2
Events/0.025
0 50
E = 1.744-1.794 GeV
, GeV
0
a M
0.8 1 1.2 1.4
0 20 40 60
E = 1.744-1.794 GeV
, GeV
±
a M
0.8 1 1.2 1.4
0 20 40 60
E = 1.744-1.794 GeV
Figure 3. TheMrec
η distribution for datae+e− → π+π−π0ηevents from different c.m. energy intervals (points with error bars). The solid histogram represents the result of the fit described in the text. The dotted histogram represents the structurelesse+e− → π+π−π0ηcontribution. The dashed histogram represents thee+e− →
a0ρ contribution.
E (GeV)
1.4 1.6 1.8 2
) ηπ 3 → η ω → -e + (e ε 0 0.05 0.1 0.15 SND E (GeV)
1.6 1.7 1.8 1.9 2
) ηπ 3 → ηφ → -e + Eff (e 0 0.05 0.1 0.15 SND E (GeV)
1.7 1.8 1.9 2
) ηπ 3 → ρ a → -e + Eff (e 0 0.05 0.1 0.15 SND E (GeV)
1.4 1.6 1.8 2
) ηπ 3 → nres → -e + Eff (e 0 0.05 0.1 0.15 SND
Figure 4.The detection efficiencies for the four studied channels.
The visible cross section is related to the Born cross section (σ) by the following expression [8]:
σvis(E)=
Z xmax
0
F(x,E)σ(E √
1−x)dx, (3)
where the functionF(x,E) describes the probability of radiation of photons with total energyxE/2 by the initial electron and positron, andxmax=1−(2mπ++mπ0+mη)2/E2. The right side of Eq. (3)
can be rewritten in the more conventional form,
Z xmax
0
F(x,E)σ(E √
1−x)dx=σ(E)(1+δ(E)), (4)
Experimental values of the Born cross section are determined as follows. The energy dependence of the measured visible cross section is fitted with Eq. (3), in which the Born cross section is given by a theoretical model describing data well. The model parameters obtained in the fit are used to calculate δ(Ei), where Eiis the weighted average c.m. energy forith energy interval, defined in Sec. 2. The
values of the Born cross section are then obtained asσi=σvis,i/(1+δ(Ei)).
For theωηand structurelessπ+π−π0ηchannels the Born cross section is described by a sum of two resonance contributions,
σ(E)= 12π E3
s
Bω0 Pf(mω0)
m3ω/02Γω0 Dω0
−
s
Bω00 Pf(mω00)
m3ω/002Γω00 Dω00
2
Pf(E), (5)
whereBV = B(V → e+e−)B(V → f) is the product of the branching fractions for theV decay to
e+e− and f, where f = ωηand f = π+π−π0η forωη and structureless channels correspondingly, DV =E2−m2V +iEΓV,mV andΓV are the mass and width of the resonanceV(V =ω0orω00). The
phase space factorPf(E) is given by
Pf(E)=q(E)3,q(E)=q(E,mω,mη)=
1 2E
q
(E2−(m
ω−mη)2)(E2−(mω+mη)2) (6)
for theωη and unit for structureless channel correspondingly. The first term in Eq. (5) describes theω(1420) contribution. The second term is a sum of contributions of the ω(1650) andφ(1680) resonances. The phase between the first and second terms is chosen to be equal toπ(see the discussion below).
For theφηanda0ρchannels we use one resonanceV, which isφ0for the first one. For the first one the phase space factorPf(E) is given by
Pf(E)=q(E)3,q(E)=
1 2E
q
(E2−(m
φ−mη)2)(E2−(m
φ+mη)2) (7)
and for the second one is given by
Pf(E)=
1 3qf ·
2 3 =
2 9
Z (E−ma0) 2
4m2 π
dm2
π
mΓρ(m)q(E,m,ma0)
(m2−m2
ρ)2+m2Γ2ρ(m)
,
Γρ(m)= Γρ
m2 ρ
m2
p2 π(m2)
p2 π(m2ρ)
3/2
, p2π(m2)=m2/4−m2π, (8)
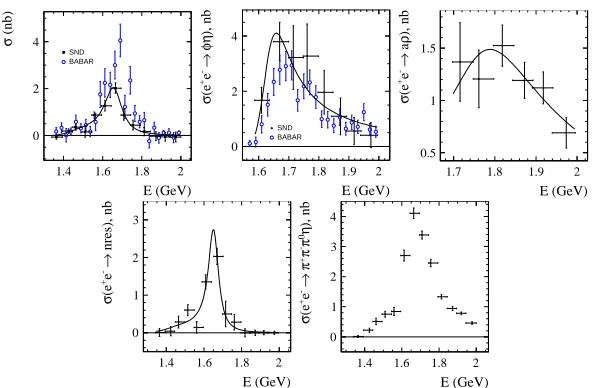
For the total cross section we used two resonances with a free phase between them.
The free fit parameters areBω0,Bω00,Bφ0,mω00,Γω00. The mass and width of theω(1420) resonance
are fixed at their PDG values [11]. The fit performed with zero phase between theω0andω00 am-plitudes provides a significantly worse (χ2 = 41.6) description of the cross-section data. The fitted curves together with obtained values of the Born cross sections are shown in Fig. 5.
The contribution of theω(1420) is small compared with that of theω00. However, this contribution is necessary to describe the asymmetry of the peak in the measured cross section. The asymmetry is explained by constructive interference of theω0andω00 amplitudes on the left side of the peak and destructive interference on the right side.
6 Conclusions
E (GeV)
1.4 1.6 1.8 2
(nb)
σ
0 2 4
SND BABAR
E (GeV)
1.6 1.7 1.8 1.9 2
), nb
ηφ
→
-e
+
(e
σ
0 2 4
SND BABAR
E (GeV)
1.7 1.8 1.9 2
), nb
ρ
a
→
-e
+
(e
σ
0.5 1 1.5
E (GeV)
1.4 1.6 1.8 2
nres), nb
→
-e
+
(e
σ
0 1 2 3
E (GeV)
1.4 1.6 1.8 2
), nb
η
0
π
-π
+
π
→
-e
+
(e
σ
0 1 2 3 4
Figure 5.The cross sections measured in this work (filled circles) and in theBABARexperiment (open circles). The curve is the result of the fit described in the text. The errors of the SND data are statistical and systematic, combined in quadrature.
intermediate states in the c.m. energy range 1.34–2.00 GeV. The measured cross sections are well described in the vector meson dominance model.
References
[1] V. P. Druzhinin et al. (SND Collaboration), EPJ Web Conf. 130, 05004 (2016) [arXiv:1609.01040 [hep-ex]]
[2] M. N. Achasovet al.(SNDCollaboration), Phys. Rev. D94, 092002 (2016) [3] B. Aubertet al.(BABARCollaboration), Phys. Rev. D76, 092005 (2007) [4] B. Aubertet al.(BABARCollaboration), Phys. Rev. D77, 092002 (2008) [5] R. R. Akhmetshinet al.(CMD-3Collaboration), Phys. Lett. B773, 150 (2017)
[6] M. N. Achasov et al., Nucl. Instrum. Methods Phys. Res., Sect. A 598, 31 (2009); V. M. Aulchenkoet al.,ibid.598, 102 (2009); A. Yu. Barnyakovet al.,ibid.598, 163 (2009); V. M. Aulchenkoet al.,ibid.598, 340 (2009)
[7] A. Romanovet al., inProceedings of Particle Accelerator Conference PAC 2013, Pasadena, CA USA, p. 14, (2013)
[8] E. A. Kuraev and V. S. Fadin, Yad. Fiz.41, 733 (1985) [Sov. J. Nucl. Phys.41, 466 (1985)] [9] S. Agostinelliet al., Nucl. Instrum. Methods Phys. Res., Sect. A506, 250 (2003)