Checking Language Dependent Accuracy of
Web Applications using Data Mining Techniques
Maninderjit Kaur#1, Dr. Sushil Kumar Garg*2 #
Research Scholar (Department of Computer Science and Engineering), RIMT-Institute of Engineering & Technology, Mandi Gobindgarh, Fatehgarh Sahib, Punjab, India
*
Principal RIMT-Maharaja Aggrasen Engineering College, Mandi Gobindgarh, Fatehgarh Sahib, Punjab, India
Abstract— Over the last decade web applications are becoming
very popular. These are becoming more users oriented now days. Various languages used for the development of a web application like PHP, Java, ASP.NET etc. Development of a web application is not done by individual; it is a result of team’s efforts. Different type of bugs and errors are present in source code. Finding out these bugs or errors is a difficult task. Deep understanding of the language is required to detect bugs or errors in source code. Different tools are used to check the accuracy of the source code. There is a need to classify these detected bugs so that fewer efforts are done for selecting the individual to correct these. To detect and classify these manually is a time consuming task. This paper has presented the combination of Software Engineering with Data Mining Techniques. Aim of this work is to detect and classify the bugs or errors present in source code of web applications developed using PHP language. The input to system is PHP source code file. Bugs and errors are detected after that clustering and classification is performed for knowledge discovery. Experimental results show that given work is more effective than the previous method on the basis of accuracy, recall, precision and F-Measure.
Keywords— Software Engineering, Data Mining, PHP, Web Application, Bug, Error, Modified K-Means, CART
I. INTRODUCTION
Growth of advancements in technology is very high. Many other languages are used for developing the web applications like C++, C#, PHP, ASP.NET, Java etc. PHP- Hypertext Pre-processor (earlier, it was Personal Home Page) is a well known and mostly used scripting language in today’s web industry. A quality web-based application leaves a good impression on the visitors. These are cost-saving, enhanced productivity, having improved features and functionality.PHP is a popular language used for web development.
Development of a web application is not done by individual; it is a result of team’s efforts. Development team focuses on different issues of application like user management, their goals. As the number of users’ increases respectively there is need of checking the accuracy of code. Because everyone wants that their code should be error free. Due to the errors in the code web applications are exposed to constant hacking attempts, security related problems and many other problems.
An incorrect process, data definition or step in a computer program is known as Bug (Fault or Defect). An error is difference between the desired and actual performance and behaviour of an object or system. Inability of a system to perform its required functions within
specified performance requirements is known as failure as in [7], [18]. Errors or bugs prevent the program to compile and run correctly as per the expectation of the programmer. The source code contains several types of bugs and errors like syntax, semantic, logical. Bug detection in the source code of an application is a challenging task.
Software Engineering Researchers are not expert to develop a tool or algorithm for data mining. Data Mining Researchers do not understand the mining requirements in software engineering domain. So, a close collaboration between both domains is required. Software engineering tasks like Programming, Bug Detection, Debugging, Testing, and Maintenance improved by this approach. Software engineering data is available in various forms like documentation, bug databases, source code, mailing history, bug reports, traces of execution and graphs as in [1].
Clustering is a machine learning technique. In this, set of data objects are grouped into multiple groups or clusters. Data objects’ group having some common features are called clusters. Clustering is an unsupervised learning technique [9]. Input to clustering process is the real data i.e. dirty. The output of the clustering process is in the form of number of groups/clusters forming a partition. Pre-processing is done on input data to prepare it for clustering. Data cleaning is used to remove inconsistent data and noise. Multiple data sources may be combined in data integration. In data transformation, data are transformed into forms appropriate for mining. In Data reduction, the volume of the representation is reduced but result remains same. Fig. 1 shows clustering process:
.
Fig. 1 Clustering Process [12]
Goal of clustering is described as follows in mathematical form:
[12]
Pre-Processing
Data cleaning
Data integration
Data reduction
Data transformation
Data Real (dirty)
Clustering Algorithms Data Matrix
Input
Output
Where X denotes original data set, n is the no. of clusters and , are clusters of X as in [12].
Classification is a supervised learning technique in data mining where training data is given to classifier that builds classification rules. Test dataset is given to classifier, and then for unknown classes it will predict values as in [14]. Goal of data classification is to organize and categorize data in distinct classes. Classification problem can be defined as follows for a database with a number of records and for a set of classes such that each record belongs to one of the given classes , the problem of classification is to decide the class to which given record belongs. Classification is an important data mining technique .It is used to predict group/class membership for data instances [20]. Fig. 2 shows the classification task.
Fig. 2 Classification Task [8]
Different models have been proposed for classification such as Decision tree, Neural networks, Bayesian belief networks, Fuzzy set and Genetic models. The decision trees classifier is most widely used in among of these models for classification. They are popular because they are easy to understand. Many algorithms such as ID3, C4.5 and CART (Classification and Regression Tree) have been devised for decision tree construction as in [11].
II. OVERVIEW OF ALGORITHMS
In this work, Modified K-Means Algorithm is used for clustering and CART (Classification and Regression Tree) decision tree algorithm is used for classification. A brief introduction of these algorithms is given as following:
A. Modified K-Means Clustering Algorithm
K-Means algorithm is one of the most popular algorithms for the clustering process. It is very simple, easy to understand and implement. It classifies the given data set of ‘n’ objects into ‘k’ clusters. The number of clusters ‘k’ is predefined as in [10]. It is having many advantages. It is very simple, fast and flexible. Instead of having many advantages, it has many disadvantages. Pre-defined value of ‘k’, high sensitivity to noise data objects, iterative calculation of cluster centres [4]. To overcome the disadvantages many other algorithms are developed. Modifications are done to improve the efficiency of basic K-Means algorithm. No repetition in the allocation of memory for the clusters is required. The resulting time
taken for the clusters formation is low. In [15], there is no repeated iterations and mean value updating.
Input: D- Data items
F- Set of data item feature
Output: Clusters ‘I’ Steps:
While (i)
Foreach item i€D, and i≠ last Do
For data item feature Fx in {F} Cluster[i]= Modified_k_means (Fx(i)) Add next iteration value to the array
While Fx≠last
EndForeach
I= Items inset {Cluster[i]} Add ith data item to the cluster I End While
B. CART Algorithm
CART algorithm was introduced by Leo Brieman et al. in 1984. CART is a binary recursive partitioning procedure. CART is based on greedy approach in which decision trees are constructed in divide and conquer, top-down, recursive. It is serially implemented. It is processing both continuous and nominal attributes both as targets and predictors. The trees are reached to their maximum size. After that cost-complexity pruning is done. The “right sized” and “honest” tree is identified. It removes unreliable branches from decision tree to improve accuracy. It also includes missing value handling, automatic class balancing, and allows cost-sensitive learning as in [21]. In CART decision trees are formed by a collection of rules based on variables in data set. The algorithm is as follows [5]:
i) Variable values are used to select rules to get the
best split to differentiate observations based on the dependent variables.
ii) Once a rule is selected it split a node into two.
Same process is applied to each “child” node for splitting it into two parts (i.e. it is a recursive procedure).
iii) Splitting stops when CART detects no further gain
can be made or some pre-set splitting rules are met (data is split as much as possible and then the tree is later pruned).
In [11], Classification tree is based on binary splitting of the attributes. Gini Index is used to select splitting attributes. Gini Index is defined as:
[11] Splitting rules of CART are always expressed in the
form as following:
If CONDITION true instance goes left, and goes right otherwise
For continuous attributes CONDITION is expressed as “attribute Xi <=C” and for nominal attributes as membership in an explicit list of values. CART authors explain the preference of binary splits as (i) they fragment the data more slowly than multi-way splits, and (ii) repeated
Learning Algorithm
Learn Model
Apply Model
Model
Training Set
Test Set
splits on the same attribute are allowed as in [13]. It is a predication and data exploration algorithm. This classification method uses historical data to construct the decision tress. Then decision trees are used to classify the new data. There must be known number of classes in advance to use CART as in [3]. In [6], Classification tree have classes and regression trees don’t have classes.
III.RELATED WORK
V. Neelima et al. [19] uses Text Mining Techniques for bug detection. In order to eliminate the overhead in debugging, they proposed an approach to detect bugs in C programs via matching and mining techniques. The input to the system is the text file containing syntax errors. After that file is matched with database that acts as a repository to detect bugs, classify them and generate the analysis report that gives solution. In future other types of errors can be considered and can be used for other programming languages.
Naresh Kumar Nagwani, Shrish Verma [16] presents a software bug classification algorithm CLUBAS (Classification of Software Bug using Bug Attribute Similarity), is a hybrid algorithm. CLUBAS is an example of classification using clustering technique. In first step text clusters are created and followed by generation of clusters labels using frequent and meaningful terms present in the bug attributes in second step. In third step the cluster labels are mapped against the bug taxonomic terms to identify the appropriate categories of the bug clusters.
P. V. Ingle et al. [17], the proposed system analyze the software defects; using clustering approach categorized them, after that, defects are measured in each cluster separately. Data mining Clustering technique is used to improve quality of software development. The paper had reviewed the software defect management based on different types of defects by using clustering algorithms. Nature of defects is determined on the basis of resulting data.
Alexander Breckel [2] presents a new approach to automatically detect bugs through comparison with a large code database that is containing code fragments. The source file is analyzed for similar but slightly different code fragments in the database. The occurrences of common differences indicate a potential bug that can be fixed by applying the modification back to the original source file. Results showed that up to 50% of short typing errors can be fixed and even the correction of real world bugs is possible in some cases.
IV.PROBLEM STATEMENT AND OBJECTIVES
Existing work had been implemented for the C language source code to detect bugs or errors. Previous work classifies different types of syntax errors. In case of large line of codes the approach needs great accuracy towards detection of bugs. Accuracy of the previous work is low. Challenge is to design a system that is having high accuracy. An approach is presented for the detection and classification of bugs or errors. Different parameters are used to evaluate the results of the given work like recall, precision and F-Measure.
First objective of the given work is to detect errors or bugs in PHP code file. Second objective is to cluster detected bugs or errors using Modified k-means algorithm. Next objective is to classify clustered data using CART algorithm. Last objective is to analyse and compare the results on the basis of accuracy, recall, precision and f-measure.
V. RESEARCH METHODOLOGY
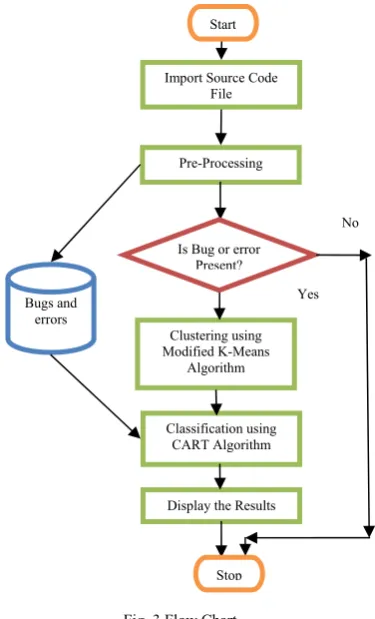
The research methodology is divided into 7 steps to achieve the desired results:
Step 1: In this step, we gather required information,
implement the layout of the system and create a database.
Step 2: In this step, we import the source code file of PHP.
Fig. 3 Flow Chart
Step 3: In this step, Preprocessing is done. In preprocessing
the checking of all the relevant bugs and errors is perform. After that detected bugs and errors are stored in database.
Step 4: The decision is taken on the presence of bugs in
source code. If Bug is present then proceed further, otherwise it will stop.
Step 5: In this step, we make clusters of particular bug or
error with the help of modified K-Means clustering.
Step 6: We classify the relevant bugs using CART
algorithm at particular time, after clustering.
Step 7: At the end, the results are display and evaluated.
VI.RESULTS AND COMPARISON
Performance of the given work is determined on the basis of different parameters- Accuracy, Recall, Precision and F-Measure. Proposed work is compared with the previous work and we came across the following results:
Pre-Processing
Clustering using Modified K-Means
Algorithm
Classification using CART Algorithm
Display the Results Bugs and
errors
Import Source Code File
Is Bug or error Present?
Yes No Start
A. Accuracy
The formula to calculate accuracy of the system was given below:
Percentage Accuracy= (No. of Errors Detected and Classified/Total no. of Errors Taken)*100
Fig. 4 Accuracy Value
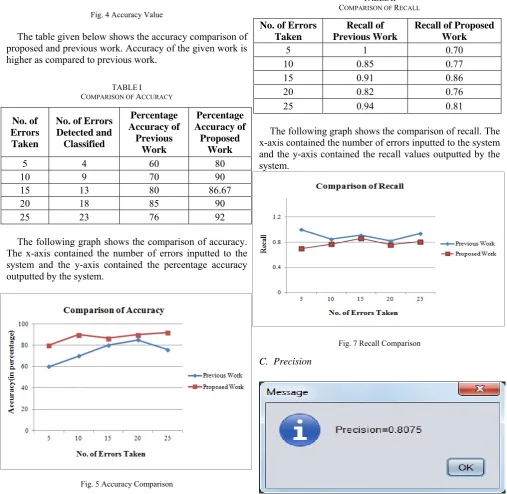
The table given below shows the accuracy comparison of proposed and previous work. Accuracy of the given work is higher as compared to previous work.
TABLEI COMPARISON OF ACCURACY
No. of Errors Taken
No. of Errors Detected and Classified
Percentage Accuracy of
Previous Work
Percentage Accuracy of
Proposed Work
5 4 60 80 10 9 70 90 15 13 80 86.67 20 18 85 90 25 23 76 92
The following graph shows the comparison of accuracy. The x-axis contained the number of errors inputted to the system and the y-axis contained the percentage accuracy outputted by the system.
Fig. 5 Accuracy Comparison
B. Recall
Fig. 6 Recall Value
Given table shows the comparison between the recall values of proposed work and previous work.
TABLEII COMPARISON OF RECALL
No. of Errors Taken
Recall of Previous Work
Recall of Proposed Work
5 1 0.70 10 0.85 0.77 15 0.91 0.86 20 0.82 0.76 25 0.94 0.81
The following graph shows the comparison of recall. The x-axis contained the number of errors inputted to the system and the y-axis contained the recall values outputted by the system.
Fig. 7 Recall Comparison
C. Precision
Given table shows the comparison between the precision values of proposed work and previous work.
TABLEIIII COMPARISON OF PRECISION
No. of Errors Taken
Precision of Previous Work
Precision of Proposed Work
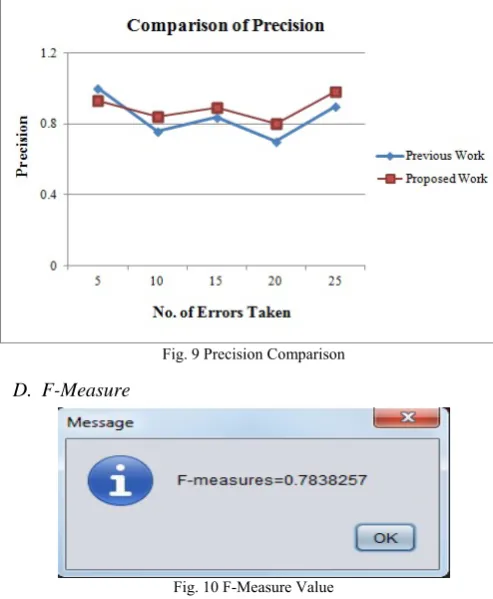
5 1 0.93 10 0.76 0.84 15 0.84 0.89 20 0.70 0.80 25 0.90 0.98
The following graph shows the comparison of precision. The x-axis contained the number of errors inputted to the system and the y-axis contained the precision values outputted by the system.
Fig. 9 Precision Comparison
D. F-Measure
Fig. 10 F-Measure Value
Given table shows the comparison between the F-Measure values of proposed work and previous work.
TABLEIIIV COMPARISON OF F-MEASURE
No. of Errors Taken
F-Measure of Previous Work
F-Measure of Proposed Work
5 1 0.80 10 0.80 0.81 15 0.87 0.88 20 0.75 0.78 25 0.92 0.89
The following graph shows the comparison of f-measure. The x-axis contained the number of errors inputted to the system and the y-axis contained the f-measure values outputted by the system.
Fig. 11 F-Measure Comparison
From the above graphs it is concluded that accuracy, recall, precision and f-measure values of proposed work are better than the previous work.
VII. CONCLUSION AND FUTURE WORK
In this paper, a new approach for checking language dependent accuracy of web applications developed using PHP is presented. Bugs or errors are detected in the source code. After that, clustering and classification is done to categorize them. Clusters are made on the basis of textual similarity and labels are provided. Clustered data is used for classification. Accuracy, Recall, Precision and F-Measure parameters are used for performance evaluation and graphs are plotted. From the comparison it is observed that the accuracy of given approach is more than the previous and it is more efficient.
In future, modern clustering and classification algorithms can be applied. It will include other types of errors like logical. Our approach requires understanding of the analyzed programming language and can be adapted to new languages.
ACKNOWLEDGMENT
REFERENCES
[1] A. V. Krishna Prasad, Dr. S. Rama Krishna, “Data Mining for Secure Software Engineering- Source Code Management Tool Case Study,” International Journal of Engineering Science and
Technology (ISSN: 0975-5462), Vol. 2(7), 2010, 2667-2677.
[2] Alexander Breckel, “Error Mining: Bug Detection through
Comparison with Large Code Databases” in Proc. MSR’12, 978-1-4673-1761-0/12 2012 IEEE.
[3] Aman Kumar Sharma, and Suruchi Sahni, “A Comparative Study of Classification Algorithms for Spam Email Data Analysis” ISSN: 0975-3397 International Journal on Computer Science and
Engineering (IJCSE) ,Vol. 3 No. 5, May 2011.
[4] Chunfei Zhang, and Zhiyi Fang, “An Improved K-means Clustering Algorithm” Journal of Information & Computational Science 10: 1 (2013) 193–199.
[5] David G.T. Dension, Bani K. Mallick, Adrian F.M. Smith, “A
Bayesian CART Algorithm”, Biometrika, Vol. 85, No. 2 (Jun., 1998),
363-377.
[6] Hardeep Kaur, and Harpreet Kaur, “ Proposed Work for
Classification and Selection of Best Saving Service for Banking Using Decision tree Algorithms” ISSN: 2277 128X International Journal of Advanced Research in Computer Science and Software
Engineering (IJARCSSE) Vol.3,Issue 9,September 2013.
[7] http://en.wikipedia.org/wiki/Error
[8] http://staffwww.itn.liu.se/~aidvi/courses/06/dm/lectures/lec3.pdf [9] Jiawei Han, Micheline Kamber and Jian Pei, Data Mining:
Concepts and Techniques, 3rd ed., 2013.
[10] Kahkashan Kouser, and Sunita, “A comparative study of K Means Algorithm by Different Distance Measures” ISSN (Print): 2320-9798|ISSN (Online):2320-9801 International Journal of Innovative
Research in Computer and Communication Engineering (IJIRCCE)
Vol.1,Issue 9, November 2013.
[11] Maninderjit Kaur, Dr. Sushil Kumar Garg, “An Approach to Detect and Classify Bugs using Data Mining Techniques”, International Journal of Advanced Research in Computer Science and Software
Engineering (IJARCSSE), Volume 4, Issue 7, July 2014.
[12] Maninderjit Kaur, Sushil Kumar Garg, “Survey on Clustering Techniques in Data Mining for Software Engineering”, International Journal of Advanced and Innovative Research (IJAIR) (2278-7844) / # 238 / Volume 3 Issue 4, April 2014.
[13] Matthew N. Anyanwu, and Sajjan G. Shiva, “Comparative Analysis of Serial Decision Tree Classification Algorithms” International
Journal of Computer Science and Security, (IJCSS) Volume (3):
Issue (3).
[14] Mohd. Mahmood Ali, Mohd. S. Qaseem, Lakshmi Rajamani, A. Govardhan, “ EXTRACTING USEFUL RULES THROUGH IMPROVED DECISION TREE INDUCTION USING INFORMATION ENTROPY” International Journal of Information
Sciences and Techniques (IJIST) Vol.3, No.1, January 2013 DOI.
[15] Mrs.V.Prema, R.Selvasudhan, “Multi Resolution Pruning Based Co-location Identification in Spatial Data” ISSN (Print): 2320-9798|ISSN (Online):2320-9801 International Journal of Innovative Research in Computer and Communication Engineering (IJIRCCE), Vol.2, Special Issue 1, March 2014.
[16] Naresh Kumar Nagwani, Shrish Verma, “CLUBAS: An Algorithm and Java Based Tool for Software Bug Classification Using Bug Attributes Similarities” Journal of Software Engineering and
Applications (JSEA), 2012, 5, June 2012, 436-447.
[17] P. V. Ingle, M. M. Deshpande, “Software Quality Analysis with Clustering Methods”,ISSN 2249-0868 International Journal of Applied Information Systems (IJAIS), Foundation of Computer Science (FCS) New York, USA and International Conference and
Workshop on Addvanced Computing (ICWAC), 2013.
[18] Shivkumar Hasmukhrai Trivedi, “Software Testing Techniques” ISSN: 2277 128X International Journal of Advanced Research in
Computer Science and Software Engineering (IJARCSSE) Vol.2,
Issue 10, October 2012.
[19] V.Neelima, Annapurna.N, V.Alekhya, and Dr.B.M.Vidyapathi, “Bug Detection through Text Data Mining” ISSN: 2277 128X International Journal of Advanced Research in Computer Science
and Software Engineering (IJARCSSE) Vol.3,Issue 5,May 2013.
[20] Varsha Choudhary, and Pranita Jain, “ Classification: A Decision Tree For Uncertain Data Using CDF” ISSN: 2248-9622 International Journal of Engineering Research and Applications (IJERA) Vol. 3, Issue 1, January -February 2013, pp.1501-1506. [21] XindongWu , Vipin Kumar , J. Ross Quinlan , Joydeep Ghosh ,
![Fig. 1 Clustering Process [12]](https://thumb-us.123doks.com/thumbv2/123dok_us/7844556.1300471/1.595.306.549.555.767/fig-clustering-process.webp)
![Fig. 2 Classification Task [8]](https://thumb-us.123doks.com/thumbv2/123dok_us/7844556.1300471/2.595.62.295.261.409/fig-classification-task.webp)