PUBLIC POLICY AND NATURAL
RESOURCES MANAGEMENT
A framework for integrating concepts
and methodologies for policy evaluation
David PEARCE
Economics, University College London
Prepared for DGXI, European Commission
September 2000
Project officers: Marc Vanheukelen, Otto Linher
Contact: [email protected]
1
The issue
Environmental issues are at the forefront of European Union policy. The Treaty of European Union (1992) (the Maastricht Treaty) elaborated the role of environmental goals in EU policy. It spoke of the goal of 'sustainable growth respecting the environment' rather than the Treaty of Rome's 'continuous and balanced expansion'. Second, it spoke of the need to integrate environmental issues into all policies, whether environmental or not. This second provision is an explicit recognition of the pervasiveness of environmental impacts from all economic activity The Maastricht Treaty also introduced the 'precautionary principle' (the PP). The PP effectively says that lack of scientific evidence linking cause and effect shall not be deemed sufficient reason to take no action when there are significant risks. Finally, the Treaty extended the EU's role into international and global environmental policy.
The Amsterdam Treaty of 1997 introduced the notion of the achievement of 'sustainable development' as one of the EU's tasks, set out in Article 2. It had become clear that 'sustainable growth respecting the environment' had not raised the profile of the environment high enough, nor was it very clear what it meant. Sustainable development, which was however also not defined, took the place of sustainable growth. It was also clear that the previous attempts to get environment integrated into all policy actions had not succeeded. The Amsterdam Treaty repeats the need for this integration to take place and declares that it is one of the means of securing sustainable development.
But stating goals and adopting decision-making and decision-guiding procedures to achieve them are very different things, although the articulation of goals does have implications for the way in which they are secured. The literature on environmental policy is replete with an almost endless array of concepts, methodologies and procedures all of which are claimed to have some relevance to the overriding question:
how to take environmental issues into account in decision-making.
This paper attempts to provide an over-arching framework that defines and organises the various concepts and methodologies and shows how this framework can be made relevant to decision-making.
The literature is often presented as if the different methodologies are competing for centre stage in decision-making: i.e. they are presented as if they are answering the central question set out above. In fact, it is far from clear what questions some of the techniques are trying to answer. In other cases it is clear that they are trying to answer different questions. Accordingly, the
literature can be confusing if it is construed as having relevance to decision-making about natural resource management. We suggest that, while the entire literature is interesting, only a limited part of it is relevant to public policy.
2 Policy goals and target populations
We take it that the purpose of the resource management methodologies in question is to assist in the evaluation of policy. Policy evaluation1 is the subject of a huge literature, generally known as 'public policy analysis'. Evaluation means deciding whether a given policy is good/bad, desirable/undesirable, acceptable/unacceptable. What is good or bad depends on the viewpoint
of the decision-maker: what is good for me may not be good for you; what is good for industry may not be good for society as a whole; what is good for the EU may not be good for the world as a whole, and so on. Policy evaluation cannot be carried out unless we know what the target population is. EU decision-making tends to have several focuses for its policy:
1 The European Union population
2 EU plus potential accession country populations EU plus associated nations' populations
The wider Europe (defined by UN ECE boundaries, say)
3 The developing countries
4 The world as a whole
5 Current generations only (in any of the regions defined above) Current and future generations (in any of the regions defined above)
Vulnerable groups within current generations (geographically, or within a region) Vulnerable groups across current and future generations (geographically, or within a region)
All policy evaluation must therefore define who matters, or, as the public policy literature puts it, who has 'standing'.
Group 1 above defines a narrow, current-generation oriented target population. Group 2 allows for the growth of the Union and for transboundary impacts between the EU and other countries. Group 3 defines the target group for EU development aid policies. Group 4 defines the group for EU global policy, e.g. on climate change. Group 5 raises the issue of sustainable development in terms of targeting vulnerable groups within society now, and future
generations who could be worse off as a consequence of current generation policies. These are
intra-generational equity and inter-generational equity concerns.
The five groupings above assume that it is human beings who have standing. The focus is
anthropocentric. Some people argue that all sentient beings have standing, in which case the target population has to be extended to include at least non-plant species. A 'deep ecologist' might also extend the targeted population to include plant biota and even non-sentient 'things'. It matters considerably what the target population is. In what follows, we retain the
anthropocentric focus but the analysis could be extended to see what difference the appreciation of 'intrinsic' values would make.
The outcome of policy evaluation will be sensitive to the definition of the target population. Selecting target populations is not straightforward. It may be determined by political boundaries, by political interests, and by moral concerns. Disputes over methodologies can sometimes be traced to a failure to define the target population.
The next major issue is to what is policy trying to achieve? There has to be an agreement on the
goals of policy. The European Union has various goals and there is no guarantee that these goals are consistent. By consistent goals we mean goals that, if any one of them is achieved, others are not prevented from being achieved. Consistency tends to show up in what has become known as win-win solutions. While it is a matter of judgement, the suggestion here is that win-win solutions are actually not common. Policies usually involve inconsistent goals in these sense that there is a trade-off between achieving more of one goal and more of another. Policy may therefore involve compromise between goals. The problem with compromise is that it leaves at least one party feeling that it could have achieved more from the policy than it did, and maybe all parties feel this. Unless they accept the compromise, they then have incentives to disrupt the
policy in the hope of doing even better. The design of incentives is thus crucial to the design of policy. Essentially, policies have to be designed so as to approximate solutions in which the relevant stakeholders2 are better off with the policy than without it.
Neglect of this simple 'game theoretic' observation - that the population must be better off with the policy than without it - is a fundamental weakness of some of the
suggested policy evaluation methodologies.
The goals for policy are twofold3:
Improving the individual wellbeing of the determined target population Improving the collective wellbeing of the targeted population.
The difference between the two is that the former relies on individuals to determine what their own wellbeing is- 'individual sovereignty'- whereas the latter focuses on a concept of society
that is not necessarily the same as the sum of individual's wellbeing. In both cases, individuals may make the decisions about what is good or desirable, but in the former case they act in their own interests, while in the latter they act as if they are citizens whose concerns extend to what is good or desirable for all individuals. This distinction is fundamental to the policy evaluation literature. Space forbids that we address it in detail. But the essence of the debate is that the former criterion appears to be based on self-interest, whilst the latter does not. For some, making decisions on the basis of self-interest is morally unacceptable, and hence the relevant criterion for good decision-making is that decisions be responsive to 'citizens' preferences'
rather than individuals' preferences. In turn, this raises the issue of how preferences are to be elicited. The market place would appear to be a medium for eliciting self-interested
preferences. The political arena would appear to be a location for eliciting citizens' preferences4.
While fundamental to an understanding of the debate about decision-making, the contrast between the two forms of decision-making is less helpful than it first appears:
• there is nothing in the notion of an individual preference that says that such preferences have to be self-interested. Preferences are motivated by a myriad concerns: self-interest, the interest of the decision-maker's household, concern for others, concern for animals, and so on. The now vast literature on expressed preferences is testimony to this5.
• there is no guarantee that political institutions, new or old, elicit citizens' preferences since political decision-making is open to the influence of lobby groups, political self-interest etc.
• care has to be taken that rejecting individuals' preferences does not constitute a moral offence of disenfranchising individuals in the decision-making process. It is not clear, for example, who decides what is a 'legitimate' preference and what is not, opening the way for elitism at best and totalitarianism at worst.
• even if individuals' preferences are motivated by self-interest, a rule that says everyone's preferences matter would automatically detect those who suffer from the actions of others, i.e. interdependencies, or 'externalities' should automatically be recorded6.
The debate over policy evaluation techniques reflects substantial differences of opinion about how far individuals make decisions, or can be trusted to make
decisions, that are in the interests of society as a whole. But the contrast between elf-interested and socially-motivated preferences is almost certainly an exaggerated and unhelpful one.
4 The literature on 'deliberative and inclusionary procedures' argues that prevailing political institutions are not guaranteed to elicit citizens' preferences and that 'new' institutions such as focus groups and citizens' juries are required.
5 The fault here probably lies with the vast number of economics textbooks that continue to portray preference-formation as if it is motivated by self-interest alone, despite frequent admonitions to the opposite effect from distinguished economists over the last fifty years or so.
3
The policy matrix
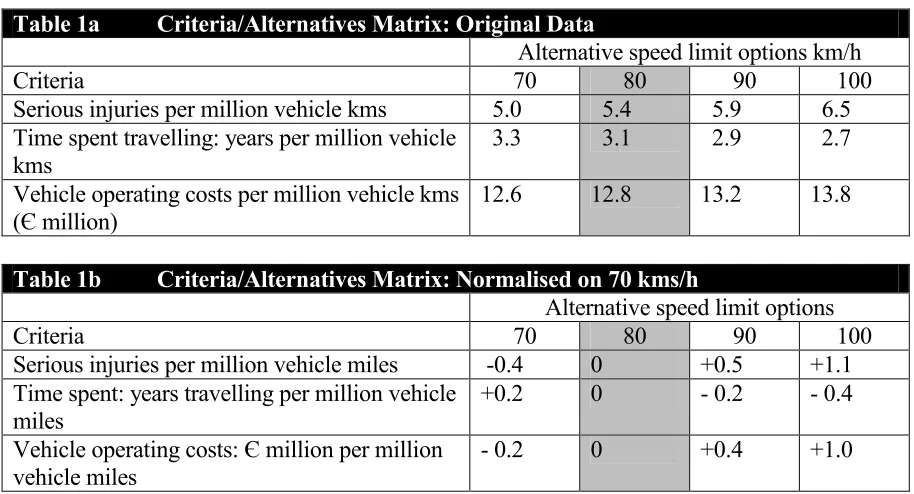
Policy analysts emphasise the need to establish at the outset some framework for the comparison of the criteria of a 'good' policy (project, programme etc) and the alternative options that are open. A typical example is shown in Table1, which reveals the nature of the trade-offs in all choices. We have chosen a simple speed limit example, but any other example would suffice.
The alternative policy options are shown at the top right of the matrix, say changes in a speed limit on major roads. The criteria by which the desirability of changes in the speed limits could be judged are shown to the left of the matrix. The criteria might be the number of serious accidents, travel time saved and the cost of operating vehicles. The criteria reflect the goals of the decision-maker. The cells of the matrix 1a then show estimates of the change in speed limits on each of the criteria used. Illustrative numbers are provided. The second matrix, Table 1b, shows the same information but this time ‘normalised’ on an existing reference base, e.g. the current speed limit. Since injuries and vehicle cost increase with higher speed, but time spent travelling falls, there is a trade-off between the criteria, reflecting the point made earlier that goals are rarely consistent.
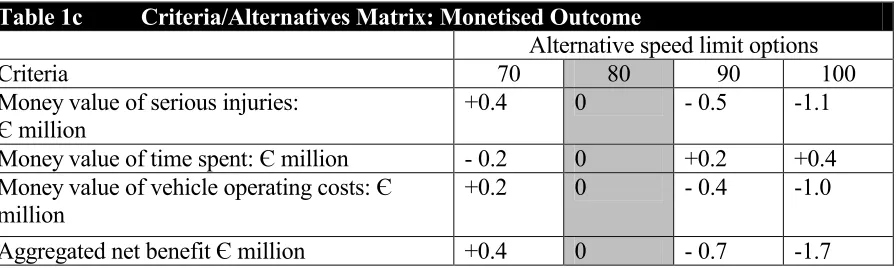
Tables 1a and 1b make it clear that the choice of the ‘right’ speed limit depends on factors over and above the ‘basic’ information provided about the effects of speed limits. What is required is some mechanism for trading off the time, cost and injuries, i.e. we need to know at what rate the benefits of saving time can be traded for increased cost and increased injuries. Economists adopt preferences, as revealed through willingness to pay, as the means of making the trade off, but any set of weights can be used to illustrate the principles involved. To illustrate, Table 1c shows what happens if we adopted the following money valuation figures: each injury is valued at Є1 million and a year of saving time is also valued at Є1 million. Then the computation is simple, as Table 1c shows. The highest net benefit would be for a change in the speed limit downwards to 70 kms/hr. Again, note that the matrix in Table 1c could also be generated by any
procedure which produces rates of trade-off.
Table 1a Criteria/Alternatives Matrix: Original Data
Alternative speed limit options km/h
Criteria 70 80 90 100
Serious injuries per million vehicle kms 5.0 5.4 5.9 6.5 Time spent travelling: years per million vehicle
kms
3.3 3.1 2.9 2.7
Vehicle operating costs per million vehicle kms (Є million)
12.6 12.8 13.2 13.8
Table 1b Criteria/Alternatives Matrix: Normalised on 70 kms/h
Alternative speed limit options
Criteria 70 80 90 100
Serious injuries per million vehicle miles -0.4 0 +0.5 +1.1 Time spent: years travelling per million vehicle
miles +0.2 0 - 0.2 - 0.4
Vehicle operating costs: Є million per million vehicle miles
Table 1c Criteria/Alternatives Matrix: Monetised Outcome
Alternative speed limit options
Criteria 70 80 90 100
Money value of serious injuries:
Є million
+0.4 0 - 0.5 -1.1
Money value of time spent: Є million - 0.2 0 +0.2 +0.4 Money value of vehicle operating costs: Є
million +0.2 0 - 0.4 -1.0
Aggregated net benefit Є million +0.4 0 - 0.7 -1.7
The policy matrix is there to remind us that with any form of decision-making it is essential to state the goals clearly (the criteria), the different policy options and the effects that each policy option have on the goals. The matrix also shows that, whatever decision procedure we adopt, all evaluative procedures involve finding weights that reflect the relative importance of goals7. Finally, the sensitivity of outcomes to different weights can easily be tested: a form of 'value sensitivity analysis'8
These reminders are necessary because the illusion is sometimes created in the literature that policy evaluation can be 'value free'. It cannot be, nor should it be. Nonetheless, the fact that it has value content means that the goal (criteria, objective function) or goals should always be stated clearly. In many cases the goals of some supposed evaluative procedures are not stated by their advocates.
7 Note that treating each criterion as being equally important still involves the selection of weights, in this case unity. Note also that only if all goals are consistent in the sense defined in the text and only if changes in policy affect each of the goals in the same direction would there be no need of weights. This is so unlikely as not to be an interesting case.
4
Sustainable development
We can now proceed to investigate the various decision-making procedures and the linkages between them.
4.1 Limits and sustainability
A common feature of nearly all decision-making procedures emerging from the environmental literature is that they acknowledge some form of 'bio-physical' limits to economic activity. This statement may come as a surprise, since a large literature has developed which centres on the view that some decision-making procedures, especially economics-based procedures, operate as if there were no such limits. While this characterisation is justified with reference to some of the more esoteric theoretical literature in economics, it does not describe the policy-relevant
literature9. The debate has therefore become somewhat misguided and the real differences of view relate to the following issues:
How are limits detected?
How far into the future will the limits 'bind' decision-making?
What are the policies that might accommodate limits and ameliorate them?
Space forbids a detailed discussion, but some have argued that limits, for example on physical resources, will be reflected in resource prices. If the limits are binding, real prices will rise. There is little evidence that, globally, real resource prices are rising, but this observation also somewhat misses the point. The resources that would appear to be binding, if ecologists and others are correct, are those without markets - global atmosphere, biodiversity, for example - and if there are no markets, there are no resource prices to be observed. Indeed, the implicit price is then zero and at zero prices more of the resource will be demanded than at positive prices that would rule if there was a market10. Anyone deriving the conclusion that non-rising real resource prices imply a world without 'limits' has therefore misunderstood the limitations of this
literature.
A critical issue with respect to 'biophysical limits' is how they are to be accommodated if markets do not exist to register and adapt to scarcity. The two central notions relevant to his debate are (a) substitution and (b) constraints on the overall levels of 'consumption'. Again, much of this debate is confusing because of a failure to define concepts properly. The issues can be illustrated through an analysis of the concept of sustainable development.
Sustainable development is defined as rising per capita levels of human wellbeing over time. As stated, it is an anthropocentric concept designed to deal with the alleged problem of
inter-generational equity. Inter-inter-generational equity problems arise when actions by the current generation threaten the wellbeing of future generations. Hence policies aimed at sustainable development will focus on the avoidance of activities that threaten future wellbeing. Contrary to
9 Space forbids a detailed discussion. Some of the economic growth models of the 1970s were certainly constructed in such a way that some form of continuous substitution between natural resources and other inputs could go on 'for ever'. Modern-day 'cornucopians' (see the writings of Julian Simon and Herman Kahn) have also tended to borrow some of the suggestions of this literature, but they tend to be more persuaded by what they see as lack of evidence of actual rather than theoretical limits.
the impression given by much of the popular literature, sustainable development is easy to define, the conditions for achieving it are more interesting and complex11. The literature has focused on conditions defined in terms of the capacity to develop, a capacity defined by capital stocks and their interaction with technological change and population change. Without offering any proof here, the intuition is that future generations can only be better off12 if they have more capital per capita than we have today. It is immediately obvious that population growth is inimical to sustainable development since it 'dissipates' the capital stock13. Technological change, on the other hand, enables a given capital stock to generate more
wellbeing per unit of the stock. An easy way to think of it, then, is to say that future generations will be no worse off if capital stocks are 'constant' and for the rate of technological change to just offset the rate of population growth. If technological progress is faster than population change then future generations could still be as well off as we are today with a lower capital stock, and so on14.
Capital stocks, as is now well known, involve man-made, natural, human and social capital. This broadening of the concept of capital is critical to an understanding of sustainable
development. For it is now easy to see that the total capital stock could be rising while any one form of capital is declining. The idea that forms of capital substitute for each other is embodied in the notion of weak sustainability. If, on the other hand, forms of capital are not substitutable then the requirement that the total stock be constant (rising) has to be supplemented by the requirement than the relevant specific capital stock should also be non-declining. In the literature, this has been termed strong sustainability.
4.2 Weak and strong sustainability
There is, for example, a heated debate between 'weak' and 'strong' schools of sustainability which tends to neglect the following issues15:
• while the strong sustainability literature has focused on natural capital as a constraint, it is arguable that social capital is also a constraint (e.g. social organisation is threatened, with some people arguing that social breakdown may be more important that environmental breakdown. Of course it is possible to believe both threats are very important);
• one cannot have strong sustainability without having weak sustainability, i.e. it is pointless to set a constraint on one form of capital unless there is also an overall constraint on the total stock. Otherwise the implication is that only one form of capital generates wellbeing, which is patently untrue. Some of the literature seems not to have understood this point;
11 We abstract from the issue of defining 'development'. The suggestion, not proven here, is that the conditions for achieving sustainable development will be largely invariant with the definition and measurement of development. 12 Strictly, can only have the potential to make themselves better off since capital stocks provide potential not guaranteed wellbeing. Future generations may, after all, fail to manage the capital stocks efficiently. On the foundations of the theory of sustainable development see Pearce et al. (1989) and Pearce and Barbier (2000). 13 Again, the issue is complex. If population growth stimulates technological change, then its benefits could exceed its costs in terms of capital dissipation.
14 The precise relationships are more complex, but these statements capture the essence of the modern theory of sustainable development.
• substitution implies commensurability - i.e. a common unit of measurement for aggregation;
• strong sustainability also implies commensurability since it would not otherwise be possible to know whether one was faced with constant, rising or falling natural capital, i.e. we must be able to aggregate different types of natural capital. Since one cannot have strong
sustainability without weak sustainability, it is also arguable that the wider notion of commensurability applies, i.e. between different forms of capital;
• constant natural capital is still consistent with substitution within the total stock of natural capital: solar power substitutes for fossil fuel, groundwater for surface water etc. Strong sustainability does not therefore imply no substitution at all. Again it is unclear if the point is fully appreciated. If there is no substitution within natural capital, then natural capital cannot be aggregated and a rule of not depleting the stock of natural capital has no operational meaning (no single item of natural capital could be depleted without replacing it with exactly the same form of natural capital).
• the domain over which substitution takes place needs careful definition. In one sense, strong sustainability has to be true: it is self-evidently not possible to substitute for natural capital as a whole. To see this, consider what one would substitute for the world's oceans or for the whole ozone layer. The answer is that not that there is limited substitution but that the question is meaningless. Without natural capital as a whole, life would cease. A large part of the 'substitution' debate fails to recognise that substitution in the economic sense refers to
substitution at the margin: i.e. a small change in damage to the ozone layer, an incremental level of damage to the oceans, etc. This failure to distinguish total and marginal
substitution has rendered a significant amount of the debate fruitless. Equally, it can be argued that some advocates of strong sustainability are talking about total substitutability since they feel that the world is close to its physical (total) limits. Whatever is the case, economists have perhaps been less than clear in explaining the marginal concept of substitution16;
• the empirical evidence for and against substitution at the margin has been generally absent, the literature tending to resort to pure assertion one way or the other;
• if natural capital is a constraint, it suggests that it is its per capita quantity that matters. If so, then unless natural capital can be augmented by technological progress, a constant level of natural capital per capita implies a rising total level of natural capital in the face of population growth. It is obvious that technological progress does augment many forms of natural capital (e.g. we are more efficient in the use of materials) but less obvious what it means for other forms of natural capital. If so, a policy of avoiding natural capital loss is not good enough, natural assets must be expanded at a rate at least equal to the rate of population growth17;
• weak sustainability is often characterised as being consistent with a 'no limits' standpoint, whilst strong sustainability explicitly acknowledges a limit on natural capital. But there is nothing in the weak sustainability paradigm that says the cost of substituting one form of capital for the other is constant or declining. Such a view would be consistent with the declining real price of resources argument, but, as noted, this argument applies only to
16 This failure is at the heart of the well-meaning but totally misguided efforts to place an economic value of world ecosystems - see Costanza et al (1997). Economic value derives from marginal changes, not from total stocks. The Costanza work is criticised in Pearce (1998).
marketed resources18. Hence it is not correct to define weak sustainability as if it fails to acknowledge biophysical limits. This justifies the point made earlier that the debate about 'limits' has tended to miss some of the central issues.
The policy evaluation implications of weak and strong sustainability are potentially very different. If natural capital is not substitutable at the margin, then aggressive policies are needed not only to maintain what natural capital there is, but to expand it, especially if the population target is developing countries or the world as a whole since population growth makes the 'constant per capita capital' rule more difficult to achieve. Since the population of the existing EU is projected to decline by 2050, hence both strong and weak sustainability arguments would then theoretically be consistent with a modest running down natural capital stocks19. One could envision a policy of just maintaining natural capital in the EU but implementing a stronger policy of augmenting natural capital in the developing world, an effective radical shift in policy for the EU if it came about. More realistically, the EU should seek to expand its natural capital base but should seek to do much more than this in developing economies.
The decision-guiding evaluation approach implied in strong sustainability does not involve a weighing up of costs and benefits: the constraint of non-declining natural capital simply has to be observed whatever it costs in terms of forgone alternative benefits20. However, this does not
mean that the natural capital stock need not be valued in some sense, since it is not possible to know whether it is changing unless some concept of an aggregate stock is developed.
Strong sustainability also has implications for the choice of policy instruments. Since
environmental taxes and charges cannot be guaranteed to achieve a quantity target, they will not be preferred, whereas tradable quota systems (which are quantity-based) will be preferred, as will outright bans, prohibitions, quantity-based environmental targets etc.
It is perhaps not widely recognised that there are real-world policy parallels for strong sustainability, an issue that is again perhaps not widely understood. In the USA, for example, the public trust doctrine declares that damage to a natural resource simply has to be negated by reinstating the pre-damage conditions (Pearce, 2000). This doctrine makes no reference at all to costs. The same philosophy can be detected in the US Endangered Species Act. Similarly, some countries have 'nature laws' that permits loss of, say, wetlands, on condition that some offsetting equivalent natural asset is created. Such offset policies are effectively strong sustainability policies. Such policies have been severely criticised for ignoring the opportunity cost of conservation.
Strong sustainability would imply the use of quantity-based policy measures at the expense of the more uncertain price-based measures, and the neglect of any
evaluation procedure requiring costs to be estimated. Arguably, strong sustainability is not consistent with the environmental policy objectives of the various treaties defining the Union (e.g. Article 130R on comparing costs and benefits).
18 One helpful way of thinking about it is to say that weak sustainability is consistent with 'Ricardian scarcity', i.e. a gradual rise in the real price of natural resources, whilst strong sustainability has built into it a Malthusian concept of absolute scarcity, i.e. biophysical limits. These notions, though not in the context of sustainability, are explored in Hall and Hall (1984). The essential point is that both notions of sustainability conditions embrace concepts of 'limits'. 19 This remark needs careful interpretation. We are not saying that natural resource should be run down.
If there is substitution at the margin, i.e. weak sustainability applies, then what matters is the
comparative social rate of return to incremental changes in different types of capital. It may pay society to make a marginal reduction in natural capital if the social rate of return to the use of the land supporting that natural capital is higher in some alternative use. This weak sustainability is consistent with the use of cost-benefit analysis because cost-benefit analysis explicitly allows for gains and losses to be weighed against each other. Weak sustainability would also be consistent with other forms of decision-making such as cost-effectiveness, risk assessment etc. where costs and outcomes are compared in some form or another. By
implication, weak sustainability is consistent with EU environmental policy as currently set out in the various Articles of Union. However, it is not clear if other principles affecting
environmental policy are equally consistent.
Note that the weak sustainability paradigm stresses that non-market assets be valued in monetary terms or in some terms that permit comparison.
5 Sustainable
consumption
Like sustainable development, the notion of sustainable consumption has created substantial confusion in the literature. This confusion derives from (a) failure to integrate the notion with the theory of sustainable development, of which it is a natural component, and (b) a failure to distinguish between 'consumption' as an economic concept and the resource inputs to consumption. What is meant by sustainable consumption depends very much on what definition of consumption is employed.
4.3 Sustainable consumption within the theory of weak sustainable development
Because of the development of the theory of sustainable development it is in fact possible to give the notion of sustainable consumption a rigorous meaning. To show this we require a small digression into the theory of modified national income accounts.
Conventional national accounts take the form:
NNP = GNP - dKm = C + I - dKm
Where NNP = net national product, GNP = gross national product, dKm = depreciation on man-made capital, I = gross investment.
Expanding the notion of net national product to include human and natural capital (Kh and Kn) gives:
gNNP = C + I - dKm +aKh - dKn
where dKn is depreciation on natural capital, and aKh is appreciation on human capital21. gNNP denotes 'green' national product.
We can also write
S = GNP - C
Where S is the conventional measure of gross savings. Hence
Snet = GNP - C - dKm
and
Sg = GNP - C - dKm + aKh - dKn
Sg is 'genuine' or 'green' savings and is equal to the conventional notion of gross savings (GNP-C) less any depreciation on capital stocks plus an appreciation on capital stocks.
Sg is a measure of weak sustainability. As long as Sg > 0, a nation is saving more than the depreciation on its capital assets. If Sg < 0, then the nation is consuming capital and it is not sustainable over any reasonable period of time (Atkinson et al, 1997)22.
Sg = 0 therefore defines 'knife edge' sustainability in the weak sense. Setting Sg = 0 gives us the maximum level of consumption consistent with sustainability, i.e.:
Cmax,ws = GNP - dKm + aKh - dKn
The (maximum) sustainable level of consumption is that which is consistent with genuine savings being zero23. In other words, sustainable consumption can be given a meaning within the context of weak sustainability. (Technology has been ignored but could be added to the right hand side. Social capital can also be allowed for)24. Ironically, this approach appears to be consistent with what some advocates of strong sustainability argue. Thus, for Costanza et al (1991) sustainable consumption is
'..that amount of consumption that can be continued indefinitely without degrading capital stocks, including natural stocks' (Costanza et al. (1991), p.8)25.
The formula above defines a context in which net investment is actually zero. The amount of investment taking place is just sufficient to offset depreciation. This will not guarantee non-declining per capita wellbeing if population is growing, nor would it achieve some target rate of growth of wellbeing, e.g. that people should be 'better off' as each year goes by. More generally, Cmax,ws is the maximum sustainable level of consumption but it is not necessarily the optimal level of consumption26. Thus, Cmax,ws is best thought of as some upper limit on optimal consumption. Indeed, Cmax,ws for the EU is likely to be above current levels of consumption because World Bank estimates show that EU countries have positive genuine savings (Hamilton and Clemens, 1999). Genuine savings could therefore be lower, and hence sustainable
consumption could be higher than it is at the moment. However, we repeat that maximum sustainable consumption is not the same as optimal consumption.
What policies would follow from a focus on the genuine savings/maximum sustainable consumption notion? The genuine savings approach shows that there are a number of policies which could ensure sustainable consumption is as high as possible - investment in education , invest in technology, investment in social capital, reduction of environmental damage through decoupling of the relationship between consumption and resource inputs and, more generally, encouragement of savings via tax-breaks and interest rate changes. The lessons are not new, but they now fit together in a coherent story of sustainable consumption.
22 Again, it is more complicated than this, but the rules as stated capture the essence of the issue. 23 This is the 'Hartwick path'. Note that it is a sustainable but not necessarily an optimal path.
24 As with much of the analysis in this short paper, there is a clear need for much more detailed exposition, perhaps in a future document or report.
25 Costanza et al. may not have recognised that this is a weak sustainability criterion since it embraces all capital stocks, but they may have intended to imply that the overall stock of capital should not decline and, additionally, the stock of natural capital should not decline, i.e. strong sustainability.
5.2 Sustainable consumption within the theory of strong sustainable development
How does the picture change if strong sustainability is assumed? The basic difference is that there is an added constraint. In addition to requiring that Sg ≥ 0, we require that dKn ≤ 0. The maximum sustainable consumption level is now:
Cmax,ss = Cmax,ws - OCcons
The expression OCcons is the sacrifice of consumption that has to be made in order to conserve Kn at its existing level.. It can be thought of as a cost of conservation or, analogously, an
abatement cost such that the expenditure involved conserves the stock of natural capital.
The maximum sustainable level of consumption is less under strong sustainability by the cost of avoiding natural capital depreciation. This is because some consumption has to be diverted to replacing natural resources in order to honour the commitment to keep natural capital at least constant.
Annex 1 shows a diagrammatic exposition of the different consumption paths.
5.3 Optimal and sustainable consumption
In economics, it is assumed that consumption alone produces 'utility' or 'wellbeing'. In a world without population growth, then, the optimal level of consumption appears to be the highest level of consumption consistent with sustainability. That has already been defined as 'Cmax' in the previous sections. The reality is more complex for various reasons. First, population growth rates are usually positive, so that the pursuit of Cmax above would not guarantee non-declining
per capita consumption, which is the requirement for sustainability. Second, technological change needs to be considered as this will augment the efficiency of resources, i.e. will raise the ability to generate consumption from given inputs. Third, optimality is usually derived from setting up the problem as one of maximising the discounted future flows of consumption, whereas sustainability might not be consistent with this formulation of the problem (see the Annex)27. Fourth, for complex reasons, the two maximal sustainable consumption paths (Cmax,ws, and Cmax,ss) are not themselves optimal. It is possible that an optimal path with rising per capital consumption exists but it will involve significant technological change.
5.4 How should 'sustainable consumption' be achieved?
We have seen that sustainable consumption has meaning in the context of the theory of
sustainable development and that what constitutes the maximal sustainable level of consumption depends on whether we believe the weak or the strong view of sustainability. We have also seen that maximal sustainable consumption is not the same as optimal consumption, but technical difficulty and space forbid an elaboration of this point here.
Suppose now that any of these notions of sustainable consumption is set as a policy objective.
The essential difference in policy is that a strong sustainability view would not allow any sacrifice in the aggregate total of natural resources unless these are compensated for by offsetting investments in the same or substitute resources, while the weak sustainability view would allow natural resources todecline provided the decline was offset by investment in some other form of capital.
It is very important to note that weak sustainability is not consistent with running down resources and consuming the proceeds28. Weak sustainability does require an offsetting investment, but that investment can be in any form of capital. Strong sustainability limits the offset to investments in natural capital. Weak sustainability requires that the rents from natural resources be reinvested, not consumed29.
On the weak sustainability approach, policy appraisal rules that compared 'true' rates of return to investments would ensure that investment is allocated across the various forms of capital in an optimal fashion. The environment would be degraded if and only if the opportunity cost of conserving natural resources was higher than the return from conservation. As noted before, this underlines the importance of 'valuing' the environment in commensurate terms that permit rates of return to be compared, and the only means of doing this is via money as a measuring rod. Full and detailed cost-benefit appraisal is thus essential to the weak sustainability approach.
On the strong sustainability approach some form of valuation is still required. Recall that the rule requires that the total stock of Kn does not decline. But Kn is made up of a myriad set of resources that cannot be measured in common units (hectares, tonnes, cubic metres etc.). Even if they had the same units, the relative importance of their loss is not the same. It matters less than one tonne of sand is used up than that one tonne of PCBs is released. Hence aggregating Kn involves a common unit that builds in some method of weighting for relative importance. Money does that because it reflects human preferences. It is possible to imagine some other index of natural resources that is weighted in some way to reflect toxicity etc.30 Whenever the resulting index shows a decline, action would need to be taken to restore it to its initial value. In a sustainable consumption context that would imply taxing consumption and ensuring that the proceeds are reinvested in natural capital until the index resumes its initial value.
Some form of earmarked tax on consumption would therefore appear to be a policy implication of strong sustainability. On the weak sustainability paradigm, a tax might also be used to reduce consumption and increase savings, or revenues might be used to ensure that investment takes place in education, technology etc. In practice the difference between the two policies may not be that great because a strong sustainability policy has also to honour a weak sustainability constraint on the overall stock of capital, as noted earlier.
But there are problems with any policy designed to reduce aggregate consumption.
28 This is why so many countries actually fail a weak sustainability test. See Hamilton and Clemens (1999). 29 This is the 'Hartwick rule' again.
• First, it is very likely to be socially unacceptable unless it is secured through strong incentives to save. Reducing consumption is likely, for example, to reduce individual wellbeing and could have serious employment consequences if the sectors receiving earmarked funds are equally labour-intensive as the consumption sectors.
• Second, it could have consequences for nations exporting to the EU, and especially developing nations in so far as they export consumption products rather than investment products.
• Third, other than through consumption taxes and savings incentives, reducing consumption appears to involve 'lifestyle changes': somehow individuals are transformed in such a way that they decide not to consume so much and save more. Some of the literature implies a different scenario even to this, namely that people simply consume less because they work less, i.e. their consumption declines because their incomes decline31. But, despite the evidence to the effect that people in advanced economies have undergone 'value shifts' over time, there is little evidence that these shifts have altered consumption levels. The risk is that if lifestyle changes are not brought about spontaneously, or by encouragement and
persuasion, they will be brought about by fiat. The risk here is that such measures would infringe individuals' basic rights to choose how to lead their lives.
• Fourth, changing the aggregate level of consumption appears to be a very blunt policy instrument for the objective of reducing environmental degradation. This last point is perhaps the important one, for it highlights a major confusion in the literature on sustainable consumption. It is possible to have rising levels of consumption and falling levels of resource depreciation and environmental degradation. What has got confused is the difference in meaning between 'consumption' and the resources going into consumption. There are many high valued consumption activities that are demanding of very little by way of resources. If consumption and resource use can be 'decoupled', then the objective of maximising sustainable consumption can be achieved without significant further degradation of the environment. It seems clear from the literature that this decoupling or
dematerialization is what many people mean by sustainable consumption. But many do not mean this and this latter group is far more clearly aiming to reduce economic growth and hence consumption levels32.
31 This appears to be what many 'anti-growth' advocates believe.
6 Decoupling/dematerialization
Section 5 showed that there were quite rigorous meanings to be attached to the phrase 'sustainable consumption'. It also suggested that, while it is theoretically possible to achieve maximum sustainable consumption through policies designed to reduce aggregate consumption (assuming that was required), this is at best an inefficient approach and at worst a socially disastrous one. A more sensible approach is to change the ratio of consumption to natural capital, i.e. to decouple the economy and natural resources. All kinds of indicators exist for checking what these ratios are (although they are usually express in terms of ratios of inputs to GNP rather than consumption). The most famous are energy/GDP ratios and, more recently, materials-intensity ratios. An example is the total materials requirement (TMR) approach in Adriaanse et al (1997). TMR involves what is essentially a familiar activity of constructing input-output accounts but in physical terms33. The TMR approach adds up all the resources used in the production of economic goods, including those resources that are discarded as waste and which have no economic value. Those entering the monetary flow are recorded in conventional national accounts but those not afforded a market price are excluded from those accounts, the so-called 'hidden flows'. The result is a set of figures of resource flows in the economy. Advocates of TMR approaches argue that these figures could be used to track whether 'decoupling' is taking place or not. Adriaanse et al (1997), for example, show time series of TMR per capita for several countries. These would suggest that, of the four countries they study, only the USA is experiencing 'dematerialization', with Germany, the Netherlands and Japan showing rising TMR per capita. But expressed as a ratio to GDP, all countries show a dematerialization trend.
The obvious problem for the issue of policy guidance is that, while such estimates are interesting, they have no policy meaning. The reason is actually acknowledged by the researchers. One tonne of material A is not the same as one tonne of material B in terms of environmental importance. The idea of aggregating all materials into tonnes is therefore
meaningless for policy purposes. What matters is the 'impact weighted' amount of materials and one cannot know what these impacts are without knowing: the environmental toxicity of the material in question, the assimilative capacity of the receiving environments, levels of exposure and levels of human and ecosystem response to such levels of exposure. Additionally, if policy is to be sensitive to human preferences, the weights must also relate in some significant way to those preferences.TMR totally neglects the issue of whether a given tonne of materials is important or not. In terms of the criteria/policy matrix introduced in Section 3, tonnes have been equally weighted in the TMR approach and there is no conceivable justification for this beyond the convenience of being able to add up different tonnes.
Much the same remarks apply even to very popular indicators, such as the ratio of energy to GDP. Each energy input is not equally important because it depends on what impact the different energy inputs have on the environment. Natural gas is, for example, less damaging than, say, coal.
Indicators of materials intensity are interesting but their use for policy purposes is extremely limited because of a failure to define what the goal is meant to be. It appears to be that one should reduce the TMR of economic activity. But this has no necessary implication for environmental improvement since the mix of materials matters as
much as, if not more than, the total. What is needed then is a set of weighted
7 Carrying
capacity
7.1 The notion of carrying capacity
One long-standing notion of biophysical limit is that of carrying capacity. In the context of humans, carrying capacity is set by the 'binding resource', i.e. the resource that is most limited in supply. Assuming that humans have a minimum viable requirement for the resource below which they would cease to exist, then carrying capacity is given by the simple formula:
CCi = MSPi = Annual resource yield(i)
Minimum resource requirement per capita
Where i is the binding resource, and MSP is maximum sustainable population.
How useful is the notion of carrying capacity? It has some value as an awareness raising
indicator. Beyond that its policy relevance is negligible. The reasons for this are:
• Carrying capacity indicators imply zero substitutability between assets. But resources can be substituted at least by other resources even in developing country contexts (fuelwood by kerosene for example).
• Resource yields can be increased by technological change in the case of renewable resources, and depletion profiles can be extended by technology in the case of non-renewable resources.
• Carrying capacity calculations have limited relevance when trade is possible since the scarce resource can be imported in exchange for another asset in which the exporting nation has a comparative advantage. We note below a carrying capacity concept that appears to imply that trade is not desirable, however.
• It is often possible to invest in carrying capacity even in poor country contexts, e.g. by improving water supplies through better capture of rainwater.
• CC is a limit. It tells us nothing about the desirable level of population. More than this, it is a limit determined by resource availability and by minimum input requirements. No-one would suggest that CC represents a desirable state of affairs if everyone is living at
minimum requirements levels. In many respects, carrying capacity is a survivability concept not a sustainability concept. Survivability is about maximising the time available on Earth for human species, independently of the quality of that existence.
But there is a sense in which carrying capacity serves as a benchmark. It may help to signal that certain policies are urgent:
• raising resource productivity
• investing in carrying capacity
• encouraging trade
• limiting population
• encouraging substitutes
• changing the ratio of resource use to consumption
Note that these policies are very similar to those derived from the analysis of sustainable consumption.
7.2 Is there absolute scarcity?
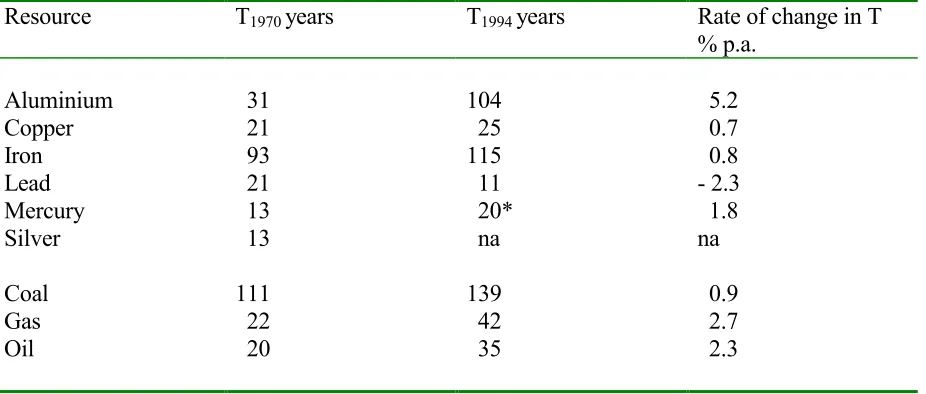
One way of looking at whether absolute scarcity exists is to estimate the physical scarcity of an exhaustible resource via the 'exponential index' of stocks. This measures the number of years before stocks are exhausted given an estimate of stocks and an estimate of the rate at which consumption grows. A simple formula for estimating this index, T, which is in years, is:
T = ln.(sg + 1)/g
Where T is time to exhaustion, ln is logarithm, Q0/q0 = s which is the static reserve index, i.e. the total stock in the initial period (Q0) divided by the extraction in the initial period (q0), and g is the growth rate of extraction. Table 2illustrates for some global resources.
Table 2 Changing values of 'resource life' 1970 to 1994
Resource T1970 years T1994 years Rate of change in T
% p.a. Aluminium Copper Iron Lead Mercury Silver Coal Gas Oil 31 21 93 21 13 13 111 22 20 104 25 115 11 20* na 139 42 35 5.2 0.7 0.8 - 2.3 1.8 na 0.9 2.7 2.3
Resource lives actually increase rather than decrease.
marketed resources, it is about the generally non-marketed ones, diversity, atmospheric sinks, water resources etc.
There is a need to develop better indicators of carrying capacity for non-marketed resources, especially biological diversity. The reality is that we do not know what a minimum viable level of diversity is. In the same way, we do not know what an 'acceptable' maximum rate of climate change is (despite the concept being embodied as a goal in the Framework Convention on Climate Change). There is a substantial research agenda in this respect.
7.3 Carrying capacity and net primary product
Arrow et al. (1995) propose that a more general indicator be employed such as that set out by Vitousek et al. (1986). This describes pressures in terms of how much Net Primary Productivity (NPP) human beings currently appropriate asan indicator of human appropriation of ecosystems under a variety of scenarios. The starting point is photosynthesis, the process whereby energy from the sun is turned into chemical energy embodied in biomass, and which is the basis for life on earth. Ecologists tend to use energy or carbon flows as their measures so that:
GPP = gross primary production = energy or carbon fixed by green plants in photosynthesis, all measured per unit of time.
NPP = net primary production = energy or carbon fixed in photosynthesis less the energy (or carbon) used up by plants in respiration.
Rates of conversion of solar energy to chemical energy are very low, perhaps of the order of 1 per cent. Forest tend to be more efficient at capturing solar energy than oceans. Essentially, it is NPP which is potentially 'available' for use by non-plant species, including humankind. The concept of an 'ecological limit' can be measured by the extent to which human beings 'appropriate' the NPP. The higher the level of appropriation, the less NPP is available for all other forms of life that need to consume NPP. Thus, in forests perhaps 5-7% of NPP is consumed by animals, but in the open ocean the figure may be as high as 40%.
Estimates of human appropriation of NPP suggest that humans already dominate the consumption or use of NPP. Vitousek et al. (1986) estimated that more than 40% of the Earth's land surface has been transformed by man. NPP is like a surplus or a net investment after depreciation (what is required for maintenance of function). The standing stock of biomass today is probably around 1800 x 1015 grams (about 1800 x 109 tonnes, i.e. 1800 billion tonnes), and the NPP is about 175 billion tonnes. In turn, NPP on land is about 132 billion tonnes and of this it is thought that humans 'appropriate' about 30-40% (Vitousek et al, 1986). Interestingly, only a minute fraction, around 1 billion tonnes, is consumed directly for food. Most of it is appropriated in the form of wasted food, forest products, residues and pastures.
of saying that humans are displacing other species and capturing ecological functions that are also valuable as life support systems.
Vitousek et al (1997) elaborate these statistics by adding that man is responsible for 20% of CO2 concentrations in the atmosphere, over 50% of water use and nitrogen fixation, are responsible for introducing 20% of plant species in Canada, account for over 20% of bird extinctions in the last few millennia, and have degraded or overfished some 60% of the world's fisheries. In a detailed assessment of just one region, Haberl (1997) finds that over 40% of NPP is appropriated by man in Austria. One consequence of this process of appropriation is the loss of biological diversity, essentially because man competes for available land with other species.
NPP appropriation indicators provide one interesting measure of 'biophysical limits'. It is not clear that human ingenuity could change the rate of global photosynthesis much, so that, in this sense, NPP is much more akin to an unalterable carrying capacity concept.
7.4 Carrying capacity: ecological footprints
The concept of an 'ecological footprint' (EF) was developed by Wackernagel and Rees (1996) as a measure of the extent to which the earth's carrying capacity is appropriated by human activity. The approach is essentially one based on strong sustainability in which the aim is to conserve the stock of natural capital (and ideally increase it). But whereas the economic approach to
sustainability requires that natural capital (and other forms of capital) be monetised, advocates of EF reject monetisation because, reflecting as it does a statement of human preferences, those preferences may fail to recognise biophysical limits. Wackernagel and Rees object to
monetisation not just on these ground: they are opposed to discounting (the monetary rate of exchange between consumption now and consumption in the future), to marginal analysis generally, and to any suggestion that natural capital has substitutes. The approach adopted by Wackernagel and Rees is therefore to find some other common unit of human impact and they choose land area.
To compute the EF the procedure is as follows:
• identify and measure the components of consumption in a given region: food, energy, transport, consumer goods and services.
• for each item of consumption, estimate the area of land that would have to exist in order to generate the resources involved in that consumption
• add the land areas to determine the complete 'footprint' of the region
• compare the footprint with the actual size of the region generating the footprint.
An example will help.
Wackernagel et al (1999) illustrate the EF approach for Italy. Each consumption commodity (e.g. cereals, fish, timber, tobacco etc.) is listed. Using internationally available statistics, the 'apparent consumption ' of commodity i (Ca,i) is computed as:
Ca,i = Qi + Mi - Xi
productivity (yield) of land, yi, in producing the commodity in question. Since the units of y are physical output per hectare, we have y = Qi/L and hence the ecological footprint is measured in per capita terms as
EF = (Ca,i .Li)/Qi.POP
Thus, Italy's apparent consumption of vegetables and fruit is 30.75 million tonnes, its population is 57 million, 'average productivity' is 18 tonnes/ha, so the EF is
EF vegetables/fruit) = (30.75)(106)/(57.106.18) = 0.03 hectares per person.
Extending across all consumer commodities, and with various adjustments to secure comparability, Wackernagel et al (1996) secure the result that each Italian 'commands' 4.2 hectares of land. The 'supply' of 'bio-capacity' is then estimated, i.e. the availability of land within Italy for crops, CO2fixation etc. This comes to 1.3 ha/cap. If a policy aim was self-sufficiency, i.e. if it is thought that Italy should meet its own ecological demands from within its borders, then, clearly, Italy is in 'national ecological deficit' of 2.9 ha/cap since domestic
ecological capacity can meet only about one-third of Italy's ecological demand.
How much ecological capacity is there available globally? Wackernagel et al (1999) suggest that, globally, biologically productive 'land' is made up of:
0.25 ha/cap arable land 0.90 ha/cap forest land 0.60 ha/cap pasture land 0.50 ha/cap sea space 0.06 ha/cap built up land --- 2.31 ha/cap total ---
But this is biologically productive land and mankind is not the only 'demander' of this quantity. A rough adjustment is made for non-human biodiversity demands at 12% of the world's land area, so that the maximum available to humans is 2 ha/cap. (Note the links to the NPP approach discussed above). This is what is 'available' now. If population grows, so that a population of 10 billion would reduce the average to 2/(10/6) = 1.2 ha/cap. If the 'norm' now is 2 ha/cap it will clearly change very quickly to 1.2 ha/cap as population grows. Wackernagel et al. declare that 'the challenge is to reduce the average footprint to at least this size' (Wackernagel et al, 1999, p.384).
Analysing 51 countries, Wackernagel et al. (1999) find that most developed countries have significant ecological deficits of around 3-4 ha/cap. The highest deficit is Singapore with 6.8 ha/cap, not dissimilar to Hong Kong's at 5.1 ha/cap. The only developed economies with ecological surpluses are the Scandinavian countries, Iceland, Canada, Australia and New
The notion of the EF is clearly useful for awareness raising. In terms of policy it adds little to what has been derived before from carrying capacity measures (which is what the EF is,
combined with some notional 'right' to equal shares of the world's ecological capacity). Thus Wackernagel et al. (1999) derive the following policy options:
• raise productivity per unit land/sea area
• lower resource use per unit consumption
• 'reduce consumption'.
The first two amount to the need to raise resource productivity increase discussed previously. The last is problematic as was noted earlier and it is unclear that it would serve any purpose other than causing more social problems, even if it was the realistic object of policy. That it is not a realistic policy is quickly seen by just two considerations:
(a) only some form of global government could overcome the fact that no one country has an incentive to reduce consumption unless others do the same;
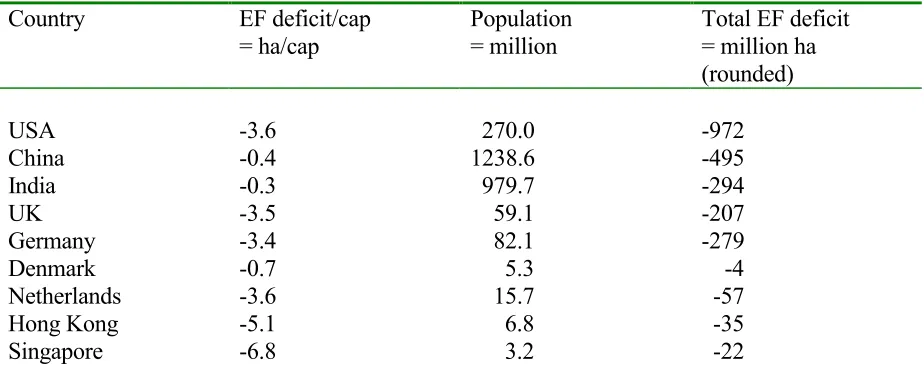
(b) while the 'ecological deficits' are expressed in per capita terms, their conversion to absolute terms by multiplying through by population shows that poor countries with large populations have larger ecological footprints than rich countries with smaller populations. This is shown in Table 3 below. But it is hard to imagine policies designed to reduce consumption in China and India, a logical consequence of the EF approach.
Table 3 'Deficit' ecological footprints for selected countries
Country EF deficit/cap
= ha/cap
Population = million
Total EF deficit = million ha (rounded) USA China India UK Germany Denmark Netherlands Hong Kong Singapore -3.6 -0.4 -0.3 -3.5 -3.4 -0.7 -3.6 -5.1 -6.8 270.0 1238.6 979.7 59.1 82.1 5.3 15.7 6.8 3.2 -972 -495 -294 -207 -279 -4 -57 -35 -22
Sources: ecological deficits from Wackernagel et al (1999). Population from World Bank data sources.
How useful is the concept of the EF for policy purposes? Van Kooten and Bulte (2000) list the following criticisms:
• a major component of the EF for developing countries relates to their carbon dioxide emissions. The EF methodology deals with this by measuring the area of land needed to grow biomes that would sequester the carbon. But there is no particular rationale for
but will also include significant amounts of emission reduction, something the EF
methodology does not address. Additionally, what constitutes an optimal mix requires that different time profiles of carbon fixing and emission reduction be compared, and this cannot be done without some form of discounting. Yet the authors of the EF approach are opposed to discounting.
• There are substantial uncertainties about how to calculate the land areas required to offset waste flows
• While EF advocates are opposed to the notion of substitution between forms of capital, the very process of aggregating different types of land assumes substitution. First, substitution between land as natural capital is assumed. Land in different uses is 'weighted' by its productivity, i.e. yield factors. This, of course, implies substitution between the land uses. Moreover, yields are simply listed without investigating whether they reflect economic distortions such as subsidies. '….solutions to environmental problems that depend on substitution cannot be studied using the EF tool' (van Kooten and Bulte, 2000, p.265).
• Substitution between natural capital and other forms of capital is denied but has actually to be assumed for the aggregation process to take place. This has to be the case because certain investment activities, e.g. housing construction, are evaluated using assumptions about how much land is needed for, say, timber. But the timber could come from land areas with very much higher yields by engaging in international trade. So, rather than one hectare of land in, say, Italy being required to produce X units of timber, Italy could secure X from another area overseas where the land required would be only some fraction of X. In this respect, trade reduces the EF. Overall, substitution is implicit in the aggregation process and different assumptions about substitution will affect the aggregate EF.
• The EF makes no distinction between land uses that are sustainable and those that are not. Land is also assumed to be 'uni-functional', i.e. serving only one use, whereas much land is multi-functional. Its productivity ('yield') has to account for these multiples uses.
• The EF is quite explicitly 'autarchic'. The more a country engages in international trade the bigger its EF is likely to be (though it is possible to have cases when this will not be the case). Hence the policy implications is that nations should minimise, not maximise trade opportunities. Apart from the implications of this for human wellbeing, if nations should be autarchic, so, presumably should regions within a nation, districts within a region, and, ultimately, persons within a district.
• As Table 3 shows, certain economies that are highly urbanised (Netherlands, Singapore, Hong Kong) can never be sustainable since they can never meet their ecological demands from their own land. Even maximising the land productivity of their imports probably cannot get them to a net positive EF (i.e. an EF of less than the nominal 2 ha/person). What are the policy implications for such nations if they can never be sustainable?
Van Kooten and Bulte (2000) conclude:
8 Environment and equity
8.1 Environmental space
A significant part of the debate about resource management is motivated by an understandable concern for equity between nations and especially equity between rich and poor nations. The ecological footprint concept has a notion of 'entitlement' to the world's carrying capacity, an entitlement that is equal to global land yield (aggregated across different land functions such as crops and carbon sequestration) divided by the world's population. As population grows, the entitlement diminishes unless global land productivity rises. This notion borrows from an earlier concept of 'environmental space' (ES) which can be defined as:
' the quantity of energy, water, land, non-renewable raw materials and wood that we can use in a sustainable fashion' (Hille, 1997).
Two concepts appear to be embodied in this notion: some flow rate of use that is sustainable in the sense of lasting for a very long time, and some notion of 'equity', i.e. what constitutes fair access to that flow rate of use. In some approaches there is also a minimum sustainable use rate, i.e. some use rate below which human wellbeing would be threatened (the carrying capacity concept introduced earlier).
How might an equitable share be computed? One suggestion is that a fair share is given by a country's population as a fraction of world population. Hille (1997) reports on a Dutch analysis carried out by Friends of the Earth that uses these notions. Using population shares will
obviously offend another equity principle if it is not modified. The reason is that population outside any given country may grow (at say a rate ∆POPw) faster than the population within the given country ∆POPi so that the 'fair share' formula:
(POPi /POPw). Rw = Ri
(where 'i' denotes the country in question, 'w' denotes the rest of the world, R denotes sustainable resource flow, and POP is population) will result in Ri going down. Yet country 'i' is not
responsible for the increased population growth so that it seems unfair that it should be penalised for population growth in the rest of the world. Moreover, if the above equation was to be used as a 'fair shares' formula, it would provide an incentive for each country to encourage population expansion in order to secure a larger share. Environmental space begins to imply unrealistic notions of institutional change - it implies a virtually dictatorial world government in order to avoid the game-theoretic context of an international agreement on such shares.
To avoid this aspect of unfairness, the Dutch study sets a limit on POPw which could be, say, the population in a specified year. If a country's own population POPi rises after that, its entitlement would remain the same so that its per capita entitlement would actually go down. The virtue of this approach is that it at least recognises the central role of population growth, something that often tends to be studiously avoided in discussions of 'sustainable consumption' concepts.