Discussion
Clear-cut results as to what is the best level of utilization were
not expected. October clipping
once a year is far different from
natural browsing. Deer use
throughout the year could hard-
ly be simulated by a clipping
study, but it probably would
have more adverse effect on
plant vigor and future produc- tion than the October clipping.
The plant species and its usual
place in succession has an im-
portant bearing, as shown by the
results with sassafras. The fact
that all study plants were under
a forest canopy is essential. A
given degree of utilization on a
plant in heavy shade may elim- inate all lower limbs or cause
mortality; and the same degree
of utilization on a similar plant
in an open situation might keep
it from growing too high and
thereby increase the future
yields.
The great difference between
species as to their reaction to
the monthly clipping points to
the necessity of judging a range
situation from a broad under-
standing of species. No general
rules are likely to be correct. It may be worth noting that the clipping rate at which produc- tion for 9 years was approxi- mately level varied from some-
thing less than 25 percent to
something over 50 percent
among the 6 species studied.
Conclusions
The clipping results show high
variability among species in
their resistance to utilization. For
forest conditions, the level of
utilization at which some species
can maintain production may be
less than 25 percent. For others,
something over 50 percent may
be acceptable. The optimum
level for most species probably is closer to 25 percent.
LITERATURE CITED ALDOUS, S. E. 1952. Deer browse
clipping study in the lake states region. J. Wildlife Manage., 16: 401-409.
GOODRUM, P. D. AND V. H. REID. 1958. Deer browsing in the longleaf pine belt. Proc. Sot. Amer. Forest. 1958: 139-143.
GOODRUM, P. D. AND V. H. REID. 1962. Browsing habits of whitetailed deer in the western gulf region. Deer Disease Symposium. p. 9-15, U. of Ga., Athens.
LAY, D. w. 1956. Some nutrition problems of deer in the southern pine type. Trans. Tenth An. Conf. SE Assoc. Game and Fish Corn., p. 55-58.
Shade Effects on Chemical Composition
of Herbage in the Black Hills
LOWELL C. McEWEN’ AND DONALD R. DIETZ
Runge Conservationist und Wildlife Biologist, Rocky Mountuin Forest und Range Experiment Station, Forest Service, USDA, Fort Collins, Colorado.2
Highlight Forested ranges in the Black
Kenfucky bluegrass and some as- Hills of South Dakota and Wyo- sociafed species confained more ming produce large amounts of nifrogen-free exfracf and less crude notentiallv valuable livestock
fiber; calcium, and phosphorus when
growing on open meadow sifes fhan and gamedforage. Although herb- when growing on pine-shaded sifes. age in adjacent meadows is During early developmenf, plants heavily utilized, grasses and
growing on soils derived from-lime- ” I -
sfone had a higher crude profein other plant species growing un- confenf ihan planfs growing on soils der forest shade are often under- developed from mefamorphic parent utilized. To determine if the
materials. reason for this difference in pref-
erence was related to chemical
1 McEwen is now Wildlife Research Biologist, Wildlife Research Lub- orutory, Bureau of Sport Fisheries und Wild life, Fish und Wildlife Service, U. S. Department of the Interior, Denver, Colorudo.
2 Central headquarters muintwined in cooperation with Colorudo Stute University at Fort Collins. Research reported here was conducted in co- operation with the South Dukotu School of Mines and Tech,noZogy ut Rapid City.
composition, studies were initi-
ated to investigate the effect of
shade on the chemical composi-
tion of herbage grown on two
major parent soil materials dur-
ing seasonal progression.
Study Area
The Black Hills of South Da-
kota and Wyoming are charac-
terized by stands of ponderosa
pine (Pinus ponderosa) inter-
spersed with meadows, parks,
and other openings. These open-
ings cover one-fourth to one-
third of the total area. Average
annual precipitation varies from
about 16 inches in the foothills
and the southern part of the
Black Hills to about 26 inches in
the northern part; the greatest
amounts fall in spring and early
summer (Orr, 1959). Average
January temperatures are in the
low 20’s and average July tem- peratures are in the low 70’s, with
maximums and minimums more
moderate than those of the sur- rounding plains. Average grow-
ing seasons at official weather
stations vary from 97 and 154
days, depending largely on eleva-
tion. Elevations range from
about 3,500 feet in the foothills to 7,200 feet at the highest point in the Black Hills. Two of the
major geological formations are
(1) a high limestone plateau
completely encircling (2) a cen-
tral area of igneous and meta- morphic mountains.
sisted of meadow and forested
sites on both the limestone pla-
teau and the metamorphic area.
Kentucky bluegrass (Pea pra-
tensis) provided about 60 percent of the total weight of herbage on the meadows sampled. Timothy
(Phleum pratense) and other
grasses and sedges produced
about 14 percent, forbs 25 per-
cent, and shrubs less than 1 per- cent of the total herbage weight.
Common forbs were yarrow
(Achilles Zunulosu), fleabanes
(Erigeron spp.), cinquefoils
(Potentillu spp.), and white clo-
ver (Trifolium repens). On the
forested sites, Kentucky blue-
grass produced about 10 percent
of the total herbage weight,
while associated grasses and
sedges made up about 50 percent.
Silvertop sedge (Curex foeneu),
fuzzyspike wildrye (Elymus in-
novutus), and roughleaf rice-
grass (Oryzopsis usperifoliu)
were the most common forage
plants. A wide variety of forbs
produced about 20 percent of
the herbage weight. Shrubs,
mainly bearberry (Arctostuphy-
Zos uvu-ursi), produced the re- .mainder, or about 20 percent of
the total herbage weight. Methods and Procedures
Herbage samples were collected at six paired meadow and forested range locations. Three pairs were located on the limestone plateau and three in the metamorphic re- gion. The meadow areas are typi- fied by narrow Kentucky bluegrass bottoms referred to as “stringer bottoms.” Forested collecting areas were located near the edges of mod- erately open ponderosa pine stands. Herbage samples were collected at Z- to 3-week intervals from early June to mid-August, and at 4-week intervals thereafter through mid- October in 1957, 1958, and 1959. The phenological stage of plant develop- ment was recorded at time of col- lection. Plants were clipped about 0.25 inch above ground level. Only the current year’s growth of un- grazed plants was taken. About 75 grams fresh weight per species were collected each sampling date at each site. All herbage samples were air-
CHEMICAL COMPOSITION
dried in the laboratory. The samples were analyzed for percent moisture, crude protein, ether extract (crude fat >, nitrogen-free extract, ash, cal- cium, and phosphorus. The bio- chemistry department of the South Dakota State College, Brookings, performed the analyses in accord- ance with the Official Methods of Analysis of the Association of Offi- cial Agricultural Chemists (A.O.A.C., 1950) *
A standard rain gage was main- tained at each pair of sites during the collecting periods in 1958 and 1959. Soil samples were collected for gravimetric soil moisture de- terminations (Olson and Hoover, 1954) in conjunction with herbage samples in 1958 and 1959.
Results
Crude Protein.-Mean crude
protein content of Kentucky
bluegrass for the periods col-
lected was significantly higher
in plants growing on forested
limestone sites than on the other
three site types (Table 1).
Roughleaf ricegrass and silver-
top sedge from the forested lime- stone sites also were higher in crude protein than when grow-
ing on forested metamorphic
sites, the only other type on
which those species occurred.
Although crude protein levels
varied within site from year to year, plants from the forested
limestone sites were highest in
protein each year.
Table 2 indicates that protein
content of bluegrass was related to the stage of plant development at the time of collection. Follow- ing the usual pattern of crude protein content in grasses, it was highest in the early vegetative stage and decreased as the plants
matured. This may account for
the apparent difference in pro-
tein content of forage on the for-
ested limestone site. The plants
from forested sites on the lime- stone soils were at an earlier
stage of development than plants
of the same species collected on the other sites during the same
chronological period. Kentucky
bluegrass samples collected from
meadow limestone sites were
185
almost as high in protein as sam-
ples from forested limestone
sites during the vegetative
growth stage (first collection
period), but declined more ra-
pidly in later growth stages
(Table 2). There was a differ- ence in protein content of blue-
grass forage between years of
collection. This was especially
noticeable while plants were in
the vegetative stage (Table 2).
Timothy, fuzzyspike wildrye,
silvertop sedge, and other sedge species declined to a lower aver- age crude protein content than
Kentucky bluegrass in Septem-
ber and October (Fig. 1). Rough- leaf ricegrass had a lower range in crude protein content in early
June, 11 to 14 percent, and a
higher range in October, 7 to 10
percent, than any of the other
species sampled.
Crude protein content was re- lated to herbage moisture levels in all species. In Kentucky blue-
grass, crude protein declined
rapidly as herbage moisture de- clined from 75 to 80 percent to 55 to 60 percent, but the protein decrease was small at the lower
moisture percentages (Fig. 2).
In the other four species sampled
a similar curve was obtained,
except that crude protein de-
creases were greater as moisture declined below 55 to 60 percent.
The index of correlation was
20
16
6
4 4
JUNE JULY AUG. SEPT OCT.
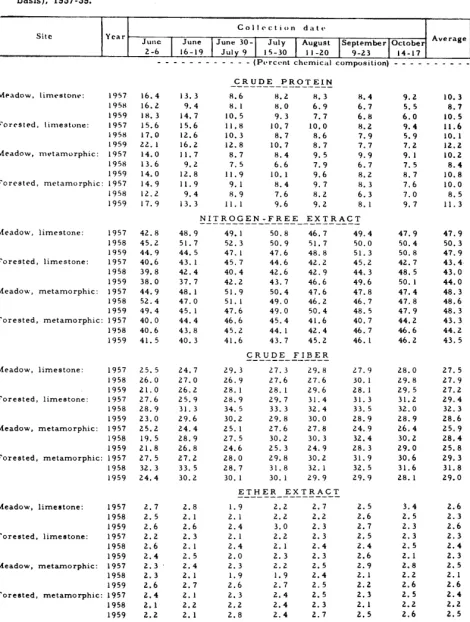
Table 1. Proximate analyses of Kentucky bluegrass collected from four site types in fhe Black Hills (dry weighi basis), 1957-59.
Collcctlon dattb
_-___--___ - - (Pcrccnt chcmic;ll composition) - - - - (Pc rccnt)
Meadow, limestone: 1957 16.4 1958 16.2 1959 18.3
Forested, limestone: 1957 15.6
1958 17.0
1959 22.1
Meadow, metamorphic: 1957 14.0
1958 13.6
1959 14.0
Forested, metamorphic: 1957 14.9
1958 12.2
1959 17.9
Meadow, limestone: 1957 42.8
1958 45.2
1959 44.9
Forested, limestone: 1957 40.6
1958 39. a
1959 38.0
Meadow, metamorphic: 1957 44.9
1958 52.4
1959 49.4
Forested, metamorphic: 1957 40.0
1958 40.6
1959 41.5
Meadow, limestone: 1957 25.5
i 958 26.0
1959 21.0
Forested, limestone: 1957 27.6
1958 28.9
1959 23.0
Meadow, metamorphic: 1957 25.2
1958 19.5
1959 21.8
Forested, metamorphic: 1957 27. 5
1958 32. 3
1959 24.4
Meadow, limestone: 1957 2.7
1958 2.5
1959 2.6
Forested, limestone: 1957 2.2
1958 2.6
1959 2.4
Meadow, metamorphic: 1957 2.3
1958 2.3
1959 2.6
Forested, metamorphic: 1957 2.4
1958 2.1
1959 2.2
Meadow, limestone: 1957 10.0
195s 6.4
1959 8.5
Forested, limestone: 1957 9.6
1958 7.5
1959 10.6
Meadow, metamorphic: 1957 9.4
1956 8.3
1959 7.6
Forested, metamorphic: 1957 10.7
1958 9.1
1959 9.7
CRUDE PROTEIN
_-__-____--_-___
13.3 a.6 a.2 a. 3 a. 4
9.4 a. I a. 0 6.9 6.7
14.7 IO. 5 9.3 7.7 6.a
15.6 ll.a IO. 7 10.0 H.2
12.6 10.3 a. 7 a.6 7.9
16.2 12.8 10.7 8.7 7.7
11.7 a. 7 a. 4 9. 5 9.9
9.2 7.5 6.6 7.9 6.7
12.8 11.9 10.1 9.6 a.2
11.9 9.1 a. 4 9. 7 a. 3
9.4 a. 9 7.6 a.2 6.3
13.3 11.1 9.6 9.2 a. I
NITROGEN-FREE EXTRACT
-_____-________---_-_---_ 48.9
51.7 44. 5 43.1 42.4 37.7 48. I 47.0 45. 1 44.4 43. a 40.3
24. 7 27.0 26.2 25.9 31.3 29.6 24.4 28.9 26. a 27.2 33. 5 30.2 2.8 2.1 2.6 2.3 2.1 2.5 2.4 2.1 2.7 2.1 2.2 2.1 7.6 6.5 7.2 8.8 7. 5 9. 7 9. 1 8.9 8.1 10.5 8. 1 9.4
49.1 50.8 46.7
52.3 50.9 51.7
47. I 47.6 48. a
45.7 44.6 42.2
40.4 42.6 42.9
42.2 43. 7 46.6
51.9 50.4 47.6
51. I 49.0 46.2
47.6 49.0 50.4
46.6 45.4 41.6
45.2 44. 1 42.4
41.6 43.7 45.2
CRUDE FIBER
-_--__--_----
29. 3 27. 3 29. a
26.9 27.6 27.6
28. i 28. l 29.6
28.9 29. 7 31.4
34. 5 33. 3 32.4
30.2 29. a 30.0
25. 1 27.6 27. a
27. 5 30.2 30.3
24.6 25. 3 24. 9
28.0 29. a 30.2
28.7 31.8 32. 1
30.1 30.1 29. 9
ETHER EXTRACT
-_-_---_-__~~-~~
1.9 2.2
2.1 2.2
2.4 3.0
2.1 2.2
2.4 2.1
2.0 2.3
2.3 2.2
1.9 1.9
2.6 2.7
2.3 2.4
2.2 2.4
2.8 2.4
ASH ---
7.4 7.7
6.9 7.7
6.6 6.7
7.5 8.8
8.6 9.7
8.4 8. 7
7.5 7.6
8.1 8.3
8.6 8.4
10.0 9.5
11.0 10.1
9.7 9.2
2.7 2.2 2.3 2.3 2.4 2.3 2.5 2.4 2.5 2.5 2.3 2.7 8.3 7.9 6.5 9.6 9.2 8.0 8.7 9.2 8.1 10.8 11.0 8.4 49.4 50.0 51.3 45.2 44. 3 49.6 47. a 46.7 48.5 40.7 46.7 46, 1
27.9 30.1 28. i
31.3 33. 5 28.9 24.9 32. 4 28. 3 31.9 32. 5 29. 9
2.5 2.6 2.7 2.5 2.4 2.6 2.9 2.1 2.2 2.3 2.1 2.5 7.7 7. 5 5.5 8.1 69:: 9.8 8.3 8.2 11.6 8.3 8.7 9.2 5. 5 6.0 9.4 5.9 7.2 9. 1 7. 5 a. 7 7.6 7.0 9. 7
47.9 50.4
50. a
42.7
48. 5 50. I
47.4 47. a
47.9
44.2 46.6 46.2
28.0 29. a 29. 5 31.2 32.0 28.9 26.4 30.2 29.0 30.6 31.6 28. 1
3.4 2.5 2.3 2.3 2.5 2.1 2.8 2.2 2.6 2.5 2.2 2.6
7. 5 8.8 6.0 9.5 7.7 7.2 9.2 8.8 7.0 9.8 8.9 8. 5
10.3 8.7 10.5 11.6 10.1 12.2 10.2 8.4 10.8 10.0 a. 5 Il. 3
47.9 50.3 47.9 43.4 43.0 44.0 48.3 48.6 48.3 43.3 44.2 43.5
27. 5 27. 9 27.2 29.4 32.3 28.6 25. 9 28.4 25.8 29.3 31.8 29.0 2.6 2.3 2.6 2.3 2.4 2.3 2.5 2.1 2.6 2.4 2.2 2.5 8.0 7.4 6.7 8.8 8. 5 8.4 8.8 8.6 8.0 10.4 9.5 9. l
CHEMICAL COMPOSITION 187
Table 2. Crude protein percentage (ovendry basis) and phenological stage of Kentucky bluegrass collected in fhe Black Hills in relation fo site, chronological period, and year of collection.
Site
Collection date Year
June June June 30- July August September October
2-6 16-19 July 9 15-30 11-20 9-23 14-17
I
_ _ - _ - - _ - _ - (Percent protein and phenological stage’) - - - -
Forested, limestone: 1957 15.6 V 1958 17.0 v 1959 22.1 v
Mean 18.2 V
Meadow, limestone: 1957 16.4 V 1958 16.2 VH 1959 18.3 V
Mean 17.0 v
Furestcd, metamorphic: 1957 14.9 v 1958 12.2 VH 1959 17.9 VH
Mean 15.0 VH
Meadow, metamorphic: 1957 14.0 VH 1958 13.6 H 1959 14.0 H
Mean 13.9 H
15.6 V 11.8 H 12.6 H 10.3 H 16.2 v 12.8 HF
14.8 VH 11.6 H
13.3 VH 8.6 H 9.4H 8,lHF 14.7 H 10.5 F
12.5 H 9.1 HF
11.9 VH 9.1 HF 9.4 H 8.9 HF 13.3 HF 11.1 F
11.5 H 9.7 HF
11.7 H 8.7 HF 9.2 HF 7.5 F 12.8 F 11.9 F
11.2 HF 9.4 F
10.7 F 10.0 F 8.2
8.7 F 8.6 F 7.9
10.7 F 8.7 FD 7.7
10.0 F 9.1 F 7.9
8.2 F 8.3 F 8.4
8.0 F 6.9 F 6.7
9.3 F 7.7 FD 6.8
8.5 F 7.6 F 7.3
8.4 F 9.7 F 8.3
7.6 F 8.2 F 6.3
9.6 F 9.2 FD 8.1
8.5 F 9.0 F 7.6
8.4 FS 9.5 S 9.9
6.6 F 7.9 F 6. 7
10.1 FD 9.6 FD 8.2
8.4 FS 9.0 FS 8.3
S 9.4
FS 5.9 FD 7.2
FS 7.5 S D FD
SD
D FS FD
FD
9.2 D 5.5 D 6.0 FD
6.9 D
SD FS FD
FD
7.6 SD 7.0 D 9.7 FD
8. 1 SD
SD 9.1 FS 7. 5 FD 8. 7
FD 8.4 D D D
D
Iv= vegctativc; H = seed heads showing; F = flowering to seed maturity; S = seeds disseminated; D = plants drying.
0.78 for the Kentucky bluegrass
curve and 0.87 for the curve for the mean of the other species, which were combined for analy-
sis. The relationships were cur-
vilinear and indices of correla-
tion were obtained by the
method of Ezekiel (1956) pre-
sented on pages 152-156. Crude
protein percentages were lin-
early related (r = 0.76) to herb-
age moisture percentages in
roughleaf ricegrass.
Crude Fiber and Nitrogen-
Free Extract.-There were sig-
80 70 60
7. tiER,“.tGE 40 MOISTURE 30 20 IO
FIGL I<E 2. Percentage crude protein in re- lation to percentage herhage moisture
(percent of dry weight) in Kentucky bluegrass collected periodically from four site types in the Black Hill? (r = 0.78).
nificant differences in the crude
fiber and nitrogen-free extract
content between forages grown
in open meadows and those from
shaded areas (Table 1). Crude
fiber is the relatively nondigest- ible portion of the plant carbo-
hydrates, while nitrogen-free
extract is the more digestible
portion containing sugars,
starches, and other soluble car-
bohydrates. Kentucky bluegrass
growing on forested sites on both
parent soil materials averaged
30.1 percent crude fiber over
three grazing seasons, while
Kentucky bluegrass growing in
open meadows in full sunlight
averaged 27.1 percent crude fi-
ber. Nitrogen-free extract con-
tent of the shaded Kentucky
bluegrass averaged 43.6 percent,
while open-grown plants aver-
aged 48.6 percent. The differ-
ences in nitrogen-free extract
and crude fiber content between
shaded and open-grown Ken-
tucky bluegrass were consistent
through the grazing season (Fig. 3) and were highly significant. The three other plants collected
showed similar differences.
Those from shaded sites aver-
aged 29.7 percent crude fiber
compared with 26.8 percent in
the plants collected from the
meadows. Nitrogen-free extract
in the plants other than Ken-
tucky bluegrass averaged 44.9
percent in the shaded plants and 51.4 percent in the open-grown.
/’ 1 I
JUNE JULY AUG. SEPT. OCT.
I’ ___----. -___ --_
.’ --.,
_.-- - ---____,,
>’ &KI BL’JESQPSS, F39ESTE3 SITES
z 24
22 1 I ,
JUNE JULY AUG SEPT OCT
Calcium, Phosphorus, and Ash.
-Calcium in Kentucky blue-
grass averaged significantly
higher in plants growing on
shaded metamorphic sites (Fig.
4). The plants decreased in cal-
cium after the vegetative stage,
but then increased again through
the later phenological stages.
Not all the plants other than
Kentucky bluegrass were ana-
lyzed for calcium. In the samples
analyzed, calcium increased as
the season progressed.
JUNE JULY AUG SEPT OCT
FIGURE 4. Calcium and phosphorus in Ken- tucky bluegrass on different site types in the Black Hills. Lines represent 3-year averages.
Phosphorus content declined
throughout the season in Ken-
tucky bluegrass (Fig. 4). The
highest values were obtained
from plants in the vegetative
stage, and the lowest while the
plants were drying. Kentucky
bluegrass plants growing on open
limestone so il s contained sig-
nificantly less phosphorus than
bluegrass from the other three
site types. Phosphorus was ‘not
determined for all samples of
the other plants collected. Sea-
sonal trends were similar to
trends in Kentucky bluegrass in
those samples that were ana-
lyzed.
Total ash content was gen-
erally higher in plants growing on soil derived from metamor-
phic rock compared with those
on soil derived from limestone (Table 1). Within the two soils,
shaded plants averaged higher
in ash than comparable open-
grown plants. Kentucky blue-
grass growing in the shade on
metamorphic soils averaged the
highest in ash, 9.7 percent; open-
grown plants on limestone soils
averaged the lowest, Kentucky
bluegrass, 7.4 percent, and timo- thy and sedges, 6.4 percent. No regular seasonal trends in total ash content of the plants were apparent.
Ether Extract .-Ether extract
(crude fat) in Kentucky blue-
grass showed no regular seasonal
trends or consistent differences
between sites from year to year
(Table 1). Apparently, stage of
plant development or amount of
shading had little effect on crude
fat content. Differences did exist
between species of plants col-
lected. Fuzzyspike wildrye aver-
aged the highest, 3.4 percent, and
silvertop sedge averaged the
lowest, 1.8 percent.
Discussion
Livestock utilize forested sites in the Black Hills markedly less than adjacent meadow sites, both
on limestone and metamorphic-
ally derived soils. Livestock on
the forested sites utilized an
average of only 7.8 percent of
the forage, compared to 42.3 per-
cent (herbage weight removal
basis) on nearby meadows. The low use of forage on the forested range may be due to lower
palatability. Shading of grasses
decreases sugars and the easily
hydrolyzable carbohydrates
(Welton and Morris, 1928; Wat- kins, 1940). High sugar content
is usually associated with high
palatability of for age to live-
stock. Sugars were not separated
within the nitrogen-free extract
analyzed in this study, hence it
can only be inferred from the
significantly lower nitrogen-free
extractcontent of the shaded
grasses that their sugar content,
and consequently their palata-
bility, was also lower. The sig- nificantly higher crude fiber con- tent of the shaded grasses could
also have contributed to reduced
palatability, since crude fiber im-
parts mechancial toughness and
contains the less digestible carbo- hydrate fractions and indigestible lignin. Certain animal behavior traits may have caused the ani-
mals to partially avoid the con-
finements of forested sites.
Although the herbage on the
forested sites contained less ni-
trogen-free extract and more
crude fiber, its protein and min-
eral content indicated a poten-
tially valuable feed source. Decline of crude protein with
advancing maturity of grasses
and sedges has been reported by
Cook and Harris (1950). In the
present study, roughleaf rice-
grass was the only species that
did not follow this pattern.
Roughleaf ricegrass differed
from the other plants studied by having earlier seed maturity and dispersal, and by retaining green leaves through the winter period. Crude protein in both the final fall and first spring samples of
the old leaves of this species
averaged 8.4 percent, which was
higher than the crude protein
content of the herbage of the
other species tested at those
periods.
Herbage moisture was corre-
lated with crude protein in the
forage plants tested. Herbage
moisture was highest in plants
from forested sites on both soils, although both forested sites were lower in soil moisture than the meadow sites. Herbage moisture
content on forested sites may
have been influenced by stage of
plant maturity. Plants on the
forested sites were generally 1
to 2 weeks later in their phe-
nological development than
plants growing in the meadows.
At both forested and meadow
sites, plants on limestone soils
had a higher herbage moisture
content than plants on metamor- phic soils. This cannot be at- tributed solely to soil differences,
because most of the limestone
precipitation than the metamor- phic sites. Differences in stage of
plant maturity also influenced
herbage moisture values.
All classes of cattle on range
forage require a minimum of 8
percent crude protein in their
diet (National Research Council, 1949). Growing and lactating ani-
mals need correspondingly high-
er amounts of protein to satisfy
physiological demands. Crude
protein content of the herb-
age analyzed generally dropped
below the recommended level in
September and October. Even
though average protein falls be-
low recommended levels, it is
questionable if animals on ranges
in good condition actually ex-
perience a protein deficiency.
Selective utilization of plant
parts and of late-developing spe-
cies containing sufficient protein
would allow livestock to main-
tain an adequate protein intake (Robertson and Torell, 1958). On
ranges in poor condition, how-
ever, late-developing species and
high-protein plant parts of other
species may be depleted to the point where protein supplements might be required for proper ani- mal nutrition.
Calcium levels were probably
adequate to meet nutritional re-
quirements for cattle and sheep
throughout the year, since cal-
cium content never fell below
0.20 percent and was usually
higher in the samples tested. The
recommended daily allowances
of calcium for winter mainte-
nance of beef cows and ewes are 0.24 and 0.30 percent, respective-
ly (National Research Council,
1949).
Phosphorus content of the
herbage tested fell below recom-
mended levels in September and
October. Recommended daily
allowances of phosphorus for
winter maintenance of beef cows
and ewes are 0.18 and 0.22 per-
cent, respectively. As with pro-
tein intake, however, if the ani- mals are on good range with the
opportunity for forage selection,
CHEMICAL COMPOSITION
they probably can maintain an
adequate phosphorus intake. On poor or heavily utilized range, a phosphorus supplement might be needed near the end of the graz- ing season.
Summary
Livestock in the Black Hills of South Dakota have shown a de-
cided preference for forage spe-
cies grown on open meadows
over those grown beneath pon- derosa pine stands.
To determine whether shading
influenced chemical composition
of forage species, plant samples
were collected at 2- to 3-week
intervals throughout the grazing
season-June through October-
during 1957,1958, and 1959. Herb- age samples were clipped from
Kentucky bluegrass, roughleaf
ricegrass, fuzzyspike wildrye,
timothy, silvertop sedge, and
other sedge species on limestone
and metamorphic sites both on
open meadows and under pine stands. The plant samples were analyzed for moisture, crude pro- tein, crude fat, crude fiber, nitro-
gen-free extract, ash, calcium,
and phosphorus.
The plants on the forested sites were 1 to 2 weeks behind those
on open meadows in stage of
plant development, which may
account for some of the differ- ences in nutritive content.
Kentucky bluegrass and other
grass and sedge species growing on the forested areas were gen- erally higher in protein, crude
fiber, calcium, and phosphorus,
and lower in nitrogen-free ex-
tract than similar plants from
open meadows on the same soils.
Only during the vegetative
growth stage were Kentucky
bluegrass and other plants grow- ing on soils derived from lime- stone generally higher in protein than similar plants growing on
metamorphic soils. Soils appear
to have little effect on nitrogen-
free extract, crude fiber, crude
fat, calcium, and phosphorus con-
tent of the plants, but plants
189
growing on soil derived from
metamorphic rock were general-
ly higher in ash content.
Calcium content was highest
in plants growing on forested,
metamorphic sites. Phosphorus
was lowest in plants growing on
meadow, limestone sites. The
two other site combinations pro-
duced plants nearly equal in cal- cium and phosphorus content.
Herbage moisture content of
Kentucky bluegrass and other
forage plants was closely corre- lated with crude protein content.
In general, the important
Black Hills forage plants tested
contained sufficient amounts of
all major nutrients with the ex-
ception of crude protein and
phosphorus. These were deficient during the late fall when the
plants had completed seed dis-
semination and were drying.
The heavier grazing use of the meadow vegetation in preference
to the available forage on the
forested sites was attributed in
part to lower palatability of the
shaded forage. This lower palat-
ability was indicated by lower
nitrogen-free extract percent-
ages, a measure of sugar content, and by higher crude fiber per-
centages. The quality of the
shaded plants in terms of pro- tein, fat, and mineral content ap-
peared nutritionally adequate
for livestock production. Im-
proved range management prac-
tices are needed to increase use of these forested ranges.
LITERATURE CITED
ASSOCIATION OF OFFICIAL AGRICUL- TURAL CHEMISTS. 1950. Official methods of analysis of the associ- ation of official agricultural chem- ists. 7th ed. Washington, D.C. COOK, C. W. AND L. E. HARRIS. 1950.
The nutritive value of range for- age as affected by vegetation type, site, and stage of maturity. Utah Agr. Exp. Sta. Bull. 344. 45 p. EZEKIEL, M. 1956. Methods of cor-
antes for domestic animals: No.
4, recommended nutrient allow-
ances for beef cattle. Natl. Res. Coun. Corn. Anim. Nutr., Wash- ington, D.C. 32 p.
OLSON, D. F. AND M. D. HOOVER.
1954. Methods of soil moisture de-
terminations under field condi-
tions. U.S. Forest Serv., South-
eastern Forest Exp. Sta., Sta.
Paper 38. 28 p.
ORR, H. K. 1959. Precipitation and
streamflow in the Black Hills.
U.S. Forest Serv., Rocky Moun- tain Forest and Range Exp. Sta., Sta. Paper 44. 25 p.
ROBERTSON, J. H. AND C. TORELL.
1958. Phenology as related to
chemical composition of plants
and to cattle gains on summer
ranges in Nevada. Nevada Agr.
Exp. Sta. Tech. Bull. 197. 38 p. UNITED STATES WEATHER BUREAU.
1957-59. Climatological data.
South Dakota. Annual Sum-
maries 57: 188-198; 58: 180-189; 59: 180-189.
WATKINS, J. M. 1940. The growth habit and chemical composition of
bromegrass, Bromus inermis
Leyss., as affected by different
environmental conditions. Agron.
J. 32: 527-538.
WELTON, F. A. AND V. H. MORRIS. 1928. Woodland pasture. J. Forest. 26: 794-796.
PROPERTIES OF SALINE
RANGE SOILS OF THE RIO GRANDE PLAIN
C. D. FANNING, C. M. THOMPSON
AND DEAN ISSACS
Research Soil Scientist, Soil and Water Conservation Research Divi- sion, ,4gricuZturaZ Research Service, Weslaco, Texas; Soil Scientist and Range Conservationist, Soil Conser- vation Service, Hurlingen and Alice, Texas respectively; all of the U.S.D.A.
Highlight
Range conditions on saline soils are poor as a result of overgrazing.
Reseeding plans need fo consider
species and droughi-inducing effects
of excess salts. Soil properties sug-
gest fhaf proper vegetative cover
would enhance salt removal.
Vast acreages of rangeland
within the Rio Grande Plain re- gion of south Texas are seriously affected by soil salinity. The area
with the greatest percentage of
salt-affected soils occurs pri-
marily on the Nueces, Frio and
Rio Grande River watersheds
(Figure 1). The region’s climate
is characterized by mild winters,
long hot summers and erratic
rainfall. Vegetation shown in
Figure 2 is typical of the affected soils. Spined woody species dom- inate the ecological system.
In the early development of
the region the only permanent sources of water were the Rio Grande and the Nueces Rivers on the south and north, respec- tively. Ranges near these water
sources were heavily ~ grazed and
in South Texas.
deteriorated to bare ground and brush. Since the 1860’s fence
building, ponds, and windmills
have distributed grazing over the entire region. With the exception of isolated areas, the range has been overgrazed and reduced to low productivity.
Historical data (Inglis, 1961)
and well managed areas indicate
that the climax vegetation was
an open grassland with traces of
low-growing woody vegetation.
Large woody species were con-
fined to overflow areas of the
major streams. The effect of
grazing pressure has been to re- duce grasses and allow woody plants to increase. This effect is
most pronounced on saline soils
where the original grasses have almost disappeared and a woody
‘j