A CHANGE IMPACT ANALYSIS APPROACH USING VISUALIZATION METHOD
RITA NOREMI BT MOHAMAD
A CHANGE IMPACT ANALYSIS APPROACH USING VISUALIZATION METHOD
RITA NOREMI BT MOHAMAD
A thesis submitted in fulfillment of the requirements for the award of the degree of
Master of Science (Computer Science)
Faculty of Computer Science and Information Systems Universiti Teknologi Malaysia
iii
ALHAMDULLILAH I dedicated this thesis to my parents, Ayah and Achik
My sister, Angah My brother, Along My step sister, Maisara My nephews and nieces
I would also like to thank
iv
ACKNOWLEDGEMENT
I would like to take this opportunity to thank my supervisor, Assoc. Prof. Dr Suhaimi Bin Ibrahim and Dato’ Prof. Dr Norbik Bashah bin Idris for their continuous encouragement, advice and inspiration throughout this research. I would also like to offer my heartiest gratitude to my friends Dahlia Din and Siti Hafizah Nor Abd Razak, who have helped me in prototype development.
v
ABSTRACT
vi
ABSTRAK
vii
TABLE OF CONTENTS
CHAPTER TITLE PAGE
DECLARATION DEDICATION
ACKNOWLEDGEMENT ABSTRACT
TABLE OF CONTENTS
LIST OF TABLES
LIST OF FIGURES
LIST OF ACRONYMS AND SYMBOLS LIST OF APPENDICES
ii iii iv v vii xiii
xv xviii
xix
1 INTRODUCTION
1.1 Introduction 1
1.2 Background of the Research Problem 1 1.3 Statement of the Problem 4 1.4 Objectives of the Study 4
1.5 Scope of Work 5
1.6 Importance of the Study 5
1.7 Thesis Outline 6
viii
2 LITERATURE REVIEWS
2.1 Introduction 9
2.2 Software maintenance 12 2.2.1 Problem in Software Maintenance 13 2.2.2 Software maintenance Categories 13 2.3 Program Understanding 14 2.3.1 Program Understanding Support Mechanism 16 2.3.1.1 Unaided Browsing 16 2.3.1.2 Leveraging Corporate Knowledge and
Experience
17
2.3.1.3 Computer Aided Technique 17
2.4 Reverse Engineering 18
2.4.1 Reverse Engineering Concept and Definition 18 2.4.2 Reverse Engineering Challenge 20 2.4.3 Program Understanding in Reverse Engineering
Automating Approaches
22
2.5 Change Impact Analysis 23
2.5.1 Change Process 24
2.5.2 Change Impact Analysis Definition 24 2.5.3 Change Impact Analysis Model 26 2.5.4 Ripple-effect Model 27 2.5.5 Typical Change Impact Analysis Process 29 2.5.5.1 Difficulties of Change Impact Analysis 31 2.5.6 Change Impact Analysis in Object Oriented System 31 2.6 Software Visualization Method 33 2.6.1 Type of Information Requirement in Visualization 36 2.6.2 Current Tools in Software Visualization Method 38
2.6.2.1 Rigi 38
2.6.2.2 PBS (Portable Bookshelf) 39
ix
2.6.2.4 SNiFF++ 41
2.6.2.5 CodeSurfer 42
2.6.2.6 CC-Rider 43
2.6.3 Software Visualization Method Used 44
2.6.3.1 Rigi 45
2.6.3.2 PBS 46
2.6.3.3 CATIA 47
2.6.3.4 SNiFF++ 48
2.6.3.5 CodeSurfer 49
2.6.3.6 CC-Rider 51
2.6.4 Features Provided 52 2.6.4.1 Taxonomy of Level Information Abstraction
of the Tools
52
2.6.4.2 Drawback of the Features 54 2.6.4.3 Strengths of the Features 55 2.7 The Comparative Evaluation of Current Tools 55
2.8 Proposed Solution 56
2.9 Summary 57
3 RESEARCH METHODOLOGY
3.1 Introduction 58
3.2 Operational Framework 59 3.2.1 Phase 1: Formulation of Research Problem 60 3.2.1.1 Preliminary Study 60 3.2.1.2 Literature Reviews 60 3.2.1.2.1 Understanding the Need for
Change Request Process
61
3.2.1.2.2 Understanding Object Oriented Programming Concept
x
3.2.1.2.3 Understanding Change Impact Analysis
62
3.2.1.2.4 Understanding Visualization Method
62
3.2.1.3 Analysis Current Approach and Existing Tools
63
3.2.1.4 Research Proposal 63 3.2.2 Phase 2: Prototype Development 64 3.2.2.1 CIA Using Visualization (CIA-V) Method
Model Design
64
3.2.2.2 CIA-V Prototype Development 65 3.2.3 Phase 3: Implementation and Evaluation 65 3.2.3.1 Supporting Tools Development 66 3.2.3.2 Choose Case Study 66
3.2.3.3 Experimental 67
3.2.3.4 Validation 67
3.2.4 Phase 4: Research Report 69
3.3 Research Assumption 69
3.4 Summary 70
4 CHANGE IMPACT ANALYSIS APPROACH USING VISUALIZATION METHOD
4.1 Introduction 71
4.2 Overview of Change Impact Analysis Using Visualization Method
72
xi
4.3.2.1 Dependencies 75
4.3.2.2 Change Impacts Granularity Level 76 4.3.3 Relationship and Dependencies in Change Impact 77 4.3.4 Visualization Technique 81 4.3.4.1 CIA-V Graphical Representation Model 81 4.4 A Proposed Change Impact Analysis Using Visualization
Method
82
4.4.1 Phase 1 : TokenAnalyzer Tool 83 4.4.2 Phase 1 : CATIA Model 84 4.4.3 Phase 2 : CIA-V Model 85
4.5 Summary 86
5 DESIGN AND IMPLEMENTATION OF CIA-V
5.1 Introduction 87
5.2 CIA-V Design 88
5.2.1 CIA-V Architecture 88
5.2.1.1 Change Request 90
5.2.1.2 Components Repository 90
5.2.1.3 Extract Process 90
5.2.1.4 CIA-V System 91
5.2.2 CIA-V Use Case 92
5.2.3 CIA-V Class Interactions 96
5.3 CIA-V Implementation and User Interfaces 104 5.4 Other Supporting Tools 109
5.4.1 TokenAnalyzer 110
5.4.2 CATIA 110
5.5 Summary 110
xii
6 EVALUATION OF CIA-V
6.1 Introduction 111
6.2 Case Study 112
6.2.1 Outlines of Case Study 112 6.2.2 OBA Project Briefing 113 6.3 Controlled Experimental 114 6.3.1 Subject and Environment 115
6.3.2 Questionnaires 115
6.3.3 Experimental Procedures 116 6.3.4 Possible Threats and Validity 117 6.4 Experimental Results 118 6.4.1 User Evaluation 118 6.5 Analysis of Findings 128 6.5.1 Qualitative Evaluation 128
6.6 Summary 131
7 CONCLUSION AND FUTURE WORK
7.1 Introduction 132
7.2 Contribution 132
7.3 Research Limitation and Future Works 133
7.4 Summary 134
REFERENCES 136
xiii
LIST OF TABLES
TABLE NO. TITLE PAGE
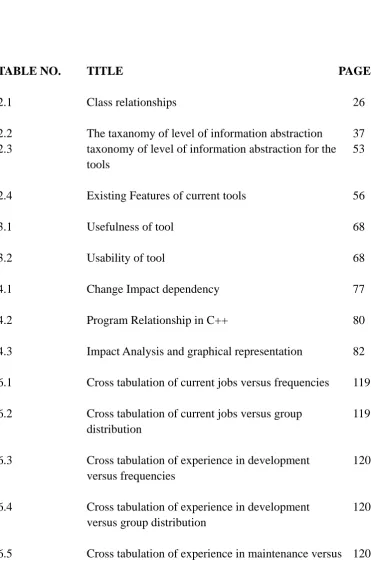
2.1 Class relationships 26
2.2 The taxanomy of level of information abstraction 37 2.3 taxonomy of level of information abstraction for the
tools
53
2.4 Existing Features of current tools 56
3.1 Usefulness of tool 68
3.2 Usability of tool 68
4.1 Change Impact dependency 77
4.2 Program Relationship in C++ 80
4.3 Impact Analysis and graphical representation 82
6.1 Cross tabulation of current jobs versus frequencies 119
6.2 Cross tabulation of current jobs versus group distribution
119
6.3 Cross tabulation of experience in development versus frequencies
120
6.4 Cross tabulation of experience in development versus group distribution
120
xiv
frequencies
6.6 Cross tabulation of experience in maintenance versus group distribution
121
6.7 Cross tabulation of knowledge and understanding in workproduct versus frequencies
121
6.8 Cross tabulation of knowledge and understanding in workproduct versus group distribution
122
6.9 Cross tabulation of assist by maintenance tools versus frequencies
122
6.10 Cross tabulation of maintenance tools versus group distribution
122
6.11 Cross tabulation of most prefer task versus frequencies
123
6.12 Cross tabulation of most prefer task group distribution
123
6.13 Mean of Usefulness of tools 126
6.14 Mean of scores for change impact analysis using visualization features
126
6.15 The taxanomy of level of information abstraction of the experiment tools.
129
6.16 Existing features of software change impact using visualization Systems
xv
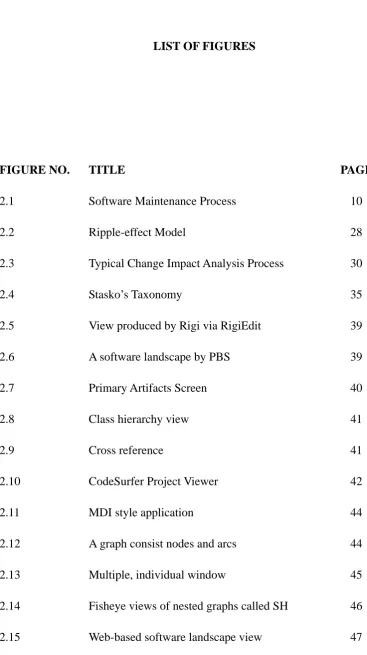
LIST OF FIGURES
FIGURE NO. TITLE PAGE
2.1 Software Maintenance Process 10
2.2 Ripple-effect Model 28
2.3 Typical Change Impact Analysis Process 30
2.4 Stasko’s Taxonomy 35
2.5 View produced by Rigi via RigiEdit 39
2.6 A software landscape by PBS 39
2.7 Primary Artifacts Screen 40
2.8 Class hierarchy view 41
2.9 Cross reference 41
2.10 CodeSurfer Project Viewer 42
2.11 MDI style application 44
2.12 A graph consist nodes and arcs 44
2.13 Multiple, individual window 45
2.14 Fisheye views of nested graphs called SH 46
xvi
2.16 Sample output of the impacted artifacts 48
2.17 Column-by-column tree view 49
2.18 The sample program and its system dependence graph
50
2.19 CC-RIDER architecture 51
3.1 Operational Framework 59
4.1 Overview of Change Impact Using Visualization Model
72
4.2 Class and Objects 73
4.3 Classes relationship 74
4.4 Change impact granularity level 76
4.5 CIA-V Approach 83
4.6 Output of CATIA 84
4.7 CIA-V Model 85
5.1 CIA-V Architecture 89
5.2 Use Case Diagram of CIA-V System 92
5.3 CIA-V Class Diagram 97
5.4 CIA-V Sequence diagrams 98
5.5 Visualization process algorithm flowchart 102
5.6 CIA-V Introduction screen 104
5.7 First user interface of CIA-V 105
5.8 Primary artifacts at method level 105
xvii
5.10 Source code viewer 107
5.11 Drill Down Mtd-getState() 107
5.12 Relationship Total Report 108
5.13 Impact Summary Report 108
6.1 Usefulness of tool (percentage values based on 4: Useful)
124
6.2 Usefulness of tool (percentage values based on 5: Very Useful)
124
6.3 Usefulness of tool (percentage values based on 3: Neither Useless Nor Useful)
125
xviii
LIST OF ACRONYMS AND SYMBOLS
AIS - Actual Impact Set ANOVA - Analysis of Variance
CASE - Computer Aided Software Engineering
CATIA - Configuration Artifact Traceability for Change Impact Analysis
CIA - Change Impact Analysis
CIA-V - Change Impact Analysis using Visualization IA - Impact Analysis
LOC - Line of Code
UML - Unified Modeling Language SDLC - Software Development Live Cycle RE - Reverse Engineering
OOP - Object Oriented Programming OBA - Automobile Board Auto Cruise PCR - Problem Change Report
xix
LIST OF APPENDICES
APPENDIX TITLE PAGE
A Questionnaire on Program Understanding in Change Impact Analysis using
Software visualization usability tools
140
1
CHAPTER 1
INTRODUCTION
1.1 Introduction
This chapter introduces the research work called A change impact analysis approach using visualization method. The discussion in this chapter includes
research background, problem statements, objectives and the importance of the study. We then describe the scope of work and thesis’s structure followed by the chapter summary.
1.2 Background of the Research Problem
2
A software manager needs to prepare plan schedule and scope of changes in order to estimate the maintenance cost before the changes are implemented.
Regularly, the management of software changes falls under the responsibilities of software experts because they understood the software better. Unfortunately, this practise is only suitable for medium and small scale softwares. Legacy software which is usually large requires more storage to handle software artifacts that might be increasing over time.
Many software engineers agree that implementing software changes without understanding the internal consequences may lead to higher cost on software release version, incomplete software design and unreliable software products (Lehman and Ramil, 2002). For instance, date change phenomenon that occurred around the year 1990’s to 2000 is a good example about the lack of understanding on change impact software (Ibrahim, 2006).
In technical context, software changes require suitable and effective techniques to study every impact that might occur against the software if changes are implemented. In this research, a change impact analysis tool will be used with visualization method to assist development team to understand the program better. Change Impact Analysis (CIA) provides high leverage strength in understanding and implementing software changes. It is because CIA renders depth examination over code or software that might be affected prior to changes.
3
artifact in software life cycle itself, especially during requirement and design phases, code components and test cases; and other artifacts’ traceability relationship and these approaches are static impact analysis techniques. For run-time information, dynamic impact analysis technique was used to determine change impact (Xiaoxia Ren et al., 2005).
Visualization method is used to describe software artifacts’ location in CIA. Visualization will show potential impact prior to changes. This method describes the potential relationship between artifacts. The visualization could help management and developer team to determine the action in time scheduling, cost estimation and human resource decision-making. Visualization could be made available through static program structure and dynamic behaviour. Static program structure can be analyzed based on programming code and dynamic behaviour, which are done through execution. This research is focused on static program structure based on programming code. The software structure visualization is useful to analyse software system, and it can be helpful in finding interactions or relationship between components in programming code.
4
1.3 Statement of the Problem
This study focuses on program understanding which is aided by CIA in using visualization method as mentioned in section 1.2. The main question is, “How can a software maintainers be estimated to better understand the software and estimate the
potential impact of the changes through visualization”
The sub questions of the main research question are as follow:
i. How to use visualization method to support program understanding of change impact?
ii. What is the suitable visualization method which can be used to apply in CIA based on object-oriented programming?
1.4 Objectives of the Study
The problem statement serves as a premise to establish a set of specific objectives that will constitute major milestones of this research.
The objectives of this research are listed as follow:
1. To build an effective model that could support CIA approach using visualization method to enhance program understanding and trace potential impact easily.
2. To develop a prototype as a supporting tool in order to support the proposed model and approach for verification of concept.
5
1.5 Scope of Work
Scope of work in this research includes the following:
1. A specific focus on change impact analysis approach using visualization method that could enhance program understanding and trace potential impact. 2. For program understanding focus is made on object-oriented programming. 3. The software only applies to C++ programming language and UML class
diagram.
4. The research is limited to small legacy system only.
1.6 Importance of the Study
Many studies were done to investigate the proportional software maintenance cost, in other words, the cost ratio of new development versus maintenance. The total cost of system maintenance is estimated to comprise at least 50% of total life cycle costs (Niessink and Van Vliet, 2000). Hence, to solve this problem, the developer team needs to study a mechanism or model that could analyze change impact to trace potential impact using visualization method to support program understanding. There are some benefits when using CIA approach using visualization method (Lee, 1998):
1. To help the maintenance team to enhance their program understanding in source code program.
2. To help the maintenance team to identify software work products affected by software changes easily via diagram. Such analysis not only permits evaluation of the consequences of planned changes, but it also allows trade-offs between suggested software change approaches to be considered.
6
4. Can be used for planning changes, making changes, accommodating certain types of software changes, and tracing through the effects of changes.
5. Can be used as a measure of the cost of a change. The more the change causes other changes, the higher the cost is. Carrying out this analysis before a change is made will allow an assessment of the cost of the change and help management choose tradeoffs between alternative changes. It also allows managers and engineers to evaluate the appropriateness of a proposed modification. If a change that is proposed has the possibility of impacting large, disjoint sections of a program, the change might need to be re-examined to determine whether a safer change is possible.
6. Can be used to drive regression testing, i.e., to determine the parts of a program that need to be re-tested after a change is made. Regression test is a software maintenance activity that refers to any repetition of tests (usually after software or data changes) intended to show that the software’s behaviour is unchanged except as required by the change to the software or data. To save work load, regression testing should retest only those parts that are impacted by the changes.
7. Can also be used to indicate the vulnerability of critical sections of code. If a procedure that provides critical functionality is dependent on many different parts of a program, its functionality was susceptible to changes made in these parts.
1.7 Thesis Outline
7
Chapter 2: It discusses the literature review of software maintenance, change impact analysis and visualization methods. A few areas of interest are identified from which all the related issues, works and approaches are highlighted. This chapter also discusses some techniques of visualization method. The discussion on some existing tools that exist in the industry is also included in this chapter. This leads to the improvement opportunities that form a basis to develop newly proposed software of change impact analysis approach by using visualization method.
Chapter 3: It provides a research methodology that describes the research design and formulation of research problems and validation considerations. This chapter leads to an overview of data gathering and analysis. It is followed by research assumptions.
Chapter 4: This chapter discusses the detailed model of the proposed change impact analysis approach using visualization method. A set of relationship and visualization models are described. It is followed by some approaches and mechanisms to achieve the model specifications.
Chapter 5: It presents the design and functionality of some developed tools to support the software change impact analysis approach using visualization method. This includes the implementation of the design and component tools.
8
Chapter 7: The description on research achievements, contributions and conclusion of the thesis are presented in this chapter. This is followed by the research limitations and suggestions for future work.
1.8 Summary