Article
1
Genetic Optimization Algorithm for Metabolic
2
Engineering Revisited
3
Tobias B. Alter 1, Lars M. Blank 2 and Birgitta E. Ebert *
4
Institute of Applied Microbiology – iAMB, Aachen Biology and Biotechnology – ABBt, RWTH Aachen
5
University, Worringerweg 1, 52074 Aachen
6
7
8
9
* Correspondence: [email protected]; Tel.: +49 241 80 266 48
10
11
Abstract:
12
To date, several independent methods and algorithms exist exploiting constraint-based
13
stoichiometric models to find metabolic engineering strategies that optimize microbial production
14
performance. Optimization procedures based on metaheuristics facilitate a straightforward adaption
15
and expansion of engineering objectives as well as fitness functions, while being particularly suited
16
for solving problems of high complexity. With the increasing interest in multi-scale models and a
17
need for solving advanced engineering problems, we strive to advance genetic algorithms, which
18
stand out due to their intuitive optimization principles and proven usefulness in this field of research.
19
A drawback of genetic algorithms is that premature convergence to sub-optimal solutions easily
20
occurs if the optimization parameters are not adapted to the specific problem. Here, we conducted
21
comprehensive parameter sensitivity analyses to study their impact on finding optimal strain
22
designs. We further demonstrate the capability of genetic algorithms to simultaneously handle (i)
23
multiple, non-linear engineering objectives, (ii) the identification of gene target-sets according to
24
logical gene-protein-reaction associations, (iii) minimization of the number of network perturbations,
25
and (iv) the insertion of non-native reactions, while employing genome-scale metabolic models. This
26
framework adds a level of sophistication in terms of strain design robustness, which is exemplarily
27
tested on succinate overproduction in Escherichia coli.
28
Keywords: metabolic strain design; heuristic optimization; constraint-based modeling
29
30
1.Introduction
31
Metabolic Engineering aims to enable the production of pharmaceuticals, fine chemicals, and
32
fuels by microbial cell factories and strives to maximize productivity and profits [1]. In the last 30
33
years, advances in DNA sequencing and systems analytical technologies have led to an immense
34
expansion of integrated knowledge about genetics, biochemical metabolic pathways and their
35
regulation and enabled researches to specifically understand and manipulate microbial
36
metabolism [2].
37
From the sheer metabolic and regulatory network complexity a key problem of metabolic
38
engineering approaches falls into place: How to intervene in those biochemical networks to reach or
39
approach an engineering aim with a reasonable investment of time, money, and materials? The use
40
of computational models of metabolism seek to answer this and related questions by facilitating the
41
integration of biochemical knowledge and OMICS data. Techniques such as flux balance analysis [3],
42
elementary modes analysis [4] or flux variability analysis [5] help to explain metabolic properties and
43
to predict the effect of genetic perturbations on microbial metabolism. By incorporating routines,
44
which systematically search for intervention sets that yield a desired phenotype (e.g., target product
45
yield), a panoply of variants of these computational methods has emerged [6] to support metabolic
46
engineers to most effectively interpret the information content of metabolic models.
47
The search for an optimal genetic intervention set poses a nested, bilevel optimization problem.
48
The outer problem optimizes an engineering objective by varying the network structure through gene
49
knockouts, knockdowns or overexpressions. The inner problem returns the microbial phenotype for
50
a given intervention strategy based on a cellular objective, from which the outer objective function is
51
evaluated. By exploiting basic theorems of linear algebra, such bilevel problems are transformed into
52
single-level mixed-integer linear or quadratic programming problems and solved using powerful
53
mathematical programming algorithms [7–11]. The usefulness of these frameworks in aiding
54
metabolic engineering projects has been demonstrated for various microbial strains and target
55
compounds [12–16], but still, practical applications lag behind the vast efforts put into theoretical
56
studies.
57
Solving bilevel optimization problems using exact techniques bears two major drawbacks.
58
Firstly, the necessary mathematical transformations increase the complexity of the problem
59
formulation, thus limiting the tractable number of simultaneous interventions per simulation. More
60
importantly, only linear constraints and objective functions can be used in these frameworks, which
61
may not be appropriate for representing biological objectives [6].
62
The application of metaheuristics as search routines circumvents the complexity and
63
formulation problems of exact solving techniques. Evolutionary or genetic programming is one
64
prominent example among metaheuristic methods, which adopts the principles of biological
65
evolution for finding (near-)optimal solutions to optimization problems. The genetic algorithm (GA)
66
evolves an optimal genetic intervention set for a given metabolic engineering objective by a
67
systematic and repeated selection, crossover and mutation of a population of solutions [17–19]. Such
68
a search heuristic allows for an efficient integration of any complex prediction method for microbial
69
mutant phenotypes, such as Minimization of Metabolic Adjustment (MOMA) [20], as well as the
70
consideration of sophisticated, non-linear engineering objectives as fitness functions. By applying,
71
e.g., OptGene, theoretical studies [21–23] but also practical implementations of identified genetic
72
intervention strategies [24–27] have proven the benefits of GAs for the identification of
73
overproduction strain designs.
74
In this work, we sought to intensify the knowledge of the behavior and performance
75
capabilities of GAs for metabolic engineering approaches with regard to future considerations of
76
models, constraints and engineering as well as biological objectives of growing complexity. A variety
77
of metaheuristics as optimization algorithms have already been applied for the computation of
78
metabolic engineering strategies [28–31]. We chose to apply GA for microbial strain design purposes
79
because of its intuitive optimization principles and already proven usefulness in this field of research.
80
Due to the nontransferable behaviors of GAs among different optimization problem classes [32], we
81
first explored the dependencies between the optimization parameters of GAs and classical
model-82
based metabolic engineering problems. To this end, we conducted sensitivity analyses for the
83
mutation rate, population size, number of generations, etc. while focusing on the ability to converge
84
to optimal strain design solutions for, e.g., succinate overproduction in Escherichia coli. We
85
particularly examined the importance of the duality between diversification and intensification (also
86
known as exploration and exploitation) of solution candidates for circumventing premature
87
convergence. Secondly, we demonstrated and eventually expanded the GA’s versatility. We included
88
the simultaneous evaluation of multiple cellular objective functions to derive pareto-optimal, robust
89
strain designs. Inspired by the OptStrain framework [8], we additionally implemented a routine to
90
insert novel network edges taken from a preprocessed pool of candidate reactions at runtime.
91
Moreover, a strategy was derived and implemented to simultaneously minimize the number of
92
interventions (e.g., gene deletions) while optimizing for the chosen engineering objective.
93
In summary, we intensified the knowledge of the behavior and performance capabilities of GAs
94
for metabolic engineering approaches and, beyond that, integrated previously independent design
95
metabolic models demanding high computing power [33], as well as the need to solve engineering
97
problems of growing complexities.
98
2.Materials and Methods
99
2.1 A Basic Genetic Algorithm for Metabolic Engineering
100
The GA is a randomized but directed search and optimization method modeled by the principles
101
of natural selection. It iteratively evolves a set or population of solutions (a solution will be referred
102
to as an individual) to an optimization problem, i.e., towards better solutions and to, eventually,
103
converge at optimality. According to Srinivas and Patnaik [34], the key characteristics of a GA are:
104
105
1. A genetic representation of solutions. Here, we employ a binary coding.
106
2. Populations of individuals as evolutionary communities.
107
3. A fitness function for evaluating the goodness of individuals.
108
4. Operators, which generate a new population from an existing one and which can be
109
controlled by parameters that shape the fitness-related or random transformation
110
behavior.
111
112
113
These characteristics have already been shown to be advantageous for in silico metabolic
114
engineering approaches in finding a set of reaction knockouts, which optimizes overproduction
115
[17,19,23]. Therefore, we implemented a GA using the basic structure of the OptGene framework [17]
116
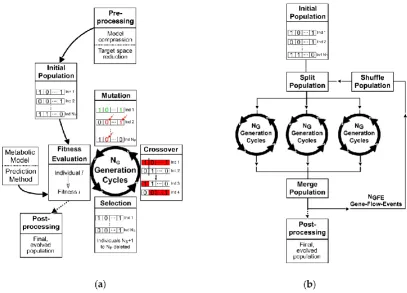
as well as the descriptions of Haupt and Haupt [35] as a starting point. The principle scheme of the
117
GA is sketched in Figure 1 including the selection, mating, mutation, and fitness evaluation operator
118
constituting the core GA, as well as a pre- and post-processing routine. Successive application of each
119
GA operator to a population will be called a generation in the following.
120
121
122
2.1.1 Population of Binary Individuals
123
In terms of a strain design problem, an individual represents a set of reaction or gene deletions.
124
Following characteristic (1), each target within a set is encoded by a binary number, in the following
125
called a gene, with a uniform bit-length 𝑁𝐵. An individual comprising 𝑁𝐷 interventions (e.g.,
126
reaction deletions) thus consists of 𝑁𝐵∙ 𝑁𝐷 bits. To avoid a biased representation of the target space
127
when distributing 𝑁𝑇 targets to 2𝑁𝐵 binary values, with 𝑁𝑇 < 2𝑁𝐵, we chose bit-lengths such that
128
each target is represented by 50 or 51 binary values. The number of bits were calculated using
129
Equation 1:
130
𝑁𝐵= Round (log(50∙𝑁log(2)𝑇)). (1)
Consequently, the maximal difference in the probability of drawing two independent targets is less
131
than 2 %. Using this specific binary representation, a maximal, user-defined number of targets per
132
individual is guaranteed. At the start of the GA, a population of 𝑁𝑃 individuals, each consisting of
133
𝐾 binary numbers of size 𝑁𝐵, is initialized. The initial state of each bit within the population is
134
selected randomly.
135
2.1.2 The Fitness Function
136
The fitness or goodness 𝐹 of individuals quantifies to which extent metabolic network
137
perturbations facilitate overproduction of a target molecule or, in general, comply with the
138
engineering objective. As an engineering objective, we chose the Biomass-Product Coupled Yield
139
(BPCY), which is calculated by
140
𝐵𝑃𝐶𝑌 =𝑣𝑃∙𝜇
𝑣𝑆, (2)
where 𝜇 depicts the growth rate, 𝑣𝑃 and 𝑣𝑆 are the product formation and substrate uptake rate,
141
respectively. The three parameters in Equation 2 are calculated using the Minimization of Metabolite
142
Balances (MiMBl) method [36], which may be considered as an adaption of the Minimization of
143
Metabolic Adjustment (MOMA) algorithm [20]. The application of MiMBl requires the input of a
144
reference or wild-type flux distribution to derive deletion mutant phenotypes. Since this work solely
145
focused on E. coli, we obtained our reference state from the experimental results of Ishii et al. [37]. For
146
more detailed descriptions we refer to Supplementary I.1.
147
2.1.3 Selection, Mating and Crossover
148
As a first step in a generation, the best 𝑁𝑆 individuals are selected for mating according to their
149
fitness, whereas all other 𝑁𝑃− 𝑁𝑆 of the 𝑁𝑃 individuals in the population are deleted. 𝑁𝑆 is
150
calculated by
151
𝑁𝑆= 𝑁𝑃∙ 𝑋, (3)
with 𝑋 being the user-defined selection rate ranging between 0 and 1.
152
The mating pairs for crossover are assembled using a roulette wheel weighting approach by
153
drawing a random number. Since two offspring are generated by crossover of two mated individuals
154
and the parent individuals are kept, 𝑁𝑃− 𝑁𝑆⁄2 mating pairs are sampled to fill-up the population.
155
Avoidance of two identical mating pairs is set as a criterion for exclusion during sampling. The
156
probability 𝑃𝑖 with which an individual 𝑖 from the pool of 𝑁𝑆 selected individuals is chosen to mate
157
is deduced from Equation 4:
158
𝑃𝑖= 𝐹𝑖
∗
∑𝑁𝑆𝑖 𝐹𝑖∗, (4)
with
159
where 𝐹𝑖 is additionally normalized by the fitness 𝐹𝑅 of the best discarded individual. However, if
160
one or more selected individuals exhibit zero fitness, a minimal probability 𝑃𝑚𝑖𝑛 > 0 for each
161
individual 𝑖 is guaranteed by scaling 𝐹𝑖 according to Equation 6:
162
𝐹𝑖∗= 𝐹𝑖+
𝑃𝑚𝑖𝑛∙ ∑ 𝐹𝑁𝑖𝑆 𝑖
1 − 𝑃𝑚𝑖𝑛∙ 𝑁𝑆
(6)
If not noted otherwise, 𝑃𝑚𝑖𝑛= 0.1 ∙ 𝑁𝑆.
163
Crossover is initialized by a random selection of a crossover point or kinetochore for each mating
164
pair. Kinetochores are restricted to positions in between two neighboring genes. The genes left of the
165
kinetochore of the first parent are merged with those to the right of the kinetochore of the second
166
parent to form the first offspring individual. The second offspring is created complementarily with
167
the remaining parent genes (Figure 1a).
168
2.1.4 Mutation and Elitism
169
The mutation operator randomly changes bits within the population comprising the offspring
170
and parent individuals. The probability with which a 1 is turned into a 0 or vice versa is set by the
171
user-defined mutation rate 𝑅. We additionally adapted the concept of elitism and hence, the best
172
parent individual is not mutated. After mutation, a new generation is propagated by calculating the
173
fitness of the novel individuals.
174
2.1.5 Parallelism
175
To exploit multi-core and multi-threading processor architectures, several independent
176
generation strands are processed in parallel (Figure 1b). Therefore, an initial population is randomly
177
split into 𝑁𝐶 subpopulations of equal size. Each sub-population is passed to a separate thread and
178
undergoes independent evolution following sections 2.1.3 and 2.1.4. After 𝑁𝐺 generations, the final
179
subpopulations of the generation strands are merged, and the population is randomly divided to the
180
available threads, which we will refer to as a Gene Flow Event (GFE). After 𝑁𝐺𝐹𝐸 GFEs, the GA is
181
terminated resulting in a final population of 𝑁𝑃 evolved individuals.
182
2.2 Adaptive Probabilities of Mutation
183
We implemented a strategy to adapt the mutation rate for each individual at runtime following
184
the work of Srinivas and Patnaik [34]. The mutation rate is made dependent on the relative fitness
185
value of an individual as well as the diversity of its population and is calculated by
186
𝑋𝑖=𝐹𝐹𝑚𝑎𝑥−𝐹𝑖
𝑚𝑎𝑥−𝐹′(𝑋𝑚𝑎𝑥− 𝑋𝑚𝑖𝑛) + 𝑋𝑚𝑖𝑛, (7)
with 𝐹𝑚𝑎𝑥 being the fitness of the best individual within the population and 𝐹′, the population’s
187
mean fitness. Equation 7 ensures that 𝑋𝑖 ranges between a pre-defined minimal and maximal
188
mutation rate 𝑋𝑚𝑖𝑛 and 𝑋𝑚𝑎𝑥.
189
2.3 Additional Features
190
2.3.1 Gene Deletion Targets
191
To make use of the complex Gene-Protein-Reaction (GPR) associations inherent to many
192
metabolic models, we enabled the possibility of computing gene rather than reaction deletion
target-193
sets. Because any fitness function evaluation employing metabolic models demands the specification
194
of reaction network perturbations, we implemented a routine, which translates simultaneous gene
195
deletions to reaction deletions according to the logic operations given by the GPRs.
196
2.3.2 Multi-objective Optimization
197
To simultaneously optimize multiple engineering objective functions, the fitness function was
198
accounts for a linear combination of the production rate at maximal growth, the Growth Coupling
200
Strength (GCS) and, as explained in section 2.1.2, the BPCY. Each objective function value is
201
normalized by their maximum to ensure uniform value ranges between 0 and 1. Additional,
202
independent weighting factors can be applied to each objective function but were neglected in this
203
work. However, in contrast to the descriptions of Alter et al. [39], the calculation of the GCS was
204
simplified to reduce the computational burden while guaranteeing a meaningful approximation of
205
the GCS measure (cf. Supplementary I.2) .
206
2.3.3 Minimization of Perturbations
207
We incorporated a fitness transformation routine to facilitate the minimization of simultaneous,
208
genetic perturbations while evolving overproduction individuals. Particularly, the fitness 𝐹𝑖 of an
209
individual 𝑖 (here referred to as the objective fitness), which stems from the evaluation of the cellular
210
objective function, is scaled by the number of unique reaction or gene deletions 𝐼𝑖 of i according to
211
Equation 8:
212
𝐹̂𝑖= 𝐹𝑖+ 𝐹𝑖∙ 𝑦 ∙ (𝐼𝑚𝑎𝑥− 𝐼𝑖), (8)
where 𝐹̂𝑖 is the scaled fitness and 𝐼𝑚𝑎𝑥 denotes the maximal possible number of unique
213
perturbations per individual. To control the trade-off between the reduction of simultaneous genetic
214
interventions and the maximization of target product yield we introduced the fitness-intervention
215
size relation factor 𝑦, whereby 𝑦 ≥ 0. By increasing 𝑦, the optimization objective is shifted towards
216
minimal perturbation sizes while the objective fitness becomes subordinated.
217
2.3.4 Non-native Network Edge Insertions
218
Inspired by the OptStrain and SimOptStrain frameworks [8,11], we expanded the basic GA to
219
identify non-native reaction insertions while simultaneously searching for a set of reaction or gene
220
deletions, which, in combination maximize overproduction. We particularly focused on novel
221
network edges and, hence confined the set of possible insertion targets to reactions that act on
222
metabolites inherent to the wildtype model only. Respective candidate reactions were derived and
223
curated by consulting the MetaNetX [40], BiGG [41], eQuilibrator [42], and KEGG [43] database to
224
create a databank model providing a repertoire of possible novel functionalities to the GA (cf.
225
Supplementary I.3).
226
2.4 Analysis of the Evolution of Populations
227
2.4.1 A Measure of Population Diversity: The Hamming Distance
228
The average Hamming distance between pairs of individuals can be used to quantify the
229
diversity of a population, which aids in investigating the time convergence of GAs [34,44]. The
230
Hamming distance counts the number of differing bits in two individuals, hence, for 𝑁𝑃𝑎=
231
𝑁𝑃
2 (𝑁𝑃− 1) possible pairs of individuals a population’s average Hamming distance is calculated by:
232
𝐻𝐷 =∑ ∑ |𝐵𝑗
𝑖1− 𝐵 𝑗𝑖2| 𝑁𝐵
𝑗 𝑁𝑃𝑎
𝑖
𝑁𝑃𝑎∙ 𝐻𝐷𝑚𝑎𝑥 ,
(9)
with 𝐵𝑗𝑖1 being the jth bit of the first individual of the ith pair in the population. Additionally, HD is
233
normalized by the maximally possible Hamming distance between two individuals. Therefore, we
234
will generally use HD for the normalized, average Hamming distance in this work.
235
2.5 Metabolic Model Preprocessing
236
In this work, the E. coli K-12 MG1655 core [45] as well as the genome-scale reconstruction iJO1366
237
[46] were employed. Preceding any GA optimization, a model compression was conducted by
238
eliminating sink and source reactions, which consume or produce unbalanced metabolites. Therefore,
239
subsequently deleted. When gene deletion targets are considered, genes being connected by an AND
241
operator in the same GPRs were lumped. For example, genes encoding for sub-units that are found
242
in only one particular enzyme were considered as one gene.
243
Additionally, the deletion target space was reduced to minimize the complexity of the
244
optimization problem. Partly following the protocol of Feist et al. [21], reactions not associated to any
245
genes, such as spontaneous, diffusion and exchange reactions, were not considered as deletion
246
targets. Furthermore, all transport reactions as well as reactions being involved in cell envelope
247
biosynthesis, membrane lipid metabolism, murein biosynthesis, tRNA charging and
248
glycerophospholipid metabolism were removed from the target space.
249
2.6 General Conduct for the Application of the Genetic Algorithm
250
All simulations employing the E. coli core and the genome-scale iJO1366 model were replicated
251
five and three times, respectively. All data shown is an average of the replicates and given errors
252
denote the correspondent standard deviation. The GA was implemented in Matlab 2016b (The
253
Mathworks, Inc., Natick, MA, USA) and is freely available on GitHub
254
(https://github.com/Spherotob/GAMO_public). All computations and the evaluation of the results
255
were conducted on a Windows 7 machine with 16 GB of RAM and an AMD FX-8350 Eight-Core (à
256
4.00 GHz) processor.
257
3.Results
258
3.1 GA Parameter Sensitivity Analysis
259
The performance of GAs on arbitrary optimization problems is strongly dependent on the GA
260
parameters and a sound setting is generally hard to predict. It is thus advisable to conduct a thorough
261
parameter sensitivity analysis for a specific problem class to derive the most advantageous parameter
262
ranges. Therefore, we performed a parameter sensitivity analysis for a basic GA (cf. Section 2.1) on
263
strain design problems using the E. coli core metabolic reconstruction. For an overview of the used
264
GA parameters for each conducted simulation in this work and the obtained best intervention
265
strategies we refer to the Supplementary File 4 and 5.
266
3.1.1 Mutation Rate
267
The arbitrary mutation of individuals is a central operator of GAs driving the exploration of the
268
solution space for globally optimal solutions. At low mutation rates, the search of GAs is narrowed
269
to the local surroundings of a population’s individuals, which is likely to lead to premature
270
convergence. On the contrary, too high mutation rates diminish the fitness intensification in the local
271
area of a population and thus convert GAs into random search methods, which results in low
272
convergence speeds. This is illustrated by the maximal fitness and the Hamming distance trends
273
when optimizing for succinate biomass-product coupled yield (BPCY) using a basic GA at different
274
mutation rates (Figure 2). Evolution of individuals stopped at a relatively low, suboptimal fitness
275
value after approximately 40 generations for low mutation rates up to 0.001 due to a vanishing
276
population diversity. Contrarily, at elevated mutation rates above 0.3, the convergence to optimal
277
fitness values was slow and the diversity remained at high levels without exhibiting any indications
278
of intensification. A mutation rate of 0.05 exhibited an advantageous compromise between
279
exploration and intensification of the target space and thus led to the highest convergence rates. As
280
shown in Figure 3, fast convergence correlated with low numbers of fitness function evaluations
281
needed to reach maximal fitness and, thus, to low computational costs. Mutation rates below 0.01
282
exhibited the lowest computational costs but impeded finding the optimal solution with a fitness of
283
0.46 𝑚𝑜𝑙 𝑚𝑜𝑙−1 ℎ−1. If not stated otherwise, we used a mutation rate of 0.05 in all further simulations
284
to reasonably limit the number of fitness function evaluations during GA runs while avoiding a
285
Fixing the mutation rate during GA runs was previously shown to be superior to variable, adaptive
287
mutation probabilities [34]. However, in contrast to the findings of Srinivas & Patnaik [34], in our
288
simulations, adaptive probabilities generally led to a decrease in convergence speed using ethanol
289
BPCY as engineering objective (Supplementary Figure S1). For five, seven, and ten maximal reaction
290
deletions, we applied different ranges between the minimally and maximally allowable mutation
291
rate, each centering around a mutation rate of 0.05. Intensification of solutions was more and more
292
hampered for increasing range widths, most notable by means of static Hamming distance
293
progressions at high levels (Supplementary Figure S1). Hence, the promising concept of adaptive
294
mutation probabilities might be dismissed for strain design applications.
295
Figure 2: Maximal fitness (a) and hamming distance (b) across the populations of every thread in each generation using mutation rates between 0 and 0.7. Deletion of maximally five reactions were allowed while using succinate BPCY as the engineering objective. Hamming distance progressions for mutation rates 0.5 and 0.7 overlap each other.
296
3.1.2 Selection rate and Population Size
297
The selection rate and population size determine how many of the fittest individuals are being
298
selected to the mating pool for breeding new and eventually superior offspring individuals.
299
Therefore, both parameters jointly influence the local search behavior of GAs in the vicinity of a
300
population induced by the crossover operator. To assess this influence in terms of convergence
301
characteristics and computational cost minimization, we performed GA runs with varying selection
302
rates and population sizes using succinate BPCY as the engineering objective and limiting the
303
intervention size to seven reaction deletions. For each tested selection rate – population size pair, the
304
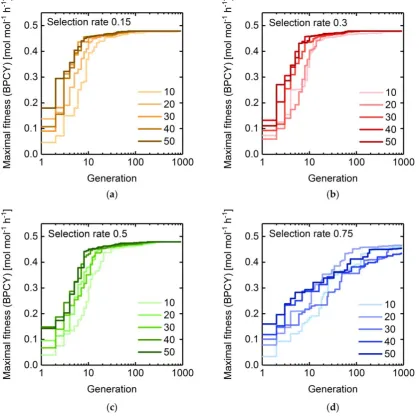
progression of the maximal fitness is shown in Error! Reference source not found.4.
305
GA runs employing high selection rates of 0.75 exhibited the slowest convergence towards the
306
maximal observed fitness of 0.48 𝑚𝑜𝑙 𝑚𝑜𝑙−1 ℎ−1, irrespective of the chosen population size. No
307
significant difference in the convergence behavior was observed between the lower selection rates of
308
0.15, 0.3, and 0.5. For specific selection rates, an increase of the population size up to 30 generally led
309
to a faster convergence. However, significant differences became apparent in the computing time
310
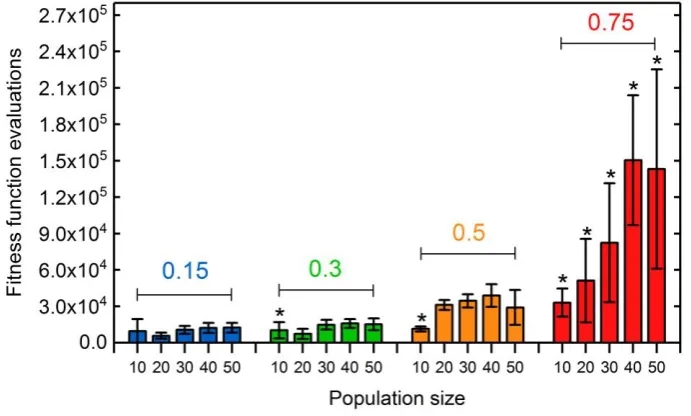
necessary to reach maximal fitness values (Figure 5). With increasing selection rates, more fitness
311
function evaluations were required to reach the GA run specific maximal fitness. For a selection rate
312
of 0.75, this maximal fitness did not coincide with the global maximum for any tested population size.
313
When applying lower selection rates, non-global optima were only exhibited at a low population size
314
of 10. Thus, a certain number of novel offspring individuals being generated at any generation had
315
to be exceeded to provide a sufficient combinatoric for the crossover operator to effectively contribute
316
to finding better individuals. Population sizes above 30 did not seem to significantly alter the
317
computational cost to reach the global maximal fitness but led to increased overall computing times
318
and costs for a fixed number of generations (Supplementary Figure S2). Hence, for the following GA
319
runs we chose a rather low population size of 20 at a selection rate of 0.25 to assure fast convergence
320
characteristics while minimizing the computational burden.
321
322
Figure 5. Number of fitness function evaluations until maximal final fitness was reached for GA runs
323
applying population sizes between 10 and 50. Bars are clustered according to the employed selection
324
rate (colored number). Error bars show the standard deviation among five replicates for each
325
population size – selection rate pair. Asterisks denote parameter pairs with which the globally
326
maximal fitness of 0.48 𝑚𝑜𝑙 𝑚𝑜𝑙−1 ℎ−1 was not reached in every replicate GA run after 900
327
generations. Succinate BPCY was used as the engineering objective. Intervention set size was seven.
328
3.1.3 Parallelization: Numbers of Generations, Gene-Flow Events and Threads
329
With the parallel implementation of the GA, populations are evenly split into sub-populations,
330
which are assigned to multiple separate processing units or workers and evolved independently from
331
each other (Section 2.1.5). After a specified number of generations, the latest sub-populations are
332
pooled and eventually randomly allocated again to the workers to repeat the process. Such
Gene-333
Flow Events (GFEs) allow for an additional mechanism to diversify populations and promote
334
evolution towards globally optimal solutions [35].
335
Generally, parallelization of generation sequences and fitness function evaluations is applied to
336
cut computation time, particularly when dealing with costly fitness functions [35]. GA runs using one
337
to seven threads and searching for seven reaction deletions while applying succinate BPCY as the
338
engineering objective showed similarly decreasing generation numbers and computation times
339
necessary to reach the maximal fitness with increasing number of threads (Figure 6). This raises the
340
number of GFEs influence the GA’s performance. We tested the influence of GFEs on the
342
performance of the GA by varying the generation size between two GFEs and the number of GFEs
343
itself while keeping the total number of generations constant. Surprisingly, the progressions of
344
maximal fitness at each generation suggest that changing the distribution between generation size
345
and number of GFEs has no significant effect on the convergence behavior (Supplementary
346
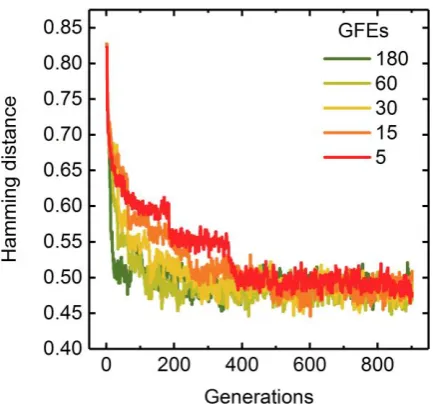
Figure S3). According to
347
the Hamming distance on the other hand, population diversities diminished more slowly when less
348
GFEs were conducted in favor of higher generation sizes (Figure 7).
349
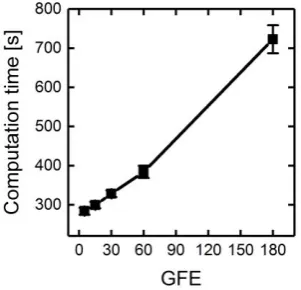
However, the absolute computation time for the overall 900 generations is gradually reduced
350
when decreasing the number of GFEs (Figure 8). This is mainly due to savings in overhead
351
Figure 6. Number of generations (squares) and computation time (triangles) until maximal fitness was reached. Deletion of maximally seven reactions were allowed. Succinate BPCY was used as the engineering objective. Error bars denote the standard deviation of five replicate GA runs using one, three, five and seven parallel threads.
computations spent on merging or splitting populations, initialization of parallel loops and
352
distribution of data to different workers. To minimize absolute computation times and ensure
353
appropriate population diversities throughout GA runs, we chose a generation size of 60 for the
354
following simulations. The total number of generations was thus controlled by the number of GFEs.
355
3.2 Target Product Varieties and Minimal Intervention Set Sizes
356
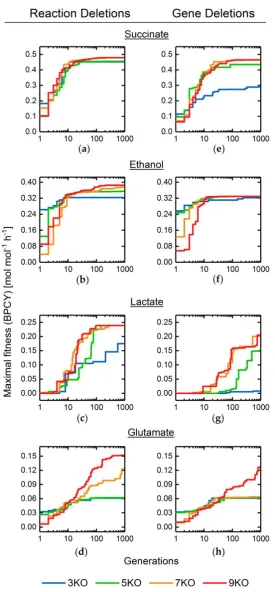
We used the basic GA and the optimized GA parameter set to determine strain designs for the
357
overproduction of succinate, ethanol, lactate, and glutamate allowing maximum reaction or gene
358
deletions between three and nine (Figure 9). Independent of the target product, the fitness for gene
359
deletion target-sets generally converged to lower values compared with reaction target-set solutions
360
of the same size. In all cases, the approach of the convergence region for the maximal fitness coincided
361
with the convergence of the Hamming distance, hence the population diversity (cf. Supplementary
362
Figures S4 and S5).
363
Interestingly, the final fitness for five, seven, and nine reaction or gene deletions was the same
364
or in the near range for all products. Hence, individuals representing a high, fixed intervention set
365
size likely included one or more deletions, which did not contribute to the engineering objective. This
366
is explained by our formulation of an individual (cf. Section 2.1.1), which allowed for multiple
367
occurrences of the same target, further enforced by scaling the fitness with the number of unique
368
targets within an individual (cf. Section 2.3.3). Accordingly, computed solutions needed to be
369
postprocessed to extract the unique targets and actual number of deletions.
370
We exemplarily applied the intervention set minimization approach to ethanol overproduction
371
using different instances of the fitness-intervention size relation factor 𝑦. By increasing 𝑦 we were
372
able to gradually concentrate on solutions with lower numbers of unique reaction deletions
373
(Figure 10a). However, minimization of intervention sizes came at the expense of lowered objective
374
fitness values and thus of lower ethanol overproduction capabilities (Figure 1010b). For example,
375
applying a 𝑦 of 0.04 promoted quadruple deletion individuals as optimal solutions, whereas a lower
376
𝑦 of 0.025 favored individuals with six unique reaction deletions. According to the Hamming
377
distance and maximal fitness progressions (Supplementary Figure S6), convergence speed decreased
378
with increasing fitness-intervention size relation factor, hence indicating that enforcement of the
379
elimination of non-contributing deletion targets elevated the problem complexity.
380
3.3 Multi-Objective Fitness Function Optimization
381
To focus on the robustness of strain designs, we combined laboratory evolution-based objectives,
382
namely gcOpt and OptKnock, as well as BPCY as a non-laboratory evolution objective, in one fitness
383
384
Figure 10. Progressions of the intervention size of the fittest individual throughout the GA runs are shown in (a). Dots illustrate the mean intervention size over a population at a specific generation. The lines represent the corresponding linear interpolations. Subfigure (b) shows the final objective fitness for GA runs using different instances of 𝑦.
385
function and identified reaction deletion strategies for the maximization of succinate, ethanol, lactate
386
and glutamate production. A “perfect” solution would therefore guarantee a high minimal yield at
387
any growth state while predicting an optimal compromise between growth and target synthesis rates
388
for the deletion mutant.
389
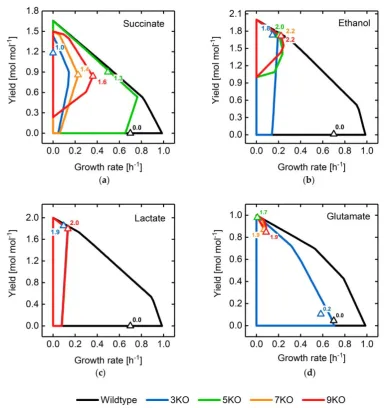
Figure 11 shows the yield spaces of GA-optimized reaction deletion mutants with succinate,
390
ethanol, lactate and glutamate as target products while employing the multi-objective fitness function
391
approach and maximal intervention set sizes between three and nine. Yields and growth rates for
392
each mutant predicted by MiMBl are additionally illustrated. Particularly for succinate, ethanol, and
393
glutamate, solutions were identified for which both a strong product-growth coupling and a favorable
394
compromise between yield and growth were predicted. The latter also holds for lactate as a target,
395
but production robustness, in terms of a guaranteed yield at any growth state, was comparably low.
396
Among the investigated target products, convergence characteristics of the population diversity
397
were comparable for the same maximal allowable intervention set size (cf. Supplementary Figure S7).
398
Moreover, they also matched the characteristics of simulations for which only the target product
399
BPCY was used as the engineering objective.
400
3.4 Heterologous Reaction Insertion
401
Besides the mere intersection of metabolic networks, simultaneous addition of non-native
402
functionalities has been shown to further improve overproduction capabilities [11]. Using a curated
403
databank model for the E. coli core model including novel heterologous reactions (cf. Supplementary
404
File 2), we tested the GA’s capability to identify advantageous combinations of reaction deletions and
405
additions for the overproduction of succinate, glutamate, lactate and ethanol. However, we refrained
406
from introducing whole new pathways and metabolites to the wildtype organism and limited
407
network extensions to insertions of novel network edges to, in context of this work, focus on the mere
408
feasibility of integrating heterologous reaction insertions into a genetic algorithm.
409
For all four target products, the GA was able to further improve the BPCY by adding between
410
the case of succinate, replacement of the NAD+-dependent glyceraldehyde-3-phosphate
412
dehydrogenase with its NADP+-dependent, phosphorylating counterpart (EC 1.2.1.13) and addition
413
of an ATP-dependent citrate lyase (EC 2.3.3.8) frequently occurred in the best individuals.
414
Simultaneously, formation of acetate and ethanol were inhibited as well as the malic enzyme knocked
415
out, altogether enforcing metabolic flux through the glyoxylate shunt and the reductive branch of the
416
TCA cycle towards succinate. For the glycolytic product ethanol, switching from the NAD+
-417
dependent to the NADP+-dependent alcohol dehydrogenase (EC 1.1.1.2) and
glyceraldehyde-3-418
phosphate dehydrogenase (phosphorylating) as well as simultaneously deleting the NAD+
419
transhydrogenase led to the most promising strategies. Congruently, NADH/NADPH metabolism
420
was the preferred target for glutamate overproduction, which was spurred by the addition of the
421
NADP+-dependent glyceraldehyde-3-phosphate dehydrogenase (EC 1.2.1.9) as well as the knockout
422
of NAD+ transhydrogenase. The identified strain designs also suggested to increase flux through the
423
TCA cycle by heterologously expressing the citrate oxaloacetate-lyase (EC 4.1.3.6) to recycle acetate
424
to citrate. Interestingly, insertion of the latter in combination with expression of the non-native
425
NADP+-dependent glyceraldehyde-3-phosphate dehydrogenase and the deletion of various
426
NADH/NAD+-dependent reactions also improved lactate overproduction.
427
3.5 Increasing the Complexity and Predictive Power by Employing Genome-Scale Models
428
Genome-scale network reconstructions represent dense information sources of the current
429
knowledge about microbial metabolic functionalities. In combination with constraint-based
430
modeling approaches they can aid in thoroughly predicting the behavior of microbes and their
431
response to genetic perturbations [6]. The sheer size and complexity of genome-scale models (GEM),
432
however, drastically increase the computational burden for in silico strain design methods and
433
eventually render their application infeasible. GAs on the other hand are particularly suited for
434
handling costly fitness functions and are able to provide at least near-optimal solutions for large-scale
435
optimization problems [34,35].
436
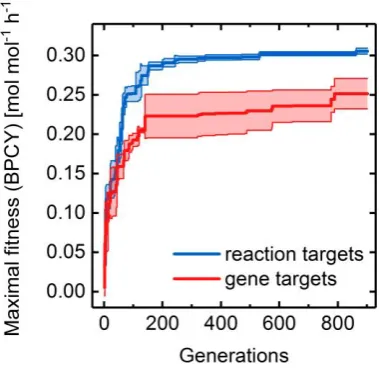
We applied the basic GA framework to identify quintuple gene and reaction deletion strategies
437
that maximize succinate production using the E. coli GEM iJO1366. Similar to the E. coli core model
438
(cf. Section 3.2), fitness converged slower and the final maximal fitness was lower when searching for
439
gene rather than reaction targets (Figure 13). In contrast, the maximally observed succinate BPCYs
440
Figure 12. Fitness of the best individual after 1800 generations. BPCY of succinate (a), ethanol (b), lactate (c) and glutamate (d) was used as the engineering objective while applying five reaction deletions as well as one to four novel reaction insertions. The grey bars illustrate the fitness of the best individual after 900 generations without considering any reaction additions (cf. Figure ).
decreased by 33% for reaction targets and 42% for gene targets, pointing to a potentially misleading
441
oversimplification of the metabolic repertoire in the E. coli core model for predicting exact mutant
442
phenotypes.
443
To exploit the full potential of the advanced GA, succinate overproducing strain designs were
444
identified applying a multiple objective fitness function while minimizing the intervention set size
445
using a y of 0.1. Figure 14 shows the yield spaces and predicted yields for four strain designs
446
comprising different numbers of gene deletions and reaction insertions (cf. Supplementary File 3 for
447
the non-native network edges of iJO1366). All strategies with five gene deletions shared a predicted
448
BPCY of 0.2 𝑚𝑜𝑙 𝑚𝑜𝑙−1 ℎ−1 compared to 0.3 𝑚𝑜𝑙 𝑚𝑜𝑙−1 ℎ−1 of the octuple deletion and double
449
insertion mutant. Both the octuple deletion and the quintuple deletion-only strain design exhibited a
450
slightly holistic growth-coupling, i.e., biomass yields above zero for all accessible growth states [39].
451
In contrast, the first showed a significant extension of the yield space up to a maximal growth rate of
452
1.7 ℎ−1, due to the additional insertion of the quinate dehydrogenase (EC 1.1.1.282) to the shikimate
453
pathway. This is the result of an elevated NADPH synthesis rate, which was similarly observed in
454
other, sub-optimal strain designs where, e.g., the NADP+-dependent glyceraldehyde-3-phosphate
455
dehydrogenase (EC 1.2.1.13) was inserted. However, insertion of novel functionalities did not
456
significantly improve succinate overproduction as compared to the deletion-only strain designs and
457
in case of the quintuple deletion mutants even showed lowered fitness values (Supplementary Figure
458
S8a). Presumably, novel network edges are not of critical concern for optimizing succinate production
459
in E. coli. Identification of significantly better strain design solutions at elevated generation
460
numbers is also unlikely, since the population diversities reached plateau regions indicating
461
approaching fitness convergence (Supplementary Figure S8b). Only for the octuple deletion and
462
double insertion case, a drop in the Hamming Distance approximately from generation 1600 onward
463
suggested incomplete convergence.
464
Interestingly, the final best strain designs always contained less perturbations as was maximally
465
possible, which is illustrated by the higher final fitness values compared to the objective fitness values
466
(Supplementary Figure S8a). For example, the search for overproduction mutants with five gene
467
deletions and one reaction insertion led to a triple instead of a quintuple deletion strain design being
468
a good compromise between the number of perturbations and objective fitness. Due to the
469
minimization of intervention size approach, the reduced intervention set size was favored at the
470
expense of a narrowed yield space in contrast to the full intervention potential.
471
One main overproduction principle, however, was the enforcement of flux through the
472
glyoxylate shunt by deleting the fumarase genes ΔfumA, ΔfumB, and ΔfumC. Moreover, an increase
473
of the anaplerotic phosphoenolpyruvate carboxylase reaction by a knockout of the NAD+-dependent
474
malate dehydrogenase (Δmdh) or pyruvate kinase (ΔpykA, ΔpykF) occurred frequently, presumably
475
due to the elevated recapture of carbon dioxide. For the complete strategies we refer to the
476
Supplementary.
477
4. Discussion
478
By simultaneously incorporating previously published as well as novel engineering approaches
479
into a basic GA framework, we could demonstrate the versatility and broad applicability of GAs for
480
solving strain design problems. Addition of novel reactions and functionalities, consideration of gene
481
as well as reaction deletions, application of multiple optimization objectives, and minimization of
482
necessary network perturbations proved to be simultaneously manageable by the GA. Such an
483
integrative approach allows for an increased level of robustness in terms of overproduction stability
484
and efficiency of mutant strain designs as well as the consideration of practicability of necessary
485
genetic interventions.
486
Of course, the capabilities to predict mutant phenotypes necessary to evaluate a solution’s fitness
487
is still mainly dictated by the chosen computational prediction methods, the completeness and
488
quality of the utilized model as well as the integrated data of the wildtype strain. Nevertheless, in the
489
light of ongoing refinements of purely stoichiometric models to enhance their predictive power by
490
introducing novel, kinetics-related protein or enzyme expression constraints [47,48] or whole gene
491
expression systems [33], GAs were shown to be able to handle the accompanied increase in model
492
and prediction method complexity in this work.
493
Moreover, solving of optimization problems using GAs supersede the need for cumbersome
494
mathematical reformulations. This is in contrast to bilevel programming problems, which have to be
495
transformed into single level problems by, e.g., exploiting the strong duality theorem [49]. Due to the
496
relatively straight forward implementation of GAs, biological and engineering objectives can be
497
readily adapted to specific questions, applications, and requirements. For example, metabolic
498
engineering projects strive to reach the best possible microbial productivities with minimal
499
laboratory effort, meaning a minimal number of genetic interventions. We addressed this
500
optimization (sub-)problem by simply adding a fitness transformation routine, which scales the
501
fitness of a solution by its intervention size. This enables the user to adjust the relation between the
502
benefit of saving genetic interventions and the sacrifice of potential overproduction capabilities to
503
eventually accelerate simulation and experimental iterations.
504
The performance of the GA is in any case strongly dependent on the balance between a broad
505
diversity in the genetic pool of consecutive populations and the focusing to the most fit solutions or
506
individuals. An exaggerated concentration on the local search characteristic of the GA, e.g., by
507
applying small mutation rates, led to premature convergence to non-optimal solutions, which became
508
apparent by a drastic drop in the population diversity. On the other hand, constantly high diversities
509
indicated strong exploration of the solution space but were accompanied by slow convergence rates
510
and a high computational effort necessary to identify optimal solutions. GA parameters were thus
511
identified by a parameter analysis to blend both exploration as well as intensification characteristics
512
and guarantee good optimization performances for any strain design problem. Thus, we reduced the
513
chance for premature convergence and simultaneously minimized the computing time. Above all,
514
the favorable convergence characteristics were not affected when we applied more complex
515
engineering objectives, such as a multi-objective fitness function.
516
Avoiding premature convergence is particularly important if, in future developments,
517
convergence may be detected at runtime to terminate the GA and output the optimal solution
518
instantaneously. A stagnation of the population diversity, which is quantified by the Hamming
519
converged to a global or a local optimum can hardly be decided and thus, premature convergence
521
needs to be circumvented in the first place. Therefore, slight promotion of the GA’s exploration
522
characteristics by careful parameter adaptions can be advantageous.
523
From a biological point of view, more in-depth considerations about the practicability and
524
robustness of potential strain designs were made possible implementing additional features for the
525
GA to set a trade-off between the number of genetic interventions and maximal fitness values or to
526
add non-native reactions.
527
In a previous study we claimed that strong growth-coupling is effectively generated by the
528
perturbation of cofactor balancing and ATP in particular [39], which, however, may be too
529
metabolically destructive. Congruently to those findings, strain designs identified in this work, which
530
strongly coupled succinate, ethanol or glutamate production to growth, incorporated, among others,
531
the knockout of the ATP synthase, thus shifted the ATP supply to the substrate phosphorylation level.
532
Simultaneously, high BPCYs were predicted for these strain designs strengthening the applicability
533
of such ATP restricting engineering approaches to gain robust overproduction strains.
534
The addition of novel metabolic reactions taken from a model databank generally targeted the
535
cofactor and particularly the NADH/NADPH metabolism, besides the inhibition of byproduct
536
formation. A common strategy was to replace NAD+-dependent reactions with their NADP+
-537
dependent counterparts, while simultaneously deleting the NADH dehydrogenase, NAD+
538
transhydrogenase or other NADH-dependent reactions, as was also previously suggested for
539
succinate overproduction by Kim et al. [11] based on their findings employing SimOptStrain.
540
However, by exploiting the E. coli iJO1366 GEM and the full capacity of the GA’s features, we
541
identified a rather different strain design compared to other theoretical or experimental studies.
542
Whereas it has been frequently suggested to directly suppress byproduct formation, e.g., by knocking
543
out ackA, ldhA or pfl [50], the GA framework applying an E. coli GEM predicted a redirection of the
544
TCA cycle flux towards the glyoxylate shunt to be most beneficial for succinate production.
545
Moreover, and in line with results from the core metabolic model, reduction of NADH generation in
546
favor of NADPH appeared to be a key design principle. This was pronounced by the suggestion to
547
include the non-native NADP+-dependent glyceraldehyde-3-phosphate dehydrogenase or quinate
548
dehydrogenase, which significantly improved theoretical maximal growth. Since these novel design
549
suggestions resulted from the simultaneous application of various engineering objectives, a
550
comprehensive metabolic model, and the consideration of actual gene-protein dependencies as well
551
as detailed wildtype metabolic flux data, it offers the most reliable basis for experimental transfer.
552
In summary, we could demonstrate that simultaneous application of multiple, complex
553
engineering objectives to genome-scale metabolic models for strain design purposes is indeed feasible
554
using GAs. Moreover, GAs offer the potential to integrate even more complex objectives and methods
555
and their performance may be tuned according to highlighted characteristics and parameter
556
Symbols
558
559
Symbol Explanation
B A bit in the binary representation of an individual 𝐹̂ Intervention size-scaled fitness
𝐹 Objective fitness
𝐹𝑅 Fitness of the best discarded individual 𝜇 Specific growth rate
𝑁𝐵 Number of bits per individual
𝑁𝐷 Number of interventions per individual 𝑁𝐺 Number of subsequent generations 𝑁𝐺𝐹𝐸 Number of subsequent gene flow events
𝑁𝑃 Population size
𝑁𝑃𝑎 Number of possible pairs of individuals 𝑁𝑆 Number of selected individuals
𝑁𝑇 Number of target reactions
𝑅 Mutation rate 𝑣𝑃 Production rate 𝑣𝑆 Substrate uptake rate
𝑋 Selection rate
𝑦 Fitness-intervention size relation factor
560
Supplementary Materials: The following are available online at www.mdpi.com/link. The Genetic Algorithm
561
for Metabolic Engineering (GAMO) framework developed and used in this work is freely available on GitHub
562
(https://github.com/Spherotob/GAMO_public, DOI:10.5281/zenodo.1208048).
563
Supplementary File 1: Section I.1: Determination of reference flux distributions. Section I.2: A simplified
564
calculation of the growth-coupling strength. Section I.3: A databank model including novel network edges.
565
Figure S1: Maximal fitness and Hamming distance progressions applying an adaptive mutation probability
566
approach for a basic genetic algorithm. Figure S2: Total number of fitness function evaluations after 900
567
generations using a basic genetic algorithm and applying different selection rates and population sizes.
568
Figure S3: Maximal fitness progressions applying different numbers of Gene-Flow-Events at constant numbers
569
of total generations. Figure S4: Maximal fitness and Hamming distance progressions using a basic genetic
570
algorithm and the E. coli core model to identify reaction deletions for succinate, ethanol, lactate, and glutamate
571
overproduction. Figure S5: Maximal fitness and Hamming distance progressions using a basic genetic algorithm
572
and the E. coli core model to identify gene deletions for succinate, ethanol, lactate, and glutamate
573
overproduction. Figure S6: Maximal fitness and Hamming distance progressions of genetic algorithm runs using
574
a minimization of intervention set size approach. Figure S7: Hamming distance progressions for genetic
575
algorithm runs using multiple objective functions simultaneously. Figure S8: Maximal fitness and Hamming
576
distance progressions for genetic algorithm runs using the E. coli genome-scale model iJO1366. Table S1:
577
Minimally and maximally expected as well as standard intracellular concentrations of gaseous metabolites.
578
Supplementary File 2: Non-native network edges for the E. coli iAF1260 core model identified following the
579
descriptions in the Supplementary text.
580
Supplementary File 3: Non-native network edges for the E. coli iJO1366 genome-scale model identified following
581
the descriptions in the Supplementary text.
582
Supplementary File 5: Collection of all relevant, identified strain designs.
584
585
Acknowledgments:
-586
Author Contributions: TBA and BEE conceived and designed the study. TBA developed the GA algorithm,
587
performed all simulations and evaluated the simulation results. TBA and BEE wrote the manuscript. LMB
588
supervised the study and edited the manuscript. All authors read and approved the final paper.
589
Conflicts of Interest: The authors declare no conflict of interest.
590
References
591
1. Stephanopoulos, G.; Aristidou, A.; Nielsen, J. J.; Stephanopoulos G., Aristidou A. A., N. J. Metabolic
592
engineering: principles and methodologies; 1998; ISBN 0126662606.
593
2. Woolston, B. M.; Edgar, S.; Stephanopoulos, G. Metabolic engineering: past and future. Annu. Rev. Chem.
594
Biomol. Eng.2013, 4, 259–288, doi:10.1146/annurev-chembioeng-061312-103312.
595
3. Varma, A.; Palsson, B. O. Stoichiometric flux balance models quantitatively predict growth and
596
metabolic by-product secretion in wild-type Escherichia coli W3110. Appl. Environ. Microbiol.1994, 60,
597
3724–3731, doi:PMC201879.
598
4. Schuster, S.; Fell, D. A.; Schuster, S.; Dandekar, T.; Fell, D. A. Detection of elementary flux modes in
599
pathway analysis and metabolic engineering. Trends Biotechnol. 1999, 17, 53–60,
doi:10.1016/S0167-600
7799(98)01290-6.
601
5. Mahadevan, R.; Schilling, C. H. The effects of alternate optimal solutions in constraint-based
genome-602
scale metabolic models. Metab. Eng.2003, 5, 264–276, doi:10.1016/j.ymben.2003.09.002.
603
6. Maia, P.; Rocha, M.; Rocha, I. In silico constraint-based strain optimization methods: the quest for optimal
604
cell factories. Microbiol. Mol. Biol. Rev.2016, 80, 45–67, doi:10.1128/MMBR.00014-15.
605
7. Burgard, A. P.; Pharkya, P.; Maranas, C. D. OptKnock: A bilevel programming framework for
606
identifying gene knockout strategies for microbial strain optimization. Biotechnol. Bioeng.2003, 84, 647–
607
657, doi:10.1002/bit.10803.
608
8. Pharkya, P.; Burgard, A. P.; Maranas, C. D. OptStrain : A computational framework for redesign of
609
microbial production systems. Genome Res.2004, 2367–2376, doi:10.1101/gr.2872004.
610
9. Tepper, N.; Shlomi, T. Predicting metabolic engineering knockout strategies for chemical production:
611
Accounting for competing pathways. Bioinformatics2009, 26, 536–543, doi:10.1093/bioinformatics/btp704.
612
10. von Kamp, A.; Klamt, S. Enumeration of smallest intervention strategies in genome-scale metabolic
613
networks. PLoS Comput. Biol.2014, 10, doi:10.1371/journal.pcbi.1003378.
614
11. Kim, J.; Reed, J. L.; Maravelias, C. T. Large-scale bi-level strain design approaches and mixed-integer
615
programming solution techniques. PLoS One2011, 6, doi:10.1371/journal.pone.0024162.
616
12. Trinh, C. T.; Unrean, P.; Srienc, F. Minimal Escherichia coli cell for the most efficient production of ethanol
617
from hexoses and pentoses. Appl. Environ. Microbiol.2008, 74, 3634–3643, doi:10.1128/AEM.02708-07.
618
13. Harder, B. J.; Bettenbrock, K.; Klamt, S. Model-based metabolic engineering enables high yield itaconic
619
acid production by Escherichia coli. Metab. Eng.2016, 38, 29–37, doi:10.1016/j.ymben.2016.05.008.
620
14. Ng, C. Y.; Jung, M.; Lee, J.; Oh, M.-K. Production of 2,3-butanediol in Saccharomyces cerevisiae by in silico
621
aided metabolic engineering. Microb. Cell Fact.2012, 11.
622
15. Yim, H.; Haselbeck, R.; Niu, W.; Pujol-Baxley, C.; Burgard, A.; Boldt, J.; Khandurina, J.; Trawick, J. D.;
623
Osterhout, R. E.; Stephen, R.; Estadilla, J.; Teisan, S.; Schreyer, H. B.; Andrae, S.; Yang, T. H.; Lee, S. Y.;
624
Burk, M. J.; Van Dien, S. Metabolic engineering of Escherichia coli for direct production of 1,4-butanediol.