A Comparative Analysis of MPPT Schemes for PV Systems
Operating Under Non Uniform Irradiance and Partial
Shaded Conditions
J. Maya 1 , R. Geethamani2
1 PG scholar, 2Assistant Professor
1 [email protected], 2[email protected]
Electrical and Electronics, Sri Krishna College of Engineering and Technology Coimbatore, Tamilnadu-641008
Abstract
The performance of PV system under non uniform irradiance and partial shading condition is analyzed with help of conventional perturb and observe method and improved Incremental Resistance algorithm. The outputs are generated using MATLAB/SIMLUNK. Partial Shading of modules is given importance in this work. The Perturb and observe method is evaluated along with fuzzy controller and the output of the system is compared with Incremental Resistance method. The system with fuzzy logic controller was found to be more efficient and attains stability much faster than any other controller. But the power output of system with INR method was found to be more stable and with boosted value. The comparison of the two MPPT schemes is done in this paper and the performance of the schemes is analyzed.
Key words – PV system, MPPT, partial shading, Perturb and Observe method, Fuzzy controller,Incremental resistance method.
1. Introduction
Energy crisis is the world’s major concern in the present scenario.Renewable energy sources have led its helping hand to the human society as a promise for future development. The simple conversion step in PV system has made its way to electricity generation easier. The advancement in power electronics engineering helped in improvement of applications depending on PVsystem. If all theincoming solar irradiance can be efficiently utilized, the whole population can be powered up for years to come with ideal systems. The efficiency of the system was improved from 8% to 44% with help of many Maximum power point tracking schemes. The analysis of PV system is categorized on structure of semi-conductor, converter topology, MPPT algorithms, and loads structure and so on. Thus the PV system is a field of elaborate study.
As years pass by the performance of PV panel may not meet the guarantee period of about 20-25 years offered as in data sheet.Since they are exposed to dust,
atmosphere and other pollutions, the panels may show only poor performance. Also there are chances of having any plant near the panels that offers shade as it grow in to tree as years pass by. Thus the area of MPPT algorithm is being expanded, considering not just the incoming solar irradiance, but also the system and load.
Typically the Perturb and observe method were mostly employed, but the oscillation obtained at the MPP reduced its efficiency [1]. Similarly incremental conductance method is one of the recognized algorithms. For system withthenon-linear characteristics, incremental conductance method was initially used [6].With variation on load characteristics
the usual methods become insufficient. Controllers for tuning the MPP without oscillations were included. Then the parameter of observation was changed to improve the dynamics of control to obtain incremental resistance method [7].
2. PV sys
In general source. Th upon the so
Fi
The major irradiance. temperatur equation.
Where, a r
Boltzmann To improv of temper formulated The suffi parameters Where
Ipvn is the n data she kIandvoltag
Analysis i irradiance study mor bring an an schemes, to
stem model
l the solar ce he characteristi
olar irradiance
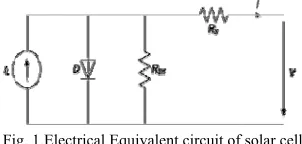
ig. 1.Electrical Equ
r equations of s The characteri re co-efficient
represents the d n constant (1.38
ve the performa rature a modi d [5]. G denot x n represen s.
∆
∆
∆
nominal PV cu et. Thecurre ge temperature
is made on P and partially re effective. T nalysis on syste o verify the co
ling
ell isconsidere cs of solar cel
and temperatu
uivalent circuit of
solar cell invo isticequations i
termsand diod
1
diode factor of 8x10-23).
ance of solar ce ified Io curre tes the solar i nts the nom
(2)
urrent value ob ent temperatu e coefficient kV
PV system fo shaded situati This paper ma em with and w
rrectness.
ed as a curre l mainly depen ure.
solar cell
olve the effect involve both th de characteristi
(1)
f 1.2 and k is th
ell in wide rang ent equation irradiance valu minal values
(3)
btained from th ure coefficie V is included. or non unifor ion to make th ake an effort without controll ent nd of he ics he ge is ue. of he ent rm he to ler The sec is m in s
3.
The cho KC 1.5 non pro par cha The var also irra wit cha Sim con pare general study ction 3. In secti
made. The incr section 5, follo
Simple sche
e simulation oosing certain C200GT is take
. Equations 1,2 n uniform irr oviding varying rticular time aracteristics we
Table
Par
Fig. 2. (a) I-V
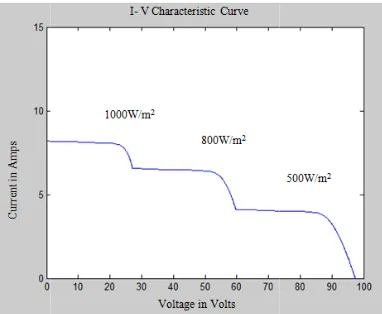
e Figure 2 sho rying irradiance o varies linear adiance the per th non uniform anging.
milarly figure 3 ndition on PV rticular time pe
y on PV witho ion 4 the valida
remental resist owed by the res
eme without
of PV is m n parameter c
en for the anal 2 and 3 is used radiance cond g irradiance fo intervals a ere plotted.
e 1: Specifications
rameter V
Impp 7
Vmpp 2
Pmax 2
Isc 8
Voc
kV -0.1
kI 0.0
Ns
Characteristics at
ows the relatio e. Its seen that rly. But as tem rformance of th m irradiance the
3 shows the e V system wit eriod it generat
ISSN 2
(1) out controller is
ation of fuzzy tance method sults.
t controller
made in MAT criterions. A P
lysis at STC w d for the simul dition is simu or all three mo and the per
s of PV panel
Values 7.61 A 26.3 V 200 W 8.21 A 32.9 1230 V/K 0032 A/K 54 non-uniform irrad
on between cu with irradianc mperature incre he system redu e power curve
effect of partia thout controll tes more than
2348 – 7968
)
s made in controller is briefed
TLAB by PV array with A. M
lation.The ulated by odules for rformance diance urrent and ce, current eases with uces. Thus keeps on al shading ler. At a
which mak point.
Fig. 2.
Fig. 3
With the c to implem controller power outp
kes it difficult
(b) P-V Character
3. (a) I-V characte
characteristics ent a system f is required to put.
t to find the
ristics at non-unifo
eristics curve at Par
curve obtained for supplying
ensure the con
optimum pow
orm irradiance
rtial shading
d it is clear th a load, a prop nstant maximu
wer
hat per um
Fig.
3.
is c wit
The pro cho irra
3.1
The to m spe inv of v
The from
3.2
Ma yea
3. (b) P-V charac
P&O with F
The conv considered as t th DC-DC conv
Fig.3
e controller is t oper tuning of t osen by consid adiance.
1 DC- DC Bo
e system is reg maximize the ecifications ca volving the duty
value 30KHz.
e Capacitor a m equations 5
∆
∆
Tab
Pa
C L Cf Lf Ro
2 MPPT cont
any algorithms ars, for maximu
teristics curve at P
Fuzzy Cont
ventional pertu the MPPT con verter.
. The Basic block
the major part the output. The ering many fac
oost converter
gulated with a D obtained outpu an be obtaine
y cycle Dand t
and inductor v and 6.
ble 2: Converter Sp
arameter
filter filter o
troller
s have been d um power poin
Partial shading
roller
urb and observ ntroller for a P
diagram of the sy
of concern tha e system param ctors as temper
r
DC-DC boost ut. The boost ed from the the switching f
(4
valuesare calc
(5
(6
pecifications
Values
500μF 5mH 470μF 3mH 300ῼ
developed in t nt tracking app
ve method PV system
stem.
at helps in meters are rature and
converter converter equations frequency
4)
culated as
5)
6)
Hill climb simplest on for better a The P&O the oscilla tuning con
Fig
3.3 Fuzzy
The fuzzy the maxim established for FLC ar The memb clarity of member sh NS (negat and PB (p with help o
E / dE N
NB Z
NS Z
ZE P
PS N
PB N
The major
bing methodis ne. But with ex algorithm incre
has shown a v ation shown w ntrollers are req
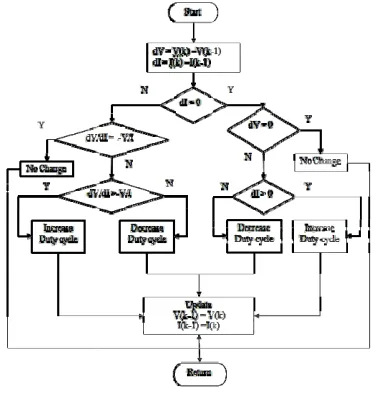
g 4. Flowchart for
y logic contro
logic controlle mum power poin d mathematica
re an error sign ber ship funct
the output a hip functions a tive small), ZE positive big). T of the function
Table 3: Fu
NB NS
ZE ZE
ZE ZE
PS ZE
NS NS
NB NB
equations con
the early dev xpansion in th eased.
very good perfo when reaching
quired.
perturb and obser
oller
er is implemen nt as it does n l model. The p nal and change tions and rule and its stabilit are used [3] NB
E (zero), PS ( The inference plot and 17 ru
uzzy inference table
ZE PS
PB PB
PS PS
ZE ZE
NS ZE
NB ZE
cerned is
veloped and th he field, the nee
ormance, but f the MPP, bett
rve method
nted here to tun not require a we parameters use e in error signa s determine th ty. Mainly fiv B (negative big (positive smal
table is forme ules.
e
PB
PB PS NS ZE ZE
he ed
for ter
ne ell ed al. he ve g), ll), ed
Wh sys
4. I
Al
The stan to Inc par for
The hig cha sca
Sin con wit
here, Ppv and I stem.
Incrementa
gorithm
e algorithms s ndard test cond
change the b cremental cond rtial shaded an fixed scaling f
Fig 5. Flowc
e scaling fact ghly varying ir anged in to di aling factor pro
nce duty cycl ntroller to the c th the scaling f
1
Ipv are power
al Resistanc
so far impleme ditions. Varyin behavior of p ductance metho nalysis. But it
factor[11].
chart ofIncrementa
tor also neede rradiance natu iscrete domain operty.
e is the requ converter, the e factor to obtain
ISSN 2
and current o
e MPPT
ented were eff ng nature of clim parameterinvol
od wasmodifie was implemen
al Resistance meth
ed to be chan ure.[12] The si
n to achieve a
(
(
uired output error signal is m n new duty cycl
2348 – 7968
(7)
(8)
of the PV
ficient for mate tend ved. The ed for the
nted only
hod.
nged, for ignals are a varying
(9)
10)
The maxim to these thr
It is clear parameter. linearizatio chosen in t
5. Simul
The Syste powered by array is sim The system fuzzy cont the adaptiv non uniform . Fig.6. Power Th variation in standard te noted that not sustain algorithms tracking ca The Fuzzy MPP with fuzzy contr after a sm 1000w/m2 seconds lat
The powe irradiance partial sha
mum power po ree conditions.
1 1 ; 1
r that the sc With the chan on is also var this paper.
lation and R
em considers y a PV array o mulated with h m is incorporate
troller, and the ve incremental
m irradiance an
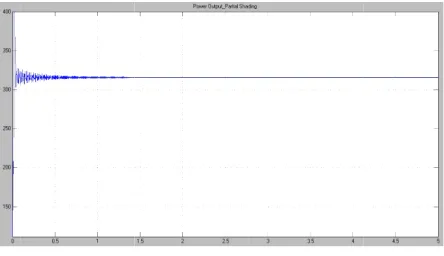
Output for partial
he power o n the incoming est condition is the power outp n for longer pe s and controlle
an be understoo
y controller is u P&O methodI roller, the outp mall disturban for 2 seconds, ter a 800w/m2
er output is r applied. The p ading mode is
oint is tracked
| | ;
| | ;
aling factor i nge in scaling ried. Afixed s
Results
a nominal r f KC200GTmo help of MATLA edwith the P& en a compariso l resistance alg nd partial shad
shading without c
utput obtaine g solar irradian
s shown in .Fig put is highly n eriod. Thus th ers for maximu
od
used to reduce t It is seen that f put is stabilized nce. A varyin
and reduced t till 5 second w
reduced with peak power is a
analyzed by a
by checking o
0 0
0
is an importa factor the pow scaling factor
residential loa odel. A3 modu AB/SIMULINK &O algorithm an
on is made wi gorithm for bo ded condition
controller.
ed during an ce other than th gure 6. It can b non linear and d he importance
um power poi
the oscillation from Fig. 7 wi d within secon ng irradiance to 500w/m2 for were given.
respect to th about 550W. Th applying varyin on ant wer is ad ule K. nd ith oth ny he be do of int at ith ds of r 4 he he ng irra thre diff Fig. 500w No par pow com the def poi It ma tran avo The con abo dur Sha per also the out of t 9. natu adianceof1000w ee modules res ferent peak.
7. Power outpu w/m2 and 800w/m
w Fig 8 den rtial shading w wer is maxi mpromise is n
STC. The fuzzification m int.
can also be intained to an nsient up to 0 oided by using
Fig. 8 Power outp
e major advan nverter is the out 1kW. The ring any variati
ading can be rmanent reason o important. W irradiance lev tput then tends
the maximum The movemen ure, thus th
w/m2, 800w/m spectively. The
ut for non-uniform m2 irradiance
otes the pow with fuzzy con
imized and needed to be m
fuzzy con method could
noted that n optimum o 0.01 seconds.
better design.
put of partially shad controller
ntage of using ability to ach e algorithm is ion in the weat
e more comp n, the analysi When consideri
vel is continuo to settle in litt output, which nt of clouds c he power ge
m2 and 500w/ e Each module
m irradiance with
er output obt ntroller. It is more stable made when co ntroller with
find the glob
The Power o of 320W after This transien
ded PV panels wit r
INR along w hieve a booste also able to ther.
plicated if d s on the occu ing fast movin ously varied. T tle lesser point can be seen as can be very ra enerated reduc
/m2to the e generate
1000w/m2,
ained for seen that , but a onsidering
centroid bal power
output is r a peak nt can be
th Fuzzy
with boost ed power tune well
ISSN 2348 – 7968
irradiance gradually from about 700W. That is power is generated respective to the value of irradiance, unless as fuzzy controller were the power obtained is of the minimum optimum value.
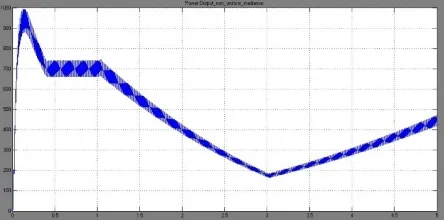
Fig. 9. Power output due non uniform irradiance using INR.
When implementing the incremental resistance method with nominal scaling factor for different irradiance at each module, a stabilized output is obtained. The scaling factor helps in maintaining a very high output power. The controller can be used to tune the power output between various peaks and ultimately finding the global maxima of the system.
Fig. 10. Power output due to partial shaded modules using INR.
From figure 10 it can be noted that the power output reaches a value of 0.5kW during the partially shaded condition of modules after a slow decrease from a transient.Without the controller the power output will be the power output of the single module, with the INR MPPT controller the output is maintained the next highest possible value of the whole system capacity. Here the power variation is linear and with less transients.
5.1 Comparison of Results
The partial shaded condition is considered as the dominant issue in this paper. Hence the comparison is made under the analysis for shading only. The power output obtained under three conditions are observed and noted. The analysis shows that incremental
resistance method show better performance with boosted power value.
Table 4: Comparison of Results
Sl.
No. PV system
Power Output
Non-Uniform Irradiance
Partial shaded Condition
1 Controller Without (STC) 600W 200W
2 P&O with FLC 550W 320W
3 INR Method 710W 450W
Considering the power rating that can be obtained from PV system, Fuzzy controller shows 53% efficiency and system with INR controller provides 75% efficiency along with the boosted output. For a system requiring boosted output value INR method can be chosen, but for system whose priority is stability instead of power output value Fuzzy controller can be considered.
5. Conclusion
The growing energy crisis leads us to focus on renewable energy sources. Photovoltaic system being the more energy efficient is been widely used on many application. Photovoltaicsystem requires less stages of conversion making it much more reliable. Maximum power point tracking algorithms are used to improve system efficiency.From the developed algorithms proper choice of method is necessary to obtain the required outcome.In this paper an effort is made to analyze the effect of varying irradiance along with partial shaded condition with help of perturb and observe method and fuzzy controller . A comparative study is made with incremental resistance method for all parameter variations. With the Implementation of fuzzy controller, output could be stabilized faster but the peak overshoot obtained in the output was further reduced by implementing INRmethod.
For partial shading condition both fuzzy controller and incremental resistance algorithm shows better performance, but the power output can be boosted to very high value without disturbing the design aspect of the system with Incremental Resistance method.
References
[2] H. Bounechbaa, A. Bouzida, K. Nabtib and H. Benallab, “Comparison of perturb & observe and fuzzy logic in maximumpower point tracker for PV systems”,The International Conference on Technologies and Materials for Renewable Energy, Environmentand Sustainability, TMREES14, pp. no:677 – 684
[3] Ganesh Pachpande, Prof. Pankaj H. Zope, “Studying the effect of shading on Solar Panel using MATLAB,” International Journal of Science and Applied Information Technology, ISSN No. 2278 -3083 Volume 1, No.2, May – June 2012
[4] Ali Bidram, Ali Davoudi, and Robert S. Balog, “Control and Circuit Techniques to Mitigate Partial Shading Effects in Photovoltaic Arrays,” IEEE Journal of Photovoltaics, Vol. 2, No. 4, October 2012
[5] ekeshwar Prasad Sahu, T.V. Dixit and Ramesh Kumar, “Simulation and Analysis of Perturb and Observe MPPT Algorithm for PV Array Using ĊUK converter”, Research India, ISSN 2231-1297, Volume 4, Number 2 (2014), pp. 213-224
[6] F. Liu, S. Duan, F. Liu, B. Liu, and Y. Kang, “A variable step size INC MPPT method for PV Systems,” IEEE Trans. Ind. Electron., Vol. 55, No.7, pp. 2622-2628, Jul. 2008
[7] Qiang Mei, Mingwei Shan, Liying Liu, and Josep M. Guerrero, “A Novel Improved Variable Step-Size Incremental-Resistance MPPT Method for PV Systems”, IEEE Transactions On Industrial Electronics, Vol. 58, No. 6, June 2011
[8] Raghav Khanna, Qinhao Zhang, William E. Stanchina, Gregory F. Reed, and Zhi-Hong Mao, “Maximum Power Point Tracking Using Model Reference Adaptive Control,” IEEE Transactions On Power Electronics, Vol. 29, No. 3, March 2014
[9] Chih-Yu Yang, Chun-Yu Hsieh, Fu-Kuei Feng, and Ke-Horng Chen, “Highly Efficient Analog Maximum Power Point Tracking (AMPPT) in a Photovoltaic System,” IEEE Transactions on Circuits and Systems— I: Regular Papers, Vol. 59, No. 7, July 2012
[10] Abd Kadir Mahammad, Sharifah Saon and Wong Swee Chee, “Development of Optimum Controller based on MPPT for Photovoltaic System during Shading Condition,” Procedia Engineering 53 (2013) 337 – 346 [11] Srushti R.Chafle1, Uttam. B.Vaidya,“Incremental
Conductance MPPT Technique for PV System”, IJAREEIE,Vol. 2, Issue 6, June 2013
[12] Emad M. Ahmed and Masahito Shoyama, “Scaling Factor Design Based Variable Step Size Incremental Resistance Maximum Power Point Tracking for PV Systems,” Journal of Power Electronics, Vol. 12, No. 1, January 2012
Maya Jreceived under graduation degree in Electrical and Electronics Engineering from Anna University, Chennai, in 2012. She is currently pursuing Post Graduation on Power Electronics and Drives. Her area of interest is towards Power Electronics in Renewable Energy Systems.