R E S E A R C H A R T I C L E
Open Access
Inequalities of caries experience in Nevada youth
expressed by DMFT index vs. Significant Caries
Index (SiC) over time
Marcia Ditmyer
1*, Georgia Dounis
1, Connie Mobley
1and Eli Schwarz
2,3Abstract
Background:With the increasingly polarized distribution of dental caries among children and adolescents, the usual DMFT measure has become a less meaningful population descriptor. To re-focus on identifying the high caries prevalence group the Significant Caries Index (SiC) was created. The aims of this study were to analyze the prevalence and severity of dental caries in Nevada youth over a period of eight years and to compare its expression by means of DMFT and SiC; analyze the caries trends in the population and their underlying factors, and determine whether Nevada youth were at risk for significantly high levels of dental caries.
Methods:Retrospective data was analyzed from a series of sequential, standardized oral health surveys across eight years (2001/2002-2008/2009) that included over 62,000 examinations of adolescents 13-19 years of age, attending public/private Nevada schools. Mean Decayed-Missing-Filled Teeth index (DMFT) and Significant Caries Index (SiC) were subsequently computed for each academic year. Descriptive statistics were reported for analysis of comparative DMFT and SiC scores in relation to age, gender, racial background, and residence in a fluoridated/ non-fluoridated community. Logistic regression analysis was used to analyze the differential impact of the variables on the probability of being in the high caries prevalence group.
Results:Comparison of students’ mean DMFT to National (NHANES) data confirmed that dental caries remains a common chronic disease among Nevada youth, presenting higher prevalence rates and greater mean scores than the national averages. Downward trends were found across all demographics compared between survey years 1 and 6 with the exception of survey year 3. An upward trend began in survey year six. Over time, the younger group displayed an increasing proportion of cariesfree individuals while a decreasing proportion was found among older examinees. As expected, the mean SiC score was significantly higher than DMFT scores within each survey year across comparison groups (p < 0.001).
Conclusions:Using both caries indices together may help to highlight oral health inequalities more accurately among different population groups within the community in order to identify the need for special preventive oral health interventions in adolescent Nevadans. At the community level, action should focus on retaining and expanding the community fluoridation program as an effective preventive measure. At the individual level the study identifies the need for more targeted efforts to reach children early with a focus on females, Hispanics and Blacks, and uninsured children.
* Correspondence: [email protected]
1
UNLV School of Dental Medicine, 1001 Shadow Lane, MS 7425, Las Vegas, NV 89106, USA
Full list of author information is available at the end of the article
Background
For many years, the World Health Organization (WHO) global goal for year 2000 for dental caries of no more than an average of 3 DMFT (decayed, missing, filled teeth) at 12 years of age has been used as a global yard-stick for oral health program success [1]. Decades ago the WHO developed oral disease surveillance systems to monitor dental caries in children. The first global map with DMFT data on 12-year-olds was presented in 1969. This map indicated high prevalence of caries in indus-trialized countries and generally low values in the devel-oping countries [1]. Although dental caries prevalence in industrialized countries has declined significantly since the early 1970s, oral diseases, including caries, remain a major public health challenge [2-4]. In 2007 the WHO reported that 60-90% of school children worldwide have dental caries [5]. Traditional dental care remains a significant economic burden for many coun-tries, where 5-10% of public health expenditure relates to oral health [5]. In US children, the recently reported prevalence of dental caries was approximately 60% in ages 12 to 19, with a reported 20% having untreated tooth decay [4]. Childhood dental caries has been reported to be the most prevalent infectious disease in our nation - 5 times as common as asthma and 7 times as common as hay fever [6]. A review of progress towards meeting theHealthy People 2010Objectives for Oral Health, noted that 11 of the objectives have shown little or no progress [6]. In 2004, most American chil-dren reported good oral health, but subsets suffered a higher level of oral disease, primarily children living in poverty and some racial/ethnic minority populations [7]. Seventy-eight (78) percent of 17-year-olds had experi-enced tooth decay. One in four American children was born into poverty, suffering twice as much tooth decay as their more affluent peers and more likely having no access to oral health care [7]. Children from families without medical insurance were 2.5 times less likely than insured children to receive dental care and 3 times more likely than insured children to have unmet dental needs [7]. The use of DMFT scores to establish severity and prevalence of caries is an accepted practice in the dental community and has continuously been used to assess prevalence in the National Health and Nutrition Examination Survey (NHANES) [4]. An analysis con-ducted by the WHO found that there was a skewed dis-tribution of caries prevalence in many countries; a significant proportion of 12-year-olds still had high or even very high DMFT values even though a proportion was totally cariesfree [8]. This polarization of the caries picture has the effect of making the mean DMFT value less meaningful as a population descriptor in that it does not accurately reflect the burden of disease [9].
Thus it may lead to the incorrect conclusion that the caries situation for the whole population is under con-trol, whereas in reality population subgroups still suffer from high caries rates. The Significant Caries Index (SiC) was introduced in 2000 to bring attention to the individuals with the highest caries values in each popu-lation [8,10-12]. The aims of this study were to analyze the prevalence and severity of dental caries in Nevada youth over a period of eight years and to compare its expression by means of DMFT and SiC; analyze the car-ies trends in the population and their underlying factors; and determine whether Nevada youth were at risk for significantly high levels of dental caries and should be specifically targeted for oral health interventions.
Methods
Selection and description of study population
Since 2001, we have been conducting a grant-sponsored, annual statewide, school-based, oral health screening initiative in public/private middle and high schools in Nevada. These sequential cross-sectional studies were conducted from 2001/2002 academic year through the 2008/2009 academic year and comprised 62,707 oral health examinations of adolescents between ages 13 and 19. Inclusion criteria for participation were parental consent and student assent. The University of Nevada Las Vegas Institutional Review Board approved these surveys which also ensured student confidentiality and protection.
Oral Health Screening
Examinations were conducted in dedicated mobile den-tal clinics (one each in northern and southern Nevada). All licensed professional serving as examiners for the study were calibrated at the start of each school year by the grant administrator in accordance with the proce-dural manual established for and approved by the grant funding agency and the university institutional review board. Trained and calibrated licensed oral health pro-fessionals served as examiners and performed oral health screenings to assess DMFT scores. Single mea-sure intraclass correlation was assessed as an index of the reliability of a single examiner (r = 0.81) and interra-ter reliability between all examiners were computed with the average measure intraclass correlation coefficient (ICC) (r = 0.98) [13].
explorers. However, when comparing studies using visual methods without probing and drying, to studies using visual/tactile methods with explorers and com-pressed air, only in groups with low caries prevalence were statistical differences observed [15]. As with NHANES, severity was determined using DMFT indices developed by Klein et al. [16]. The oral screening initia-tive procedural manual detailed all diagnostic and cod-ing criteria.
Face-to-Face Interviews
Trained interviewers collected demographic and oral health status information through face-to-face interviews in the privacy of the mobile clinic setting. Selected self-reported information identified behaviors, health history, and environmental factors of interest. Cronbach’s alpha was used to assess internal reliability of the question-naire (r = 0.79) [17].
Statistical Analysis
DMFT describes the severity of dental caries in an indi-vidual. It is calculated by adding the number of decayed (D), missing (M), and Filled (F) teeth and expresses the individual’s dental caries experience until the day of examination. Because the four 3rd molars erupt at approximately age 17 (average between ages 15-25) these teeth were excluded from the DMFT calculation in this population. The sum of all the DMFT values divided by the total number of individuals in the sample provides the mean DMFT for the population [7,18].
The Significant Caries Index (SiC) was calculated as follows [8]:
1) Individuals in the population (sample) were sorted according to their DMFT values
2) One third of the population with the highest car-ies scores was selected
3) The mean DMFT for this subgroup was calcu-lated. This value is the SiC Index.
DMFT and SiC values were computed for each survey year and were further analyzed by demographic variables to include age, gender, race/ethnicity, whether they resided in areas where the municipal water supply was fluoridated, and whether or not they had dental insur-ance. Descriptive statistics (mean and standard error) were used to compare and compute DMFT and SiC index differences between the subgroups. T-tests and ANOVAs were computed between DMFT Scores and SiC Indices. In order to analyze the relative risk of hav-ing a high caries score in relation to our selected demo-graphic variables, a bivariate logistic regression analysis was carried out for each year; with the population dichotomized according to individuals in the SiC group
(group with the highest DMFT, coded as 1) and all others (coded as 0). Wald statistics was used to deter-mine significance of the respective variables. Tests were done to determine the presence of multicollinearity (none found). Backwards stepwise method was used; Odds ratios (OR) produced and data reported in this study were analyzed using SPSS 18.0 (SPSS, Inc., Chi-cago, IL).
Results
Demographics of those screened are shown in Table 1. During the eight years of survey the annually examined populations varied between 6,400 and 10,900 individuals. Apart from the first survey year the younger group (13-15 years old) stabilized at around 2/3 of the ones exam-ined, whereas the older group (16-19 years old) com-prised around 1/3. Throughout the surveys the gender balance was almost 50:50. There was a downward trend in the proportion of adolescents of White background, whereas both Blacks and Hispanics showed increasing proportions of the examined populations. The relative distribution of the study groups according to residence varied throughout the period with Clark County resi-dents consistently underrepresented (Clark County com-prises around 72% of Nevada’s population). During the first 4 years of survey insurance status was relatively stable across the entire period with around 2/3 reporting insured status and 1/3 not insured.
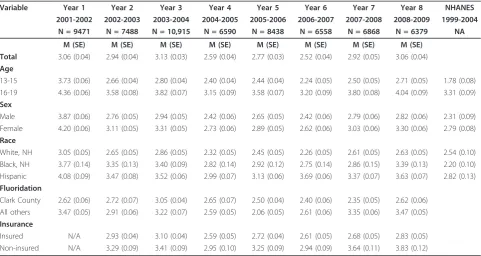
The mean DMFT values by year is detailed in Table 2. Overall, the DMFT index stayed around 3 DMFT at the beginning and at the end of the survey period. However, during the period some decrease took place, which reverted to an increase towards the end of the survey years. This trend was reflected for the two age groups as well with the younger age group at a significant lower level than the older. Both age groups had significantly higher DMFT score than the comparable national sam-ples of the same age illustrated by the NHANES figures in the table. Females had consistently higher DMFT than males and Hispanic examinees were consistently higher than Whites and Blacks. Residents of the fluori-dated Clark County were consistently lower than resi-dents of the rest of the State, and insured resiresi-dents exhibited less caries experience than the non-insured group.
prevalence of dental caries in the younger group was around 65% and around 77% in the older group.
The variation of cariesfree individuals over time in relation to racial background and county of residence respectively are illustrated in Figure 2 and Figure 3. It is
interesting to note that the white population reflected a general increase in proportion of cariesfree individuals (from around 29% to around 38%), whereas the two other groups started out around 25%, improved some-what during the survey years, but ended up around
25-Table 1 Study population decription
Variable Year 1 Year 2 Year 3 Year 4 Year 5 Year 6 Year 7 Year 8
2001-2002 2002-2003 2003-2004 2004-2005 2005-2006 2006-2007 2007-2008 2008-2009
N-value % N-value % N-value % N-value % N-value % N-value % N-value % N-value % Total 9471 100.0 7488 100.0 10,915 100.0 6590 100.0 8438 100.0 6568 100.0 6868 100.0 6379 100.0 Age
13-15 4880 51.5 5184 69.2 7428 68.1 4850 73.6 5971 70.8 4662 70.9 4684 68.2 4681 73.4 16-19 4591 49.5 2304 30.8 3487 31.9 1740 26.4 2467 29.2 1906 29.1 2184 31.8 1698 26.6 Sex
Male 4710 49,7 3588 47.9 5370 49.2 3047 46.2 4132 49.0 3169 48.2 3329 48.5 3166 49.6 Female 4761 50.3 3900 52.1 5539 50.8 3543 53.8 4306 51.0 3385 51.6 3539 51.5 3213 50.4 Race
White, NH 6825 72.1 4755 63.5 6322 57.9 3699 56.1 4187 49.6 3663 55.8 3731 54.3 3454 54.1 Black, NH 658 6.9 665 8.9 1032 9.5 621 9.4 763 9.0 552 8.4 556 8.1 668 10.5 Hispanic 1988 21.0 2068 27.6 3561 32.6 3063 46.5 3488 41.4 2353 35.8 2581 37.6 2257 35.4 Fluoridation
Clark County 3218 33.9 2121 28.3 5472 50.1 1670 25.4 4290 50.8 2762 42.1 2985 43.5 3042 47.7 All others 6253 66.1 5367 71.7 5443 49.9 4918 74.6 4148 49.2 3806 57.9 3883 56.5 3337 52.3 Insurance
Insured N/A 5049 67.4 7357 67.4 4322 65.6 5743 68.1 4554 69.4 4454 64.8 3897 61.1 Non-insured N/A 2439 32.6 3558 32.6 2268 34.4 2695 31.9 2004 30.6 2414 35.2 2482 38.9
Demographic breakdown of selected variables of study population of Nevada adolescents by year of survey.
Table 2 Caries severity among Nevada adolescents
Variable Year 1 Year 2 Year 3 Year 4 Year 5 Year 6 Year 7 Year 8 NHANES
2001-2002 2002-2003 2003-2004 2004-2005 2005-2006 2006-2007 2007-2008 2008-2009 1999-2004 N = 9471 N = 7488 N = 10,915 N = 6590 N = 8438 N = 6558 N = 6868 N = 6379 NA
M (SE) M (SE) M (SE) M (SE) M (SE) M (SE) M (SE) M (SE) Total 3.06 (0.04) 2.94 (0.04) 3.13 (0.03) 2.59 (0.04) 2.77 (0.03) 2.52 (0.04) 2.92 (0.05) 3.06 (0.04) Age
13-15 3.73 (0.06) 2.66 (0.04) 2.80 (0.04) 2.40 (0.04) 2.44 (0.04) 2.24 (0.05) 2.50 (0.05) 2.71 (0.05) 1.78 (0.08) 16-19 4.36 (0.06) 3.58 (0.08) 3.82 (0.07) 3.15 (0.09) 3.58 (0.07) 3.20 (0.09) 3.80 (0.08) 4.04 (0.09) 3.31 (0.09) Sex
Male 3.87 (0.06) 2.76 (0.05) 2.94 (0.05) 2.42 (0.06) 2.65 (0.05) 2.42 (0.06) 2.79 (0.06) 2.82 (0.06) 2.31 (0.09) Female 4.20 (0.06) 3.11 (0.05) 3.31 (0.05) 2.73 (0.06) 2.89 (0.05) 2.62 (0.06) 3.03 (0.06) 3.30 (0.06) 2.79 (0.08) Race
White, NH 3.05 (0.05) 2.65 (0.05) 2.86 (0.05) 2.32 (0.05) 2.45 (0.05) 2.26 (0.05) 2.61 (0.05) 2.63 (0.05) 2.54 (0.10) Black, NH 3.77 (0.14) 3.35 (0.13) 3.40 (0.09) 2.82 (0.14) 2.92 (0.12) 2.75 (0.14) 2.86 (0.15) 3.39 (0.13) 2.20 (0.10) Hispanic 4.08 (0.09) 3.47 (0.08) 3.52 (0.06) 2.99 (0.07) 3.13 (0.06) 3.69 (0.06) 3.37 (0.07) 3.63 (0.07) 2.82 (0.13) Fluoridation
Clark County 2.62 (0.06) 2.72 (0.07) 3.05 (0.04) 2.65 (0.07) 2.50 (0.04) 2.40 (0.06) 2.35 (0.05) 2.62 (0.06) All others 3.47 (0.05) 2.91 (0.06) 3.22 (0.07) 2.59 (0.05) 2.06 (0.05) 2.61 (0.06) 3.35 (0.06) 3.47 (0.05) Insurance
Insured N/A 2.93 (0.04) 3.10 (0.04) 2.59 (0.05) 2.72 (0.04) 2.61 (0.05) 2.68 (0.05) 2.83 (0.05) Non-insured N/A 3.29 (0.09) 3.41 (0.09) 2.95 (0.10) 3.25 (0.09) 2.94 (0.09) 3.64 (0.11) 3.83 (0.12)
29.9%
36.1%
32.0%
40.4%
37.7%
44.6%
38.0%
35.3%
26.1% 28.3% 24.9%
30.7%
28.1%
33.3%
29.0%
22.9%
1 2 3 4 5 6 7 8
Proportion of examined adolescents who were
cariesfree by age
13-15 Yr old 16-19 Yr old
Figure 1Cariesfree adolescents by age. Proportion of examined adolescents in each year who were cariesfree in relation to age group. Numbers 1-8 indicates year of examination from 2001/2002 - 2008/2009.
29.4%
38.0%
32.6%
41.7%
39.2%
44.9%
38.1% 37.5%
23.1% 24.8% 26.3%
38.6%
31.5%
39.1%
35.1%
25.9% 25.2% 26.5%
25.7% 23.2%
30.5%
36.3%
27.9%
25.4%
1 2 3 4 5 6 7 8
Proportion of examined adolescents who were
cariesfree by racial background
White, NH Black, NH Hispanics
26% in year 8 (Figure 2). According to county of resi-dence a dramatic difference was evident in that the pro-portion of cariesfree individuals in fully fluoridated Clark County varied around 40-80%, whereas only around 10-20% in all other counties (not fluoridated) were found to be cariesfree.
The SiC indices by survey year is detailed in Table 3. It comprises the 30% of the examined population with the highest DMF values and thus, the mean caries values were considerably higher than the corresponding DMF values ranging from an initial 8.86 DMF to 6.01 in the middle of the period and then climbing up to 7.0 DMFT. 61.30%
83.80%
41.80% 38.70%
51.80%
70.40%
57.90% 56.70%
11.00% 13.90% 17.70% 10.70% 17.40%
20.20%
15.70%
9.50%
1 2 3 4 5 6 7 8
Proportion of examined adolescents who were
cariesfree by county of residence
Clark Other Counties
Figure 3Cariesfree adolescents by residence. Proportion of examined adolescents in each year who were cariesfree in relation to their county of residence. Clark County is fluoridated, all other counties are non-fluoridated. Numbers 1-8 indicates year of examination from 2001/ 2002 - 2008/2009.
Table 3 Caries severity among Nevada adolescents with high caries scores
Variable Year 1 Year 2 Year 3 Year 4 Year 5 Year 6 Year 7 Year 8
2001-2002 2002-2003 2003-2004 2004-2005 2005-2006 2006-2007 2007-2008 2008-2009 N = 3157 N = 2496 N = 3638 N = 2197 N = 2812 N = 2189 N = 2289 N = 2126
M (SE) M (SE) M (SE) M (SE) M (SE) M (SE) M (SE) M (SE)
Total 8.86 (.005) 6.85 (0.56) 6.85 (0.06) 6.18 (0.06) 6.01 (0.05) 6.31 (0.07) 6.84 (0.06) 7.00 (0.06) Age
13-15 8.93 (0.08) 6.56 (0.06) 6.56 (0.06) 5.89 (0.06) 5.65 (0.06) 6.08 (0.08) 6.46 (0.07) 6.74 (0.07) 16-19 8.81 (0.07) 7.36 (0.10) 7.36 (0.10) 6.96 (0.12) 6.66 (0.09) 6.70 (0.12) 7.40 (0.09) 7.45 (0.10) Sex
Male 8.77 (0.08) 6.70 (0.05) 6.70 (0.08) 6.08 (0.09) 5.99 (0.07) 6.12 (0.09) 6.74 (0.08) 6.92 (0.09) Female 8.93 (0.08) 6.97 (0.05) 6.97 (0.08) 6.26 (0.08) 6.03 (0.06) 6.48 (0.09) 6.92 (0.8) 7.06 (0.08) Race
White, NH 8.97 (0.07) 6.77 (0.08) 6.77 (0.08) 6.02 (0.08) 5.72 (0.07) 5.92 (0.09) 6.64 (0.08) 6.68 (0.09) Black, NH 8.61 (0.21) 6.95 (0.16) 6.78 (0.15) 6.47 (0.19) 5.79 (0.15) 6.19 (0.22) 6.67 (0.21) 6.86 (0.11) Hispanic 8.57 (0.11) 7.08 (0.09) 7.08 (0.09) 6.31 (0.09) 6.39 (0.07) 6.91 (0.11) 7.12 (0.09) 7.27 (0.09) Fluoridation
Clark County 8.19 (0.07) 6.81 (0.14) 6.56 (0.06) 6.22 (0.11) 5.54 (0.06) 6.09 (0.09) 6.29 (0.09) 6.44 (0.08) All others 8.99 (0.09) 6.96 (0.14) 7.36 (0.10) 7.17 (0.07) 6.46 (0.07) 7.45 (0.09) 7.14 (0.07) 7.39 (0.08) Insurance
Insured N/A 6.90 (0.07) 6.90 (0.07) 6.16 (0.07) 6.00 (0.06) 6.39 (0.08) 6.71 (0.07) 6.96 (0.08) Non-insured N/A 7.04 (0.12) 7.35 (0.11) 6.40 (0.16) 6.43 (0.13) 7.19 (0.15) 7.17 (0.14) 7.24 (0.13)
Number of Decayed, Missing, and Filled Teeth (mean DMFT and standard error) among the 30% subgroup of Nevada adolescents with the highest DMFT scores (Significant caries Index group) by year of study and in relation to selected variables.
The SiC Index was significantly higher than mean DMFT Index when comparing each demographic vari-able within each survey year (p < 0.001). Females, older adolescents (16-19 year olds), minority groups, those liv-ing in areas where the municipal water supply is not fluoridated, and those without dental insurance had higher mean DMFT scores. SiC Indices were signifi-cantly higher across the board, with the results parallel-ing the trends in the mean DMFT scores
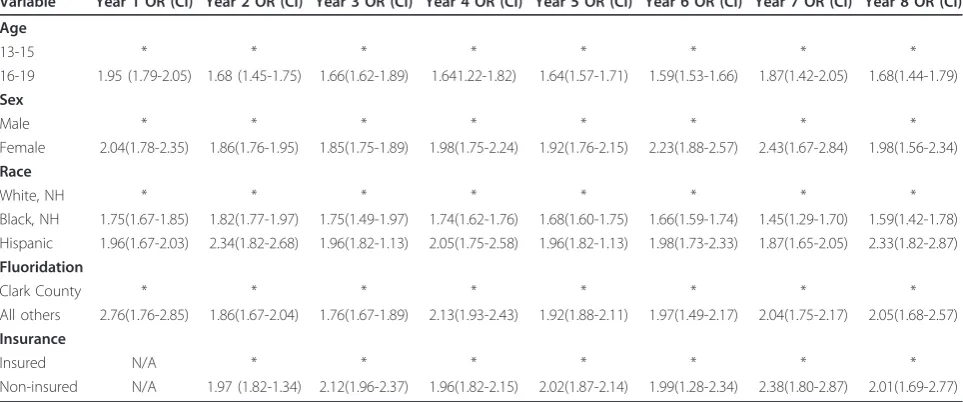
In order to assess the relative impact of the indepen-dent demographic variables on the probability of ending up in the high caries group we performed a bivariate logistic regression analysis. The resulting Wald Statistics as shown in Table 4 indicated that each of the indepen-dent variables was highly statistically significant. The pattern of the logistic regression analysis changed little from one year to the next. The probability of being in the SiC group, i.e. being among the 30% of individuals with the highest DMFT scores was related to being older (OR between 1.6-1.9), being female (OR around 2.0), being Hispanic (OR around 2.0) or Black (OR between 1.4-1.8), residing in a non-fluoridated commu-nity (OR between 1.8-2.8) or being non-insured (OR between 2.0 - 2.4) (Table 5).
Discussion
This study investigated the caries prevalence and sever-ity trends in Nevada youth using both the mean DMFT index and the SiC Index. The use of DMFT has been an accepted practice for assessing the prevalence and sever-ity of caries in a population [4]. However the epidemio-logic changes in the dental caries picture during the last 2-3 decades, have made it increasingly evident that mean DMFT values do not capture the polarized caries development with a more skewed distribution of caries [8]. Mean DMFT values are an average of all members of the population, irrespective of the distribution of the severity of the disease within the population.
Mean DMFT Trends
Eight years of oral health screening data were collected through the Oral Health Surveillance Initiative across the state of Nevada, with over 62,000 adolescents
participating. The mean DMFT from these data, com-pared to national NHANES data confirmed that dental caries remains a common chronic disease among Nevada youth, and that Nevada youth present with higher prevalence rates and greater mean DMFT indices than the national average (Table 2) [4]. Where the NHANES study reported a prevalence of around 51% among the younger group and around 67% in the older group [4] we found 65% and 77% respectively (Figure 2). Furthermore, because this sample was assessed using a modified protocol, data from this study may be an underestimate of caries prevalence compared to NHANES data. Improvements were found in mean DMFT scores across all demographics compared (age, sex, race group, whether residing in fluoridated area, and dental insurance status) between year 1 and year 6 with the exception ofyear 3. However since year six, there has been a trend towards more caries and less car-iesfree individuals in all demographics (Figures 1, 2, 3). Although dental caries is largely preventable, it remains the most common chronic disease of children aged 6 to 11 years (25%) and adolescents aged 12 to 19 years (59%) [4,18,19]. Additionally, certain segments of the population (e.g., members of racial or ethnic minority groups, sex, and older children) have more dental decay, much of which remains untreated [18,20,21].
SiC Index Trends
The same eight year data set was used to compute the SiC Index. As expected, the SiC Index was significantly higher in all comparisons with DMFT (p < 0.001). A comparison between the two indices, indicated there is a large Nevada youth population subgroup that pre-sented with a significantly higher caries rate than the targeted mean DMFT score of 3.0 [1]. The Mean DMFT score for Nevada youth, although higher than the national average and in some of the subgroups higher than the targeted 3.0 mean DMFT, demonstrates how skewed the present caries problem is and does not reflect the true extent of caries prevalence or severity in all subgroups of the population. In fact, the mean of the highest caries scorers is close to three times the popula-tion mean. Recently, Sheiham et al. [22] have pointed
Table 4 Wald statistics outcome after logistic regression analysis
Variable Year 1 Year 2 Year 3 Year 4 Year 5 Year 6 Year 7 Year 8
Age 20.73* 49.50** 62.50** 28.40** 68.90** 87.81** 91.90** 84.10**
Sex 16.96* 14.83* 24.20** 12.90* 22.59** 12.52* 14.13* 28.40**
Race 18.81* 98.40** 45.56** 40.60** 62.40** 48.78** 60.12** 75.14**
Fluoridation 45.08** 14.64* 14.80* 19.80* 16.20* 12.87* 23.10** 19.81*
Insurance N/A 18.50* 17.96* 11.50* 19.40* 12.50* 29.68** 19.20*
out that caries patterns seem to exist in subgroups of a population with those groups remaining at a stable rela-tive position to each other even when prevalence changes over time. This pattern seems to be reflected in this study. It is of note that the present population is in fact 8 populations of the same age studied over eight years sequentially. In no instance is any specific sub-group found to be veering away from its pattern of den-tal caries or crosses into the pattern of another group. For instance, the younger group remains at the lower level of dental caries and even improves through increasing rates of freedom of caries. With regard to racial background, the white examinees remain at the lowest caries level of the racial groups.
The use of the SiC Index that includes DMFT can elucidate interpretations of findings, especially in situa-tions where resources are limited for intervensitua-tions. While mean scores provide a good measure of popula-tion disease levels, it is important to also look at those who might be carrying a significant burden of the den-tal disease experience in the population. To help in identifying high risk groups, it is recommended to cal-culate the SiC Index at several levels. It has been sug-gested that a SiC goal be established so that public health professionals can have 2 goals: mean DMFT and SiC Index. One [10] suggested a SiC of less than 3.0 in 12-year-old children as a global oral health goal to be achieved by the year 2015, while another sug-gested that a SiC global goal of less than 5.0 be set for 15-year olds rather than the WHO targeted age of 12-year olds [23].
Interpretation of Trends
Downward trends were found in both Mean DMFT scores and SiC Indices across all demographics com-pared (age, sex, race group, whether residing in fluori-dated area, and dental insurance status) between year 1 and year 6 with the exception of year 3. Althought these trends were parallel, the SiC Indicies were significantly higher than the mean DMFT Index across all years. Since year six, there has been an upward trend in all demographics (Figures 1, 2, 3). Data showed that minor-ity children had higher prevalence of caries. Research demonstrates that minority children are more likely to experience tooth decay and have their cavities untreated [18]. Because children of color are the fastest growing subpopulation of children in the U.S., their higher caries experience predicts an upturn in disease prevalence over the coming years unless special efforts are made to address their oral health needs [18].
Community water fluoridation has been ranked as one of the ten great public health achievements of the 20th century [18,24,25]. Healthy People 2010objectives seek to eliminate health disparities ensuring that all Ameri-cans receive the benefits of good oral health. Commu-nity-based programs, such as community water fluoridation are cost-effective ways to achieve this goal [24,25]. This study found that those children living in communities with fluoridated municipal water supplies experience substantially lower mean DMFT scores. This has special importance in Nevada where attempts to expand the fluoridation program to counties other than Clark County have met with considerable resistance.
Table 5 Caries severity among Nevada adolescents
Variable Year 1 OR (CI) Year 2 OR (CI) Year 3 OR (CI) Year 4 OR (CI) Year 5 OR (CI) Year 6 OR (CI) Year 7 OR (CI) Year 8 OR (CI)
Age
13-15 * * * * * * * *
16-19 1.95 (1.79-2.05) 1.68 (1.45-1.75) 1.66(1.62-1.89) 1.641.22-1.82) 1.64(1.57-1.71) 1.59(1.53-1.66) 1.87(1.42-2.05) 1.68(1.44-1.79) Sex
Male * * * * * * * *
Female 2.04(1.78-2.35) 1.86(1.76-1.95) 1.85(1.75-1.89) 1.98(1.75-2.24) 1.92(1.76-2.15) 2.23(1.88-2.57) 2.43(1.67-2.84) 1.98(1.56-2.34) Race
White, NH * * * * * * * *
Black, NH 1.75(1.67-1.85) 1.82(1.77-1.97) 1.75(1.49-1.97) 1.74(1.62-1.76) 1.68(1.60-1.75) 1.66(1.59-1.74) 1.45(1.29-1.70) 1.59(1.42-1.78) Hispanic 1.96(1.67-2.03) 2.34(1.82-2.68) 1.96(1.82-1.13) 2.05(1.75-2.58) 1.96(1.82-1.13) 1.98(1.73-2.33) 1.87(1.65-2.05) 2.33(1.82-2.87) Fluoridation
Clark County * * * * * * * *
All others 2.76(1.76-2.85) 1.86(1.67-2.04) 1.76(1.67-1.89) 2.13(1.93-2.43) 1.92(1.88-2.11) 1.97(1.49-2.17) 2.04(1.75-2.17) 2.05(1.68-2.57) Insurance
Insured N/A * * * * * * *
Non-insured N/A 1.97 (1.82-1.34) 2.12(1.96-2.37) 1.96(1.82-2.15) 2.02(1.87-2.14) 1.99(1.28-2.34) 2.38(1.80-2.87) 2.01(1.69-2.77)
Inadequate access to dental care for children of low-income families may be largely due to lack of dental insurance [26]. In one study, subjects without dental insurance were 20-40% more likely to present with higher mean DMFT indices than those with insurance [26]. Despite improvements in children’s oral health through prevention, dental caries remained the most common chronic childhood disease in the US during the twentieth century [26].
A report released by the CDC [18] in 2002 reported a 15.2% increase in disease among the nation’syoungest children ages 2 through 5 years. Because tooth decay in the primary teeth predicts future tooth decay in perma-nent teeth, the upturn in caries experience in preschoo-lers could be expected to continue in permanent teeth. A recent epidemiologic review found that in many coun-tries there is a marked increase in dental caries preva-lence that affects both children and adults [27]. This could partially explain the upward trend in caries preva-lence observed in this study from early 2000. Overall this study found that older adolescents, those of racial groups, those who live in non-fluroidated areas, and those with-out dental insurance all experienced higher mean DMFT scores in all years included in this report. The trend line for each of the comparison groups was similar (Figures 2, 3, 4). With reference to the previous part of the discus-sion we would expect that the relative stability of the sub-groups in a special caries pattern could be used to conduct an early identification of the children with the highest caries prevalence and incidence, because they would be considered a special risk group for ending up in late adolescence with considerably higher caries rates than the remainder of the population.
Limitations and Future Recommendations
Self-reports warrant some caution in interpreting those data. However, data collection and entry protocols were well documented and quality control guidelines were implemented during the oral health screening process throughout the time span reported. Due to confidential-ity issues, students could not be tracked over time pre-venting longitudinal data collection, therefore to help strengthen the data; analysis of cross sectional data across all years by school was examined to reduce the likelihood of repeat students. Since the sample was so large, assumptions could be made that all would have access to similar secondary fluoride influence, for exam-ple all would have access to fluoride toothpaste, as well as water that contains fluoride. Inclusion of these other potential sources of fluoride supplementation may influ-ence these results. While this study focused on compari-sons of results using traditional calculations of mean DMFT and the Significant Caries Index, it doesn’t make comparisons between those who are cariesfree and
those with the highest reported mean DMFT. Future reports may examine these differences for more in-depth interpretations.
Conclusions
The series of sequentially conducted epidemiologic stu-dies demonstrated that downward trends were found in both mean DMFT scores and SiC Indices across all demographics compared (age, sex, race group, whether residing in fluoridated area, and dental insurance status) between year 1 and year 6. Since year six, there has been an upward trend in all demographics. An increas-ing divergence in caries prevalence was found between younger and older adolescents and between individuals of white and all other racial backgrounds. The mean DMFT values did not accurately reflect the skewed dis-tribution of dental caries in Nevada youth leading to incorrect conclusions that the caries rate for the state-wide population is under control. The data indicate there is a large proportion of adolescents in Nevada with poor oral health status, which only seems to improve very slowly. Decreasing caries prevalence in all countries is important to promote overall general health. The probability of ending up in the high caries group was consistently related to being older, being female, being Hispanic or Black, residing in a non-fluoridated community, and not having insurance cover.
Findings from this study should aid in two ways. At the community level, the study strongly points to the impor-tance of retaining and expanding the community fluori-dation program as an effective preventive measure. At the individual level the study identifies the need for more targeted efforts to reach children early with a focus on females, Hispanics and Blacks, and uninsured children.
Acknowledgements
Crackdown on Cancer Oral Health Surveillance Screening Programreceives funding through the Trust Fund for Public Health and The Fund for Healthy Nevada, both beneficiaries of the Master Tobacco Settlement.
Author details
1UNLV School of Dental Medicine, 1001 Shadow Lane, MS 7425, Las Vegas,
NV 89106, USA.2University of Sydney, Faculty of Dentistry, Population Oral
Health, USA.3Oregon Health & Science University, School of Dentistry,
Portland, OR, USA.
Authors’contributions
MD, GD, and CM have been engaged in the multi-year development of the surveillance program, including developing the protocols and guidance for examiners, data collection as well as ongoing quality control. MD performed the statistical analysis in collaboration with ES. The paper was drafted by MD, ES, ED, and CM contributed to its completion. All authors have read and approved the final manuscript.
Competing interests
The authors declare that they have no competing interests.
References
1. World Health Organization:Oral Health Information Systems: Oral Health Surveillance.[http://www.who.int/oral_health/action/information/ surveillance/en/], Accessed on November 9, 2010.
2. Petersen PE, Bourgeois D, Ogawa H, Estupinan-Day S, Ndiaye C:The global burden of oral diseases and risks to oral health.Bull World Health Organ 2005,83(9): 661-69.
3. Office of the Surgeon General:Oral Health 2000: Facts and Figures[http:// www.surgeongeneral.gov/library/oralhealth/], Accessed on February 20, 2011.
4. Dye BA, Tan S, Smith V, Lewis BG, Barker LK, Thornton-Evans G,et al:Trends in oral health status: United States, 1988-1994 and 1999-2004.National Center for Health Statistics. Vital Health Stat 11 (248)Hyattsville, MD; 2007, DHHS Publication No. (PHS) 2007-1698,.
5. World Health Organization:Oral Health Fact Sheet No. 318.2007 [http:// www.who.int/mediacentre/factsheets/fs318/en/print.html], Accessed on November 9, 2010.
6. U.S. Department of Health and Human Services, Public Health Service:Oral Health Progress Review.2008 [http://www.healthypeople.gov/2010/data/ midcourse/pdf/fa21.pdf], Accessed on February 20, 2011.
7. Centers for Disease Control and Prevention, National Center for Chronic Disease Prevention and Health Promotion, Division of Oral Health, Children’s Oral Health. 2004 [http://www.cdc.gov/oralhealth/publications/ factsheets/dental_caries.htm], Accessed onFebruary 20, 2011.
8. World Health Organization:Significant Caries Index.2010 [http://www. whocollab.od.mah.se/sicdata.html], Accessed on November 9, 2010. 9. Campus G, Solinas G, Maida C, Castiglia P:The‘Significant Caries Index’
(SiC): A Critical Approach.Oral Health Prev Dent2003,1(3): 171-78. 10. Bratthall D:Introducing the Significant Caries Index together with a
proposal for a new global oral health goal for 12-year-olds.Int Dent J 2000,50: 378-84.
11. Nishi M, Stjernsward J, Carlsson P, Bratthal D:Caries experience of some countries and areas expressed by the Significant Caries Index. Community Dent Oral Epidemiol2002,30: 296-301.
12. Antunes JL, Narvai PC, Nugent ZJ:Measuring inequalities in the distribution of dental caries.Community Dent Oral Epidemiol2004,32: 41-8.
13. Shrout PE, Fleiss JL:Intraclass correlations: uses in assessing rater reliability.Psychol Bull1979,86: 420-8.
14. Radike AW:Criteria for diagnosing dental caries.Proceedings of the Conference on the Clinical Testing of Cariostatic AgentsChicago, IL: American Dental Association; 1968, 87-88.
15. Assaf AV, Meneghim MC, Zanin L, Mialhe FL, Pereira AC, Ambrosano GMB: Assessment of different methods for diagnosing dental caries in epidemiological surveys.Community Dent Oral Epidemiol2004,32: 418-25. 16. Klein H, Palmer CE, Knutson JW:Studies on dental caries. Dental status
and dental needs of elementary school children.Pub Health Rep1938,53: 751-765.
17. Warner RM:Applied Statistics: From Bivariate through Multivariate Techniques Los Angeles, CA: Sage Publications; 2007.
18. Centers for Disease Control and Prevention (CDC):Preventing Dental Caries with Community Programs.2009 [http://www.cdc.gov/oralhealth/ publications/factsheets/dental_caries.htm], Accessed on November 9, 2010. 19. Centers for Disease Control and Prevention:Surveillance for dental caries,
dental sealants, tooth retention, edentulism, and enamel fluorosis– United States, 1988-1994 and 1999-2002.Surveillance Summaries2005, MMWR 2005:54(No. SS-3).
20. Reisine ST, Psoter W:Socioeconomic status and selected behavioral determinants as risk factors for dental caries.J Dent Educ2001,65: 1009-16.
21. Reid BC, Hyman JJ, Macek MD:Race/ethnicity and untreated dental caries: the impact of material and behavioral factors.Community Dent Oral Epidemiol2004,32: 329-36.
22. Sheiham A, Sabbah W:Using universal patterns of caries for planning and evaluating dental care.Caries Res2010,44: 141-150.
23. Marthaler T, Menghini G, Steiner M:Use of the Significant Caries Index in quantifying the changes in caries in Switzerland from 1964 to 2000. Community Dent Oral Epidemiol2005,33: 159-166.
24. Centers for Disease Control and Prevention:Surgeon General’s Statement on Community Water Fluoridation.2004 [http://www.cdc.gov/fluoridation/ fact_sheets/sg04.htm], Accessed on November 9, 2010.
25. Division of Oral Health, National Center for Chronic Disease Prevention and Health Promotion. Achievements in Public Health, 1900-1999:Fluoridation of Drinking Water to Prevent Dental Caries.MMWR1999,48(41): 933-940. 26. Mouradian WE, Wehr E, Crall JJ:Disparities in Children’s Oral Health and
Access to Dental Care.JAMA2000,284: 2625-2631.
27. Bagramian RA, Garcia-Godoy F, Volpe AR:The global increase in dental caries. A pending public health crisis.Am J Dent2009,22(1): 3-8.
Pre-publication history
The pre-publication history for this paper can be accessed here: http://www.biomedcentral.com/1472-6831/11/12/prepub
doi:10.1186/1472-6831-11-12
Cite this article as:Ditmyeret al.:Inequalities of caries experience in Nevada youth expressed by DMFT index vs. Significant Caries Index (SiC) over time.BMC Oral Health201111:12.
Submit your next manuscript to BioMed Central and take full advantage of:
• Convenient online submission
• Thorough peer review
• No space constraints or color figure charges
• Immediate publication on acceptance
• Inclusion in PubMed, CAS, Scopus and Google Scholar
• Research which is freely available for redistribution