KinSNP software for homozygosity
mapping of disease genes using
SNP microarrays
El-Ad David Amir,1Ofer Bartal,1Efrat Morad,2Tal Nagar,4Jony Sheynin,3Ruti Parvari3,4and Vered Chalifa-Caspi4*
1Department of Computer Science, Ben-Gurion University of the Negev, Beer-Sheva 84105, Israel
2Department of Life Sciences, Ben-Gurion University of the Negev, Beer-Sheva 84105, Israel
3Department of Developmental Genetics and Virology, Ben-Gurion University of the Negev, Beer-Sheva 84105, Israel
4National Institute of Biotechnology in the Negev, Ben-Gurion University of the Negev, Beer-Sheva 84105, Israel
*Correspondence to: Tel: þ972 8 6479034; Fax:þ972 8 6472983; E-mail: [email protected]
Date received (in revised form): 28th August 2010
Abstract
Consanguineous families affected with a recessive genetic disease caused by homozygotisation of a mutation offer a unique advantage for positional cloning of rare diseases. Homozygosity mapping of patient genotypes is a powerful technique for the identification of the genomic locus harbouring the causing mutation. This strategy relies on the observation that in these patients a large region spanning the disease locus is also homozygous with high probability. The high marker density in single nucleotide polymorphism (SNP) arrays is extremely advantageous for homozygosity mapping.
We present KinSNP, a user-friendly software tool for homozygosity mapping using SNP arrays. The software searches for stretches of SNPs which are homozygous to the same allele in all ascertained sick individuals. User-specified parameters control the number of allowed genotyping ‘errors’ within homozygous blocks. Candidate disease regions are then reported in a detailed, coloured Excel file, along with genotypes of family members and healthy controls. An interactive genome browser has been included which shows homozygous blocks, individual genotypes, genes and further annotations along the chromosomes, with zooming and scrolling capabilities. The software has been used to identify the location of a mutated gene causing insensitivity to pain in a large Bedouin family. KinSNP is freely available from http://bioinfo.bgu.ac.il/bsu/software/kinSNP.
Keywords:autozygosity, consanguinity, genetic mapping, homozygosity, SNP microarrays, software
Introduction
The availability of high-density mapping microar-rays, bearing sufficient probes to analyse 10,000 – 1,000,000 single nucleotide polymorphisms (SNPs) in one assay, offers an efficient alternative to tra-ditional, microsatellite-based, genome-wide linkage scans.1 Accordingly, several public linkage software programs have been developed, such as Allegro, EasyLinkage and dChip, which can handle the high number of SNPs in these arrays. All of these have
been successfully used for mapping Mendelian dis-orders.2 – 4
linkage analysis of SNP arrays in these studies is highly problematic, however, due to the compu-tational load needed to deal with both the large number of SNPs and the family structure. The presence of complex inbreeding loops makes it extremely difficult to reconstruct genetic data from untyped individuals. Current linkage programs designed to deal with this challenge (eg SuperLink7 and SimWalk28) are not suited for the large number of markers present in SNP arrays. The latter programs may be used if adjacent SNPs are grouped and regarded as one marker (eg Naveed
et al.9); however, this causes great loss of the infor-mation available in the high-density array.
A powerful alternative to linkage analysis, which has long been used in studies of autosomal recessive diseases in consanguineous pedigrees, is homozy-gosity (or autozyhomozy-gosity) mapping.10,11 This strategy relies on the fact that in a child of a consanguineous marriage affected with a homozygous recessive genetic disease mutation, a large region spanning the disease locus is probably also homozygous. Thus, searching for regions that are consistently homozygous by descent in all affected individuals would be expected to provide a suitable strategy for mapping the recessive gene mutation. Moreover, the use of SNP arrays is extremely advantageous for homozygosity mapping, compared with microsatel-lites, because of the much higher density of markers they comprise. For economic reasons, a common strategy is to perform homozygosity mapping using SNP arrays for a small number of sick individuals, with or without their healthy parents or siblings. Once candidate regions are found, they are then further analysed using micro-satellite markers in a large number of family members, where all of the affected and none of the unaffected members should be homozygous to the same allele.12 – 19 In the future, SNP typing or tar-geted sequencing could be used for fine-mapping. Subsequently, linkage logarithm of odds (LOD) scores are calculated using genetic programs such as SuperLink or SimWalk2.
The ever-increasing number of markers in the SNP arrays makes it unfeasible to locate homozy-gous regions by manual inspection of the genotype
file, as used to be done with microsatellite data. At the time of writing, only two public software pro-grams, ExcludeAR20 and AutoSNPa,21 were avail-able for automated homozygosity analysis of SNP arrays.
We present KinSNP, a new software tool for homozygosity mapping in SNP arrays from consan-guineous families, which provides additional capa-bilities compared with existing software while simplifying program usage. KinSNP can be run on any computer through intuitive menus and dialo-gues. It directly accepts Affymetrix files as input, whereas files from Illumina or other platforms may be easily converted to the KinSNP format. The user has considerable control over the parameters that define the reported homozygous regions, allowing, for example, various degrees of stringency for tolerating genotyping errors. KinSNP results are provided both as coloured, linked Excel files and as an interactive genome browser, on which results from multiple analyses may be visualised simultaneously.
In the present study, KinSNP software was used to identify the location of the mutated gene causing insensitivity to pain (IP) in a large Bedouin family.
Results
Outline of KinSNP
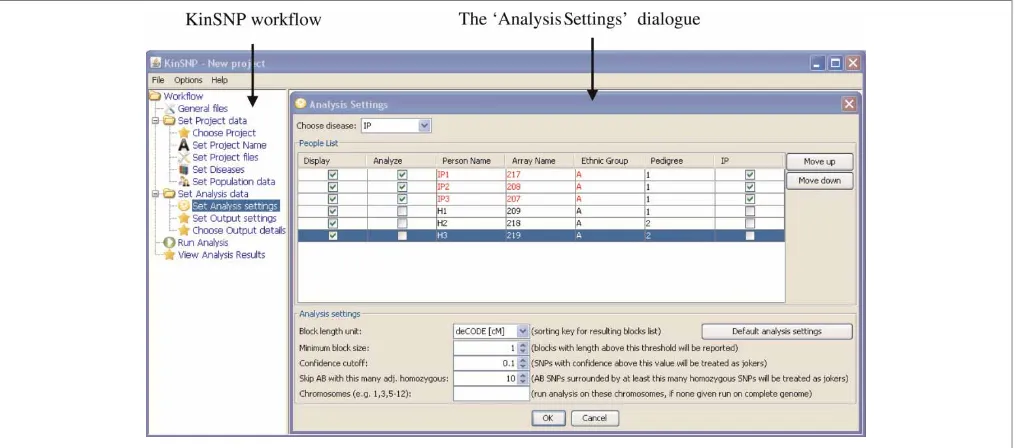
individuals from the same population studied for other diseases in our group were added as healthy controls for IP. This inspired us to enable KinSNP to receive all of a laboratory’s or a core facility’s microar-ray genotypes at once, and be subsequently used iteratively to look for homozygous regions in any selected set of sick individuals with any combination of analysis parameters. Program execution is carried out through an intuitive guide, which leads the user through the analysis workflow (Figure 2, left-hand panel). Eventually, the candidate disease regions are provided both as a textual, sorted list (Figure 3), as well as a visual representation in the context of the entire genome (Figures 4, 5).
KinSNP analysis workflow
The analysis of microarray data often requires step-wise formatting and combining of multiple files in various formats. To simplify this step, KinSNP requires only two input files: (i) an array-specific annotation file, containing SNP identifications accompanied by their genetic and physical positions and (ii) a genotype file, containing SNP genotype and confidence calls from all typed individuals. Instructions on the exact format of these simple tab-delimited text files are available on the KinSNP website. KinSNP is also able to directly accept files produced by Affymetrix genotype calling programs (GTYPE, Genotyping Console), as well as Affymetrix annotation files (downloadable from http://www.affymetrix.com/support/technical/ byproduct.affx?cat=software). Illumina data may be converted for use by KinSNP through a dedicated script available at the KinSNP website.
Once the input files are loaded into KinSNP, the user is allowed to associate a name, a disease state, a family and an ethnic group to each array included in the genotype file. This step of defining the ‘population’ accomplishes the one-time ‘project’ description, after which the user may perform any number of specific homozygosity analyses on any of the diseases and subsets of individuals.
Figure 2. KinSNP user interface. Further details are provided in the text.
The parameters for the homozygosity analysis are specified in the ‘Analysis Settings’ window shown in detail in Figure 2. The user should specify the studied disease, choose the specific chips (individ-uals) in which to look for shared homozygous regions and denote which other individuals to show in the output as controls for manual inspection. The reported ROSHs can then be sorted according to one of several possible length units, such as number of SNPs, physical length and genetic recombination length according to deCODE, Marshfield or SNP Linkage Map (SLM1) genetic maps. (Information about these maps and their extrapolation to obtain SNP positions is available in the README file that accompanies Affymetrix annotation files.) In addition, the user can specify a length threshold above which ROSHs will be reported because this may differ between homozygosity projects. The more related the individuals and the fewer there are, the longer the ROSHs that can be expected to be found. For example, brothers are expected to share longer ROSHs than cousins; a longer ROSH is expected to be shared by two patients than by three patients etc. Additionally, the more recent the mutation and the higher the consanguinity, the longer the ROSHs expected. The parameters ‘Confidence cutoff ’ and ‘Skip AB with this many adj. homozygous’ control the number of allowed errors within ROSHs and are explained in the next section. For faster computation, the user may limit the analysis to specific chromosomes only.
After pressing ‘OK’, the user is asked to specify output file names and locations, and analysis may be started.
Homozygosity analysis algorithm
First, KinSNP merges positional information from the annotation file with the genotype data and sorts the genotypes by SNP physical locations. Starting with the first SNP, the algorithm checks whether all sick individuals are homozygous to the same allele; if not, it proceeds to the next SNP. If the individuals share homozygosity, a new ROSH is started. The ROSH is extended as long as homo-zygosity is shared. Under the most stringent
parameters, once a heterozygous SNP or a non-shared homozygous SNP for the other allele are encountered, the ROSH is terminated and stored. The algorithm then continues to proceed along the chromosome until it encounters another SNP with shared homozygosity. It then starts a new ROSH and so forth, until the end of the chromosome is reached.
A more permissive operation of KinSNP allows for occasional non-shared alleles within ROSHs. The degree of permissiveness may be heuristically adjusted via two parameters in the KinSNP Analysis Settings window, which take into account the call confidence and the scarcity of the non-shared allele.
The first parameter, ‘Confidence cutoff ’, makes use of the confidence values attributed to each of the genotype calls. To understand this parameter, let us first explain the ‘NoCall’ genotypes. By default, SNP calls designated as ‘NoCall’ in the KinSNP input file are ignored during the process of ROSH identifi-cation. Thus, a ‘NoCall’ at a certain SNP will be treated as AA or as BB if this will cause the SNP to be considered homozygous among all individuals selected for analysis. The designation of SNPs as ‘NoCalls’ is usually applied by the genotype calling program (eg Affymetrix’s Genotyping Console) if the SNP confidence value did not pass a certain cut-off. KinSNP enables the user to change that cut-off by specifying another confidence threshold above which SNP calls will be effectively regarded as ‘NoCalls’ in ROSH definition. Unlike ‘NoCalls’, however, these SNPs will be shown in KinSNP Excel output files with their original genotype call, though coloured with a lighter colour than the others (see for example Figure 4).
The second parameter, ‘Skip AB with this many adjacent homozygous’, was introduced as we found that heterozygous SNPs — even with high confi-dence calls — sometimes ‘break’ genuine homozy-gous blocks, probably due to erroneous reading. This parameter enables one to ignore heterozygous SNP calls which are surrounded by a ‘window’ of a user-specified number of SNPs which all apply to the criteria of the ROSH.
genotypes, not only improve the homozygosity analysis, but also enable inclusion in the analysis of low-quality arrays (eg ,90 per cent call rate) which otherwise could not be analysed.
Viewing KinSNP results
KinSNP output may be viewed either as a set of sty-lised Excel files or in an interactive genome browser. The Excel files enable the user to further sort, mark and annotate the results using the standard Excel interface. The browser enables scrolling and zooming along the chromosomes, thus visually identifying recombination patterns flanking the reported ROSHs and estimating their likelihood as disease-related regions. We will demonstrate KinSNP output by describing the IP disease gene mapping.
Excel output
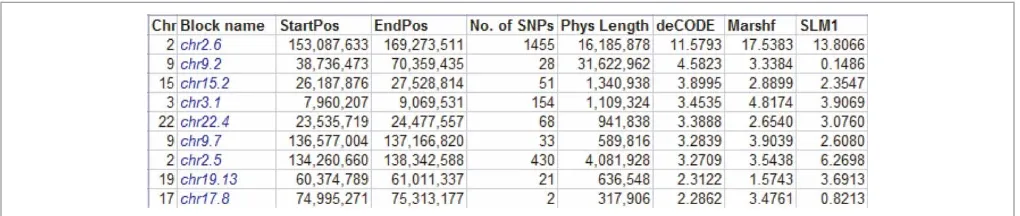
KinSNP creates a summary file which outlines all the found ROSHs longer than the user-specified threshold, along with their chromosomal position, number of consecutive SNPs and physical and genetic lengths (Figure 3). After sorting the ROSHs according to the desirable length unit, the IP analysis revealed a 11 – 17 centimorgan (cM) (16 Mb)-long block comprising 1,455 consecu-tive SNPs in chromosome 2. Clicking the acconsecu-tive link in the block name opens the chromosome-specific Excel file (Figure 4), right at the top of the relevant block. In this file, genotypes of all SNPs of the chromosome are shown in the order of the SNPs’ physical positions, accompanied by the SNP annotation retrieved from the annotation input file.
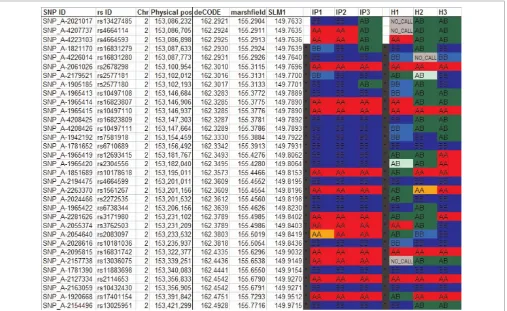
Genotype calls from the selected sick individuals appear first, with reported ROSHs delineated by black vertical bars. Genotypes of control individuals are shown further to the right. Heterozygous SNPs are coloured in green and homozygous SNPs are coloured in red (AA) or blue (BB), respectively, such that the allele in lower alphabetical order is the A allele and the other allele is the B allele. Low-confidence calls, based on user-specified con-fidence cut-off, are coloured in light green, orange or light blue, for AB, AA or BB, respectively.
The Excel display allows the user to judge how informative the ROSHs are by comparing the degree of homozygosity of the ROSHs in the sick individuals with the degree of heterozygosity in the control individuals. SNPs or blocks which are homozygous across both sick and healthy individ-uals should be considered non-informative. Note that one bordering non-ROSH SNP (eg SNP_A-1821170 in Figure 3) is included at each end of the reported ROSH, since the disease-causing mutation may in principle be located between that SNP and the extreme ROSH SNP. Users may also scroll above and below the reported ROSHs to see whether several adjacent ROSHs can actually be merged, and to get an impression of the recombina-tion patterns flanking the ROSHs. These tasks are more easily performed using the included Integrated Genome Browser (IGB), however.
The Integrated Genome Browser
In the IP analysis shown here, one ROSH was found to stand out from all the others, being much
longer in both physical and genetic length, as well as having a greater number of SNPs. When there are several possible ROSHs, however, additional means are required to prioritise the ROSHs as can-didate regions harbouring the disease-causing mutation. One way is to consider the degree of kinship among the ascertained individuals, and to check whether closer relatives indeed share longer ROSHs than those shared by all patients together. This is achieved by providing an informative visual-isation of the ROSHs, along with genotypes of sick and control individuals, in a more compact and yet resizable view of the chromosomes. To this end, we have integrated with KinSNP a slightly simplified version of Affymetrix’s IGB (http://www.affymetrix. com/support/developer/tools/download_igb.affx), whose source code is covered by the common public licence. By choosing KinSNP’s ‘View Analysis Results’ option (Figure 2, left-hand panel), the IGB opens right away, with an option to add
tracks for the reported blocks and for coloured gen-otypes of the analysed individuals (Figure 5). University of California Santa Cruz (UCSC) gene predictions based on data from RefSeq, Genbank and UniProt are displayed by default, but additional genome annotations may be easily loaded to IGB from a variety of public and private databases, including, for example, RefSeq and Genbank mRNAs, GenScan gene predictions, microRNAs, Affymetrix probes from various array types, etc. The major advantage of the IGB for viewing KinSNP results is the possibility of navigating easily along the chromosomes and of zooming in and out of areas of interest. For example, in the IP ROSH hosting the
SCN9A gene (Figure 5), it is possible to see the longer ROSH shared by the sisters IP1 (217) and IP2 (208) (on the left-hand side), overlapping with the shorter homozygous stretch shared with their half-sister IP3 (207). Once again, although the present KinSNP computed analysis does not
consider the family tree in prioritising the reported blocks, the user may use knowledge of kinship between the ascertained individuals in combination with the IGB visualisation to estimate the reliability of each of the reported ROSHs.
The information which IGB uses to draw the block positions (Figure 5, ‘ROSHs’ track, shown as light blue rectangles) is read from a special text file created by KinSNP and stored in the same local directory as the Excel files. This file has a standard format, called a general feature format (GFF), and is recognised by its ‘.gff ’ extension. Once the IGB is open (often with the results of the most recent analy-sis), it is possible to load on top of it additional .gff files created in previous analyses. For example, if patients from two families were initially analysed sep-arately and then all together, or if closely related patients were analysed and then more distant ones were added, computed blocks from all analyses may be displayed together in the same IGB view and compared visually. This option is also relevant when KinSNP is executed iteratively with different analysis parameters, such as minimal block lengths or confi-dence cut-off.
Finally, it is possible to load computational results from other genome-related experiments, expressed as binary or numerical values attributed
to individual genomic positions or intervals, into the IGB on top of any existing display. These may include, for example, gene expression data, copy number variation data, measures of conservation between different genomes, etc. This allows straightforward integration of homozygosity analysis results with related custom or public experimental data.
Discussion
KinSNP software greatly facilitates homozygosity analysis of high-throughput SNP genotypes from consanguineous families, and may serve as an effi-cient starting point for further microsatellite-based fine mapping of candidate regions using classical linkage analysis. Moreover, the possibility of identi-fying homozygous blocks could be useful for the identification of a de novo mutation occurring in a recent generation in the general population. In such a case, homozygotisation of the mutation may occur in a patient owing to a founder effect, even if kinship is unknown to the family.
Unlike the two existing equivalent software tools, ExcludeAR and AutoSNPa, reported ROSHs are defined by customised criteria, which consider genotype call confidence and allow for
sporadic heterozygotes within specified-length windows of shared homozygosity. Additionally, block sizes are specified by physical length, dis-tances according to several genetic maps and number of SNPs. Data import is easy and, for Affymetrix arrays, does not require any prior manipulation of the genotype or annotation files. KinSNP output presents the ROSHs within the context of entire chromosomes, using Excel files as well as an interactive genome browser. In future versions of KinSNP, we plan to provide additional visualisations — such as continuous plots along the chromosomes designating the degree of shared homozygosity in each position, and its comparison with that of the healthy controls.
Acknowledgments
This research was supported by a research grant from the National Institute for Biotechnology in the Negev.
References
1. Gibbs, J.R. and Singleton, A. (2006), ‘Application of genome-wide single nucleotide polymorphism typing: Simple association and beyond’,
PLoS Genet.Vol. 2, p. e150.
2. Gudbjartsson, D.F., Thorvaldsson, T., Kong, A., Gunnarsson, G.et al. (2005), ‘Allegro version 2’,Nat. Genet.Vol. 37, pp. 1015 – 1016. 3. Hoffmann, K. and Lindner, T.H. (2005), ‘easyLINKAGE-Plus —
Automated linkage analyses using large-scale SNP data’, Bioinformatics
Vol. 21, pp. 3565 – 3567.
4. Leykin, I., Hao, K., Cheng, J., Meyer, N. et al. (2005), ‘Comparative linkage analysis and visualization of high-density oligonucleotide SNP array data’,BMC Genet.Vol. 6, p. 7.
5. Sheffield, V.C., Stone, E.M. and Carmi, R. (1998), ‘Use of isolated inbred human populations for identification of disease genes’, Trends Genet.Vol. 14, pp. 391 – 396.
6. Jorde, L.B., Watkins, W.S., Kere, J., Nyman, D. et al. (2000), ‘Gene mapping in isolated populations: New roles for old friends?’Hum. Hered.
Vol. 50, pp. 57 – 65.
7. Fishelson, M. and Geiger, D. (2002), ‘Exact genetic linkage computations for general pedigrees’,BioinformaticsVol. 18 (Suppl. 1), pp. S189 – S198.
8. Sobel, E. and Lange, K. (1996), ‘Descent graphs in pedigree analysis: Applications to haplotyping, location scores, and marker-sharing stat-istics’,Am. J. Hum. Genet.Vol. 58, pp. 1323 – 1337.
9. Naveed, M., Nath, S.K., Gaines, M., Al-Ali, M.T. et al. (2007), ‘Genomewide linkage scan for split-hand/foot malformation with long-bone deficiency in a large Arab family identifies two novel susceptibility loci on chromosomes 1q42.2-q43 and 6q14.1’,Am. J. Hum. Genet.Vol. 80, pp. 105 – 111.
10. Lander, E.S. and Botstein, D. (1987), ‘Homozygosity mapping: A way to map human recessive traits with the DNA of inbred children’, Science
Vol. 236, pp. 1567 – 1570.
11. Mueller, R.F. and Bishop, D.T. (1993), ‘Autozygosity mapping, complex consanguinity, and autosomal recessive disorders’,J. Med. Genet.Vol. 30, pp. 798 – 979.
12. Broman, K.W. and Weber, J.L. (1999), ‘Long homozygous chromosomal segments in reference families from the Centre d’Etude du Polymorphisme Humain’,Am. J. Hum. Genet.Vol. 65, pp. 1493 – 1500. 13. Chandler, K.E., Del Rio, A., Rakshi, K., Springell, K. et al. (2006),
‘Leucodysplasia, microcephaly, cerebral malformation (LMC): A novel recessive disorder linked to 2p16’,BrainVol. 129(Pt 1), pp. 272 – 277. 14. Gutierrez-Roelens, I., Sluysmans, T., Jorissen, M., Amyere, M. et al.
(2006), ‘Localization of candidate regions for a novel gene for Kartagener syndrome’,Eur. J. Hum. Genet.Vol. 14, pp. 809 – 815.
15. Chiang, A.P., Beck, J.S., Yen, H.J. and Tayeh, M.K. (2006), ‘Homozygosity mapping with SNP arrays identifies TRIM32, an E3 ubi-quitin ligase, as a Bardet-Biedl syndrome gene (BBS11)’, Proc. Natl. Acad. Sci. USAVol. 103, pp. 6287 – 6292.
16. Melin, M., Entesarian, M., Carlsson, G., Garwicz, D. et al. (2007), ‘Assignment of the gene locus for severe congenital neutropenia to chromosome 1q22 in the original Kostmann family from Northern Sweden’,Biochem. Biophys. Res. Commun.Vol. 353, pp. 571 – 575. 17. Morgan, N.V., Pasha, S., Johnson, C.A., Ainsworth, J.R.et al. (2006), ‘A
germline mutation in BLOC1S3/reduced pigmentation causes a novel variant of Hermansky-Pudlak syndrome (HPS8)’, Am. J. Hum. Genet.
Vol. 78, pp. 160 – 166.
18. Smith, U.M., Consugar, M., Tee, L.J., McKee, B.M.et al. (2006), ‘The transmembrane protein meckelin (MKS3) is mutated in Meckel-Gruber syndrome and the wpk rat’,Nat. Genet.Vol. 38, pp. 191 – 196.
19. Stoetzel, C., Muller, J., Laurier, V., Davis, E.E. et al. (2007), ‘Identification of a novel BBS gene (BBS12) highlights the major role of a vertebrate-specific branch of chaperonin-related proteins in Bardet-Biedl syndrome’,Am. J. Hum. Genet.Vol. 80, pp. 1 – 11. 20. Woods, C.G., Valente, E.M., Bond, J. and Roberts, E. (2004), ‘A new
method for autozygosity mapping using single nucleotide polymorphisms (SNPs) and EXCLUDEAR’,J. Med. Genet.Vol. 41, p. e101.
21. Carr, I.M., Flintoff, K.J., Taylor, G.R., Markham, A.F. et al. (2006), ‘Interactive visual analysis of SNP data for rapid autozygosity mapping in consanguineous families’,Hum. Mutat.Vol. 27, pp. 1041 – 1046. 22. Cox, J.J., Reimann, F., Nicholas, A.K., Thornton, G.et al. (2006), ‘An
SCN9A channelopathy causes congenital inability to experience pain’,