ISSN (e): 2250-3021, ISSN (p): 2278-8719
Vol. 07, Issue 06 (June. 2017), ||V1|| PP 55-60
Statistical Downscaling Based On Multiple Linear Regression
Analysis for Temperature and Precipitation in Lidder River
Basin of India
Mehnaza Akhter
Department of Civil Engineering, NIT Srinagar, Jammu and Kashmir, India
Abstract
: In the present study multiple linear regression technique was used to carry out the downscaling of GCM predictors.The large scale GCM predictors were obtained from the Global Climate Model namely CGCM3 (Canadian Global Climate model) and were related to locally observed precipitation and temperature at Pahalgam meteorological station which is located in the Lidder River Basin.Appropriate predictand-predictor relationships were found out for the region by carrying out regression analysis. So the future projections of climate were made for the basin upto 21st century using CGCM3 model. At the end of the 21st century the mean annual temperature of theLidder river basin is predicted to increase by 1.91°C, whereas the average annual precipitation is predicted to decrease substantially by 27.56% using CGCM3 model.Keywords
: General circulation models, Downscaling, Multiple linear regression,I.
INTRODUCTION
Climate describes the average weather conditions of a certain area. Maunder (1994) hasdefined climate change as: ―a significant change in the mean values of a meteorological element during the course of a certain period of time, where the means are generally taken over periods of a decade or more‖. Like weather, climate also changes over time. Some changes occur naturally because of global climate cycles due to changes in sun’s luminosity, earth’s shifts in its orbit and the tilt of its axis, etc. Changes in climate may also take place due to anthropogenic factors such as the burning of fossil fuels resulting in increased concentrations of greenhouse gases (carbon dioxide, methane etc.). Recently, scientific attention has been focused on the idea of a changing climate as a result of suspected 'greenhouse warming' of the atmosphere and its consequent effects on our way of life. Mean temperature and precipitation are sensitive indicators of climate change.Prediction of rainfall and temperature several months in advance has long been possible by analyzing sea surface temperature and air pressure differences at key locations around the world. General Circulation Models (GCMs) have been widely used to predict the future changes in meteorological parameters such as temperature and precipitation. However, their outputs are temporally and spatially very coarse. Although these outputs are useful at continental and global levels, finer resolution outputs are needed to assess the climate change impacts on the environment and hydrological cycle at the local and regional levels. To use the local and regional scales of 0–50 km and 50 × 50 km, many methods for downscaling have been developed[2]. As climate models are not perfect, the simulated climatology will differ somewhat from observed climatology. The model state will drift towards the model climate as the forecast progresses, and this drift will be confounded by the climate evolution being predicted. For this reason, climate predictions are usually bias corrected so that it will beuseful for impact and adaptation studies.
level pressure), tempas (mean temperature at 2m), humas (specific humidity at 2m),relative humidity(rhum), zonal velocity(u), meridional velocity (v), 500 hPa geopotential height (p500), short wave radiation, long wave radiationobtained from Canadian third generation Climate Model (CGCM3) were used as predictors along with National Center for Environmental Prediction/National Center for Atmospheric Research (NCEP/NCAR) reanalysis climatic data set. The locally observed temperature and precipitation were used as predictands. The methods of multiple linear regression (MLR) and was used as downscaling techniques. The large scale GCM predictors were related to observed precipitation and temperature. It was found that the temperature of the Lidder river basin is likely to increase in the coming decades while as the precipitation is going to decrease with each coming decade.
Multiple Linear Regression
Multiple Linear Regression attempts to model the relationship between one continuous dependant variable and two or more independant variables by fitting a linear equation to observed data. Every value of the independent variable x is associated with a value of the dependant variabale y. The regression model used for prediction is given in Equation below:
𝒚 = 𝒂𝟎+ 𝒂𝟏𝒙𝟏+⋯𝒂𝒑𝒙𝒑+ 𝜺
Where, y is the dependent (or response) variable, x is independent (or predictor) variable and Ɛ is the error term.
Study Area and Data Description Study area
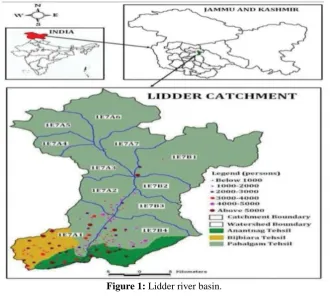
The Lidder valley in the state of Jammu and Kashmir,Indiais a Himalayan sub-valley that forms the southeastern corner of the Kashmir valley.The Lidder river flows down the valley. It originates from the Kolhoi glacier near Sonmarg at an elevation of 4653 metres and runs through an alpine meadow Lidderwat in region of Aru.It is the second major tributary of Jhelum River,Sindh River being the first one. Lidder meets Jhelum River at GurnarKhanabal at an altitude of 1615metres from sea level .Theimportant tourist destination Pahalgam is situated in the centre of Lidder valley. It has crystal blueish water and adds to the beauty of Pahalgam.It has a catchment area of 1159.38 km2 whichconstitutes about 10 per cent of the total catchment area of River Jhelum[12].The catchment area of Lidder stream occupies the south eastern part of the Kashmir valley and is situated between 33º 45′ 01″ N-34º 15′ 35″N and 74º 06′ 00″ E–75º 32′ 29″ E (Figure 1).
Data Description
Monthly precipitation and temperature data for a period of 45 years (1970-2015) for Pahalgammeteorological station in the present study has been obtained from the Central Research Institute Metrology, Pune and Regional Meteorological Station, Srinagar which is centrally located. To project the future climate of the valley GCM predictor data was required which was made available from Canadian Climate Data and Scenarios (CCDS) website http://ccds-dscc.ec.gc.ca/ and www.cccsn.ec.gc.ca/.The predictor data of the GCMs ; mslpas (mean sea level pressure), tempas (mean temperature at 2m), humas (specific humidity at 2m),relative humidity(rhum), zonal velocity(u), meridional velocity(v) , 500 hPa geopotential height (p500), short waveradiation, long wave radiation,were obtained from Canadian third generation Climate Model (CGCM3) for A1B scenario for the grid location of 32.17°N 72.31°E to 37.05°N 80.20°E.. The above mentioned predictor data were downscaled using MLR technique. For multiple linear regression (MLR) analysis the data set for the period 1970 -2009 was used for calibration and that of 2010- 2014 was used for validation purposes. Mean air temperature,relative humidity, 500 hPa geopotential height (p500), meridonial velocity and zonal velocity at differentlevels were important explainable predictors for the daily maximumand minimum temperatures. Mean sea level pressure (Mslpas), Tempas(mean air temp at 2m), 500 hPa geopotential height (p500), relative humidity and short wave radiation wereexplanatory predictors for precipitation. The MLR analysis was carried out to find the dependence relationship between temperature and precipitation and the appropriate GCM predictors.
II.
RESULTS AND DISCUSSION
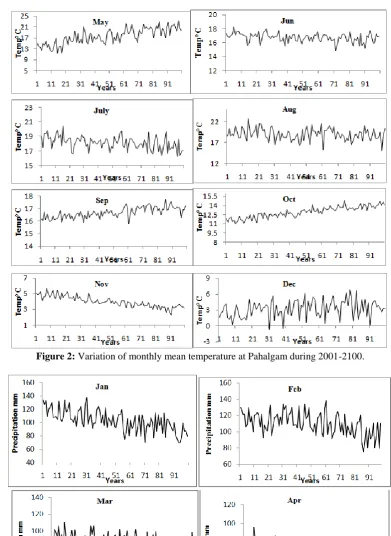
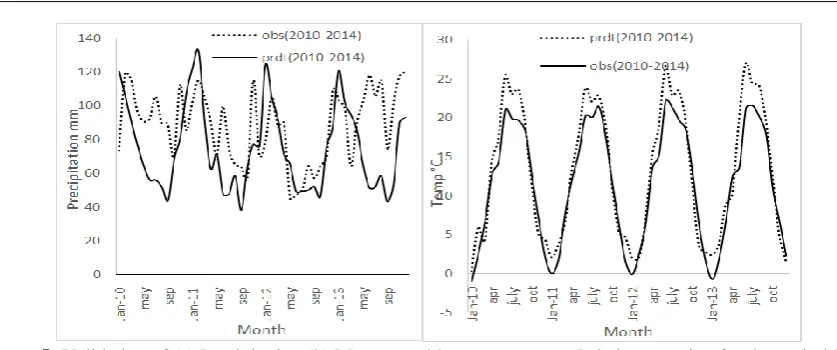
The historical precipitation data for the period 1970 to 2009 was used for calibrating the regression model, whereas the data for the period 2010-2014 was used for validating the model. The regression statistics for temperature and precipitation are given in table 1. Prediction accuracy of temperature was higher than that of rainfall for A1B scenario. Fig.5 shows the validation of temperature and precipitation model over the period 2010 to 2014.From Fig.5 it is clear that the observed and predicted values of temperature varied in the same direction throughout the validation period. Furthermore, the future mean monthly temperatures of the Lidder basin for the period 2001-2100 were predicted by MLR model and are shown in Fig.2. It was observed that the mean monthly temperature over the 21st century based on MLR predictions, depict an increasing trend except for the months of June,July,August, November and December. The variation of average annual temperature for Jhelum river basin was also determined using MLR model and is shown in Fig.4. The average annual temperature also shows an increasing trend and by the end of 21st century it is predicted to increase by 1.91°C.
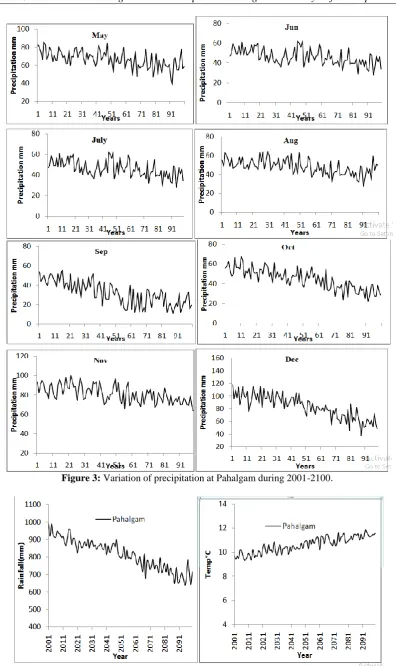
Figure 3: Variation of precipitation at Pahalgam during 2001-2100.
Figure 5: Validation of (a) Precipitation (b) Mean monthly temperature at Pahalgam station for the period 2010-2014.
Table 1: Variation of annual weather parameters at Pahalgam station of Lidder river basin during 21st century. Variable Multiple correlation
coefficient
Increase in average temperature/decrease in precipitation over 21st century
1.91°C
III.
CONCLUSION
From the analysis of results, the following conclusions were drawn:It was found out that the temperature for CGCM3 model showedan increasingtrend except for the months of June, July, August, November and December while asprecipitation showed decreasing trend for the months of January, February,September,October and December. Themean annual temperature showed an increasing annual trend of1.91 degrees during the course of 21st century andprecipitation was found to be increasing by 27.56% annually. In order toreduce the discrepancy, different downscaling techniques can be used.
REFERENCES
[1]. Maunder, W. J. 1994. Dictionary of Global Climatic Change. 2nd Revised Edition. UCL press,London, 257 pp.
[2]. Bates BC, Kundzewicz ZW, Wu S, Palutikof JP (2008) Climate Change and Water. Technical Paper of the Intergovernmental Panel on Climate Change. IPCC Secretariat, Geneva.
[3]. Christensen JH, Hewitson B, Busuioc A, Chen A, Gao X, Held I, Jones R, Kolli RK, Kwon WT, Laprise R, Magana Rueda V, Mearns L,Menendez CG, R ´ ais¨ anen J, Rinke A, Sarr A, Whetton P (2007) Regional climate projections. Climate Change 2007: The Physical Science Basis, Contribution of Working Group I to the Fourth Assessment Report of the Intergovernmental Panel on Climate Change. Cambridge University Press: Cambridge
[4]. Wilby RL, Dawson CW (2007) User manual for SDSM 4.2
[5]. Wilby RL, DawsonCW, Barrow EM (2002) SDSM—a decision support tool for the assessment of regional climate change impacts. Environmental Modeling Software
[6]. Ramırez MCV, Ferreira NJ, Velho HFC (2006) Linear and nonlinear statistical downscaling for rainfall forecasting oversoutheastern Brazil. Weather Forecast 21:969–989. doi:10.1175/WAF981.1
[7]. Fan K,Wang HJ (2009) A new approach to forecasting typhoon frequency over the western North Pacific. Weather Forecast 24:974–986
[8]. Lang XM, Wang HJ (2010) Improving extra-seasonal summer rainfall prediction by merging information from GCM and observation.Weather Forecast 25:1263–1274
[9]. Liu Y, Fan K, Wang HJ (2011) Statistical downscaling prediction of summer precipitation in southeastern China. Atmos Ocean Sci Lett 4:173–180
[10]. Bretherton CS, Smith C,Wallace JM(1992) Anintercomparison of methods for finding coupled patterns on climate data. J Clim 5:541–560
[11]. Widmann M, Bretherton CS (2003) Statistical precipitation downscaling over Northwestern United States using numerically simulated precipitation as a predictor. J Clim 16:799–816