OPTIMIZATION OF PROCESS PARAMETER IN INJECTION MOULDING USING
TAGUCHI METHOD
T. Mohan Kumar
1, D. Dhanasekar
2, K. Chidhambaram
3, S. Anil Kumar
41,2,3,4
Assistant Professor, Department of Mechanical Engineering, Adhiparasakthi College of Engineering, Vellore,
Tamilnadu, India
---***---Abstract -
Injection moulding is one of the widely used manufacturing process for polymer materials, due to its high productionrate and low process cost. However, polymer parts manufactured through injection moulding process are prone to various defects such as geometrical defect, shape related defect and visual defects. The main objective of this paper is to study the effect of various injection moulding process parameters on the volumetric shrinkage and fill time of a Polypropylene chair bottom cap part, identifying the most significant parameter causing high volumetric shrinkage and optimizing the process parameters through Taguchi L9 orthogonal array design and analysis of variance (ANOVA) method. The Polypropylene chair bottom cap part injection moulding process is simulated using Moldflow Adviser ultimate simulation software and the change in fill time and volumetric shrinkage is analysed for various process parameters combination.
Key Words: Polypropylene (PP), Process Parameters, Orthogonal Array (OA), Analysis of Variance (ANOVA).
1.
INTRODUCTION
Injection moulding is used at large scale in India for Polymeric fabrication process for thermoplastic materials. This process is like die casting but difficulties are more than simple metal casting. The reason behind is plastic has high viscosity of liquid plastic than molten metal. Injection moulding process is a cyclic operation involved during injection like transformation of plastic pellets into molten liquid than filled in cavity and in last again solidifies in moulded part. The plastic injection-molding machine allows the mould to be mounted on it and provides the mechanism for molten plastic transfer from the machine to the mould, clamping the mould by application of pressure and ejection of the formed plastic part.
2.
NUMERICAL SIMULATION
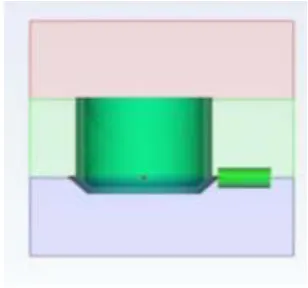
[image:1.612.229.383.541.685.2]Autodesk Simulation Mold flow (2016), MFA is acomplete suite of definitive tools for simulating, analyzing, Optimizing and validating plastics part and mould designs in plastics injection molding. Thus, MFA can work to reduce or eliminate time delays, improve part quality, and deliver projects within budget constraints. With MFA analysis modules, filling, packing, and cooling stages of the plastic, the injection molding process can be simulated. MFA also predict post-moulding phenomena such as shrinkage sink mark, air trap, weld line, and warpage of the products. In addition, MFA offers an expanded material database, which includes over 9300 unique plastic materials for use in plastic injection moulding process simulation software in order to ensure that users have access to the highest quality material data for plastic simulation.
TABLE – 1: Material Properties of Polypropylene
S. NO. PROPERTIES VALUE
1 Specific Heat (Cp) 3100 J/kg deg C 2 Elastic Modulus 1340 MPa 3 Poisson’s Ratio 0.392
4 Shear Modulus 481.3 MPa
5 Melt Temperature 254.5 deg C
6 Density 0.92889
gm/cm3
7 Thermal
conductivity 0.17 W/m deg C 9 Energy Usage
Indicator 3
3.
PROBLEM DESCRIPTION
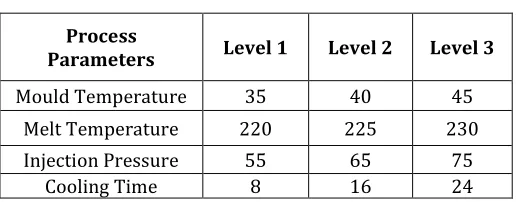
The problem focused in this study is to apply CAE methods in plastic injection moulding process to improve productivity of thick plastic products. In this study four controlling factors named mould temperature, melt temperature, injection pressure and cooling time were used with three levels by the application of Taguchi tables were used for design of experiment. The product quality made from plastic injection molding process is always affected by its process parameters like injection pressure, injection speed, mold temperature, melt temperature, packing pressure, packing time, cooling time and many more. The effects of these parameters were studied by various researchers from last decades. It was very difficult to design, experiments for any type of research and here a scientific approach is helpful for researchers which is known as “DESIGN OF EXPERIMENT”. This technique was adopted by researcher for this study. By use of DOE techniques any researcher can determine important factors which are responsible for output result variation of experiments. DOE can found optimum solution for particular experiments. Design of DOE table is only possible by selection of proper factors and their levels. In this study four factors were selected with three levels for each product and were shown in table 2.
TABLE - 2: Factors and Levels
Process
Parameters Level 1 Level 2 Level 3
Mould Temperature 35 40 45
[image:2.612.178.436.476.577.2]TABLE – 3: Response Table for S/N ratio
Response table for plastic product were show that input parameter melting temperature, was most critical responsible parameter for shrinkage and fill time outcomes. Rank was also show based on response table. Most critical parameter was melting temperature whereas less important parameter was packing pressure because level values were high and show no effect in product quality variation. The best set of combination parameters is determined by selecting the levels with high S/N ratio values from tables or graph.
Best Set: A1-B1-C1-D3-E3 (S/N ratio) Best Set: A1-B1-C1-D3-E3 (Mean ratio)
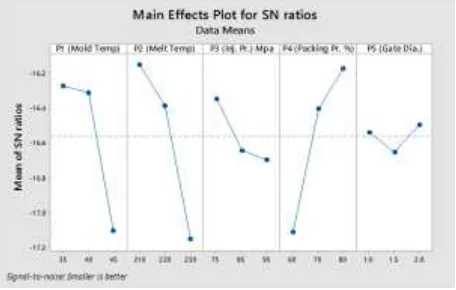
Although S/N ratio was good approach to find optimum combination of input parameters but for the verification MEANS based study was also show in this study and response figure based on means is shown below. Figure shows that most important parameter was packing pressure for the given case like S/N ratio but the optimum combination is changed in S/N ratio.
The best set of combination parameters should be determined by selecting the levels with low mean values from figure Level TemperaMould
ture
Melt Temper
ature
Injection
Pressure Cooling time 1 -7.800 -7.783 -7.790 -7.792 2 -7.788 -7.789 -7.788 -7.788 3 -7.780 -7.795 -7.789 -7.788 Delta 0.020 0.012 0.002 0.004
4.
ANOVA ANALYSIS
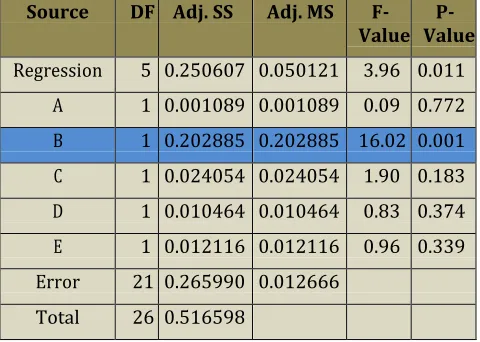
[image:4.612.187.427.426.597.2]The analysis of variance was calculated for plastic product and results were shown in below tables respectively. In ANOVA analysis F-Test was conduct to compare a model variance with a residual variance. F value was calculated from a model mean square divided by residual mean square value. If F value was approaching to one means both variances were same, according F value highest was best to find critical input parameter.
TABLE – 4: ANOVA Results for Shrinkage
Source DF Adj. SS Adj. MS F-
Valu e
P- Valu
e Regression 5 17.189
8 3.43796 7.43 0.000 A 1 4.4940 4.49400 9.71 0.005 B 1 6.5413 6.54134 14.14 0.001 C 1 0.7100 0.71003 1.53 0.229 D 1 5.3847 5.38467 11.64 0.003 E 1 0.0597 0.05974 0.13 0.729 Error 21 9.7145 0.46259
Total 26 26.904 3
From literature review various researchers found that if p value was very small (less than 0.05) then the terms in the regression model have a significant effect to the responses.
TABLE – 5: ANOVA Results for Fill Time
Source DF Adj. SS Adj. MS F-
Value Value P- Regression 5 0.250607 0.050121 3.96 0.011
Best case based on S/N ratio analysis for this study was given and values was mold temperature 35 C, melt temperature 210 C, injection pressure 75 MPa, packing pressure 80 %, and gatedia was 2 mm for best case from all cases.
Best Set: A1-B1-C1-D3-E3 (S/N ratio)
Best Set: A1-B1-C1-D3-E3 (Mean ratio)
ANOVA results indicate that the injection pressure, melt temperature were most significant factors for volumetric shrinkage for product. Like that for fill time melt temperature and injection pressure were most critical factors for product. Mold temperature and injection speed was most critical factors. Model equations for fill time and shrinkage was predict accurately with Minitab software and show 90% good prediction for responses and can be used by any plastic injection molding process manufacturer.
REFERENCES
[1]Carlos Javierre, Angel Fernandez, Jorge Aısa, Isabel Claverıa, “Criteria on feeding system design: Conventional and sequential injection moulding”, “Journal of Materials Processing Technology, 171 (2006)”, pp. 373- 384, June 2005. [2]J. J. Lau, M. Azuddin, “Design, analysis and verification of 4 micro cavities for a standard runner system”, “Procedia Engineering, 64 (2013)”, pp. 401–408, 2013.
[3] S. Selvaraj, P. Venkataramaiah, “Design and Fabrication of an Injection Moulding Tool for Cam Bush with Baffle Cooling Channel and Submarine Gate”, “Procedia Engineering, 64 (2013)”, pp. 1310–1319, 2013.
[4] Zahid A. Khan, S. Kamaruddin, Arshad Noor Siddiquee, “Feasibility study of use of recycled High Density Polyethylene and multi response optimization of injection moulding parameters using combined grey relational and principal component analyses”, “Materials and Design”, 31 (2010), pp. 2925-2931, 2010.