A Region Segmentation Algorithm for Remote
Sensing Imaging Combined with Multi-feature
and Multi-band
Xiaoqing Zuo
Faculty of Land and Resource Engineering, Kunming University of Science and Technology, Kunming, China
Email: [email protected]
Lei Chen
Faculty of Land and Resource Engineering, Kunming University of Science and Technology, Kunming, China
Email: [email protected]
Yongchuan Zhang
School of Resource and Environmental Sciences, Wuhan University, Wuhan, China Email: [email protected]
Abstract—High spatial resolution remote sensing images provide many rich features, such as spectrum, shape, texture, etc. However, only spectral character is adopted in many traditional image segmentation methods, leading to segmentation results unsatisfactory. A multi-feature and multi-band region segmentation algorithm (MM-RSA) is proposed. First, texture image of a band is extracted and is combined into multi-spectral image. Second, seed region is selected from the combined multi-spectral image using Fuzzy C-Means Clustering method. Third, the segmentation process is performed by employing a region growing criterion, which integrates spectral and shape feature information. The algorithm not only integrates the criterions of spectrum, texture and shape, but also is of multi-scale characteristic. Experiments were conducted on a QuickBird image to evaluate the performance, and the results showed that the MM-RSA is able to effectively obtain segmentation results at different scales, and the overall performance of segmentation is improved when compared with pixel-based segmentation algorithm and multi-resolution-based segmentation algorithm.
Index Terms—multi-feature, multi-band, multi-scale, region segmentation, remote sensing image
I. INTRODUCTION
Traditional digital image analysis techniques are mostly based on spectral character analysis at pixel level. However, this technique is unable to extract practical information of high spatial resolution remote sensing data. The method of object-based image analysis can not only take into account spectral feature, but also use other
characteristics of the image, such as texture, shape and context of the object. Additionally, it can effectively avoid the salt-pepper noise. Multi-information fusion method can improve the accuracy and automaticity of extracting information from high resolution remote sensing images [1]. Therefore, applications of high-resolution remote sensing image require more and more complex image analysis algorithms. Kettig and Landgrebe [2] discussed the advantages of object homogeneity of information extraction in 1976. According to the features of high-resolution remote sensing image, Baatz and Schape [3] proposed multi-resolution segmentation which makes object-based image analysis technology of remote sensing develop rapidly.
Image segmentation is to generate high-quality image objects, which is the key technology of object-based image analysis. A lot of segmentation algorithms have been developed, but no one is recognized as the best. In order to satisfy different remote sensing applications, researchers designed and developed a variety of complex image segmentation algorithms. They can be divided into four types [4]: histogram threshold [5,6], spatial clustering [7], edge detection [8,9] and region segmentation [10].
These traditional segmentation algorithms could get good work on gray images, but are not good enough for color images, especially the multi-band remote sensing images. Region growing algorithm can easily combine multi-feature and multi-band, but choosing the seeds is required. In order to optimize the region growing algorithm, Adams [11] proposed an algorithm of seed region growing (SRG) which needs to select a certain number of pixels as seeds through human-computer Supported by China NSFC (NO.41061043).
interaction. A way of pre-selecting seeds can not only avoid the noise pixel to be a seed, but also directly integrate image features (such as the number of regions) into the segmentation process. However, the method of the human-computer interaction to select the seeds is of a heavy workload, and it relies on the user's experience.
In remote sensing applications, the most widely used algorithm of image segmentation is the multi-resolution segmentation in eCognition software [3]. The algorithm relies on factors of the scale, color, shape (compactness and smoothness). It begins with an arbitrary pixel, and utilizes the smallest heterogeneous region to merge. Wang [12] proposed a regional segmentation algorithm based on K-means clustering. It adopted K-means clustering to select the seeds, and spectral and shape features are utilized as criterion for image segmentation. K-means clustering is used to select the seeds to avoid the influence of some noises, but the criterion function is nondifferentiable, and the result seriously dependents on the selection of initial cluster centers.
Aiming at these problems, this paper proposed a multi-feature and multi-band region segmentation algorithm. The algorithm combines the texture image with the original multi-spectral bands, utilizes the fuzzy C-means clustering to select the seeds, and then integrates a variety of feature knowledge as the threshold condition of region growth. It could make segmentation objects more homogeneous.
II. ALGORITHM IDEA
The premise of object-based analysis is image segmentation. In order to generate more homogeneous segment, the paper proposes a multi-feature and multi-band region segmentation algorithm (MM-RSA). The algorithm can segment images at different scales. The flow chart of the algorithm is shown as Figure 1.
Fig.1. Flow chart of the segmentation algorithm MM-RSA First, extract a texture image of a band and combine it into multi-spectral image. Second, use Fuzzy C-Means clustering method to select the seeds to form a single-band clustering image. Third, perform the segmentation process employing a region growing
criterion, which integrates spectral and shape feature information.
III. ALGORITHM DESCRIPTION
A. Extract Texture Images with GLCM
Texture can be considered as spatial distribution and relationship of the image’s gray scales in the local region. Gray Level Concurrence Matrix (GLCM) is proposed by Haralick, and is widely used in converting the gray value to texture information.
GLCM represents texture by calculating the joint conditional probability density P i j d( , / , )θ between the image’s gray scales. When the distance d and direction
θ is determined, and the gray scale i is the starting point,
( , / , )
P i j d θ indicates the probability that the gray level j
could appear. Usually θ selects four values: 0 °, 45 °, 90 °, and 135 °. P i j d( , / , )θ is a symmetric matrix. If d
is very small, the values of co-occurrence matrix element will assemble near the diagonal. If d is large, the values
will be far from the main diagonal and spread out. Haralick defined 14 texture metrics which need a large amount of calculation. Generally some of the statistical properties are extracted to descript texture features. They are listed below:
zEnergy: 2 ( , ) i j
ENE=
∑∑
p i j (1)Energy is a metric about the changes of texture gray scale in image. It reflects the distribution uniformity of image gray level and texture coarseness.
zContrast: 2 ( ) ( , ) i j
CON=
∑∑
i− j p i j (2)Contrast is a metrics of distribution of GLCM and local changes in images. It reflects the sharpness of the image and grooves depth of texture.
zCorrelative:
1 2 1 2
| ( , ) | /( )
i j
COR=
∑∑
i j p i j⋅ ⋅ − ⋅μ μ σ σ⋅ (3)1
μ ,μ2,σ1,σ2 represent the mean and variance of p i j( , ) respectively. Correlative is a metrics of similarity of GLCM in the row or column.
zEntropy:
( , ) log ( , ) i j
ENT= −
∑∑
p i j p i j (4)Entropy is a metrics of the texture randomness. If all values are equal, entropy obtains the maximum value. On the contrary, if the values are very uneven, entropy is very samll.
Each statistical property can generate a texture feature image which is used together with the spectral feature. Aiming at different images and the object to be extracted, we can select different statistical properties as indicators, and ultimately extract the object information [13].
B. Fuzzy C-Means Clustering
in the same category and a big difference between different categories. Fuzzy C-means Clustering (FCM) is a promotion came from K-means clustering. The algorithm is described as follows:
{ ,i 1, 2, , }
X = x i= " n is a set of trained samples,
p
X ⊆R ; vk (k = 1,2, ..., c) is the k-th center of
clustering; c is the number of predetermined categories;
ki
u (k = 1,2, ..., c; i = 1,2, ..., n) is the membership
function of sample i in k category, and 0≤uki≤1 ,
1 0 n ki
i
u n
=
<
∑
< . The FCM objective function is: 21 1
( , ) c n b
f ki i k
k i
J U v u x v
= =
=
∑∑
− (5) { }kiU = u ,v=( , , , )v v1 2 " vc ,
b
>
1
is a constant of weight coefficient. Generally speaking, b = 2. If b isgreater, the classification is fuzzier. The constraint is:
1
1 1, 2, ,
c
ki k
u i n
= = ∀ =
∑
" (6) Equation (5) is optimized by the constraint equation (6). Let the partial derivative of Jf tou
kiand vkequalzero, then we can get the necessary condition:
(
)
(
)
1/( 1) 2 1/( 1) 2 1 1/ 1/ b i kki c b
i j j x v u x v − − = − = −
∑
1, 2, , ; 1, 2, ,
k c i n
∀ = " = " (7)
1
1
1, 2, , n b ki i i k n b ki i u x
v k c
u
=
=
=
∑
∀ =∑
" (8) We can setup an initial fuzzy membership matrix, and then use iterative method to solve the equation (7) and equation (8). If *J − <J δ , we can get clustering
centers and the values of membership. Each sample is assigned to the category that has largest value in the membership. A clustering image can be generated like this.
In the process of the algorithm, users must specify four parameters: the number of clustering (the default value is
c = 10), the weigh coefficient (the default value m=2), the
maximum number of iterations (the default value is n =
30), terminating value of the iterations (the default value
δ
= ×
1 10
−5).C. Segment Model and Seed Initialization
Segment model consists of many attributes and some of important methods which are used to store and manage complex segment data. The main attributes are:
(1) Mean: the mean spectral value of every band for the segment.
(2) Average standard deviation: the average standard deviation of all the spectral bands for the segment.
(3) Rectangularity: the ratio of the area of the segment to the area of its minimum bounding rectangle.
seg
MER
Area Rectangularity
Area
= (9)
R = 1 for a rectangle; R = π/4 for a circle. Generally
speaking, 0 < R <= 1.
(4) Neighbor segment: during the segment initialization process, each segment has four neighbors if the four-connectivity is applied, except edge and corner segments. An edge segment has three neighbors and corner segment has two neighbors.
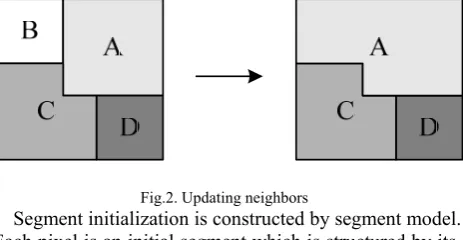
An important method of segment model is the function of merging segments: addSegment (segmentA, segmentB). If A and B are neighbor segments and have similar characteristics, B will be merged into A. Some attributes of A and B will change. Especially the attributes of B’s neighbors will also change. As shown in Figure 2: B merged into A, A’s neighbors B, C, D replace with C, D; B’s neighbors A, C replace with null; C’s neighbors A, B, D replace with A, D; D’s neighbors A, C are unchanged.
Fig.2. Updating neighbors
Segment initialization is constructed by segment model. Each pixel is an initial segment which is structured by its row and column. In the segment initialization process, the attributes of segments will be updated.
D. Seed Generation
Seed generation is the process of generating representative and homogeneous small regions. After the segment initialization, each pixel is a segment in the image. During the automatic seed generation, B will be merged into A, only if the following criteria are satisfied:
(1) A and B are neighbors;
(2) A and B have the same clustering value;
(3) The rectangularity value of merged A must be greater than a set value (the default value is 0.6);
(4) The number of the seed pixels of merged A must be less than a set value (the default value is 50);
(5) The standard deviation of merged A must be less than a set value (the default value is 50).
E. Region Growing
(
)
2b
N
jk ik k
distance=
∑
x −x ≤ Δ (10)jk
x represents the brightness value of k band of
segment j; xik represents the brightness value of k band of segment i; Nb represents the number of bands.
B will be merged to A only if: (1) A and B are neighbors;
(2) The number of the seed pixels of B must be less than a set value (the default value is 10);
(3) A is B’s best neighbor.
F. Region Merging
Region merging is to create segments that are close to the real world, overcome the over-segmentation, and keep the homogeneity of segments. Region merging considers two distance metrics: spectrum distance and shape distance.
Spectrum distance: spectrum i j
ij i j
i j
n n
D x x
n n
⋅ = −
+ (11)
Shape distance: shape
ij m m i i j j
D = n ⋅ − ⋅ − ⋅r n r n r (12)
i
n, nj and nm respectively represent the number of
pixels of the segment i, j and merged segment; xi and
j
x respectively represent the average brightness value of
the segment i and j; ri , rj and rm respectively represent the rectangularity of the segment i, j and
merged segment. In the condition of the same brightness values, the spectral distance can ensure that the small segments will be merged first.
The first step is to merge mutual best neighbors. If B is A’s best neighbor, and A is B’s best neighbor, A and B are mutual best neighbors. Mutual best neighbors are merged if they satisfy the following two conditions:
(1) The spectrum distance is less than a predefined threshold (the default value is 1000);
(2) The shapes distance is less than a predefined threshold (the default value is 20).
The second step is to merger best neighbor. The predefined spectrum and shape thresholds are used as the
same as the first step. The only difference is that the predefined spectrum threshold is not a constant. Spectrum threshold starts from a very small value in the first iteration, and then grows linearly during the following iterations until it equals the predefined threshold. The default value of the initial threshold is 20. If there are no more segments that can be grown into a neighboring segment, then the threshold value grows to 40. The process continues until the threshold value reaches 1000. It ensures to merge the local best neighbors first, which could produce more homogeneous image segments.
Three parameters will be specified during the region merging: iteration distance, iteration times, and merged standard deviation. The iteration distance represents the initial spectrum distance for merging best neighbors. The multiplication of the iteration distance and iteration time results in the spectrum distance for merging mutual best neighbors. The merged segments are not allowed to have a greater value than the merged standard deviation.
IV. EXPERIMENTS AND RESULTS ANALYSIS
A. Experimental Procedure and Algorithm Parameters
The experimental data is a QuickBird fused image which has the resolution of 0.6m and the size of 199 × 199 pixels in Yunnan province. Acquisition time is October 28, 2009, as shown in Figure 3(a). The experimental area includes abundant information: building, forest, water, grass (or cropland), bare land, road. There are some shadow regions in the image caused by shooting time and shooting angle.
The MM-RSA is performed in the experiment. Step 1: A sliding window with the size of 5 × 5 was selected to statistic the GLCM of the original red-band. Then the energy matric was chose to generate a texture feature images (Figure 3(b)) which was combined to the original image to form a multi-band image.
Step 2: FCM algorithm was used to generate a clustering image (Figure 3 (c)) from the combined multi-band image. We got 2003 regions. The parameters were the default values. Each pixel was labeled based on the number of clusters 1 to 10.
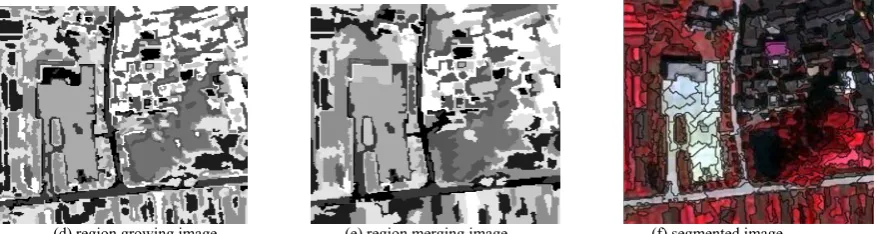
(d) region growing image (e) region merging image (f) segmented image
Fig.3. Original QuickBird image and processed images by segmentation. Figure 3(c-e) use 10 gray scales to roughly represent the processed images.
Step 3: After the process of segment initialization, the initialized segments that satisfy the seed growth conditions (parameters are default value) were merged to seed regions. Then we could get 3670 regions.
Step 4: We obtained the segment image after the region growing (Figure 3(d)) and region merging (Figure 3(e)), and marked the segments with numbers (1-n). The condition of region growing was that the number of pixels of the seed regions is less than10. The main parameters of region merging were iteration distance and iteration times. We selected iteration distance 20 and iteration times 80 after repeated test. At the same time, the number of regions reduced from 1282 to 335.
Step 5: The 335 regions were marked by the numbers (1-335) to form a region ordinal matrix. After converting it into a region ordinal matrix image, we did the assisted segmentation in eCognition software, and displayed the boundary among the regions. First, the original image was segmented by chessboard segmentation that segmentation scale is 1. Then the region ordinal matrix image was segmented based on the pixel of the object layer to merge by spectral difference segmentation that the spectral distance was 0. The segmented image is shown as Figure 3 (f).
B. Results Discussion
(1) Comparison of MM-RSA and multi-resolution segmentation algorithm
We used three different segmentation scales to segment the remote sensing images using MM-RSA, and also segmented the same image using multi-resolution segmentation, then compared the two segmentation results. Figure 4(a-c) are the MM-RSA segmentation results: iteration distances are respectively 10, 20 and 50; iteration times are 80; other parameters use default values.
Figure 4(d-f) are the multi-resolution segmentation results: spectral criteria are 0.9; shape criteria are 0.1 (the compactness is 0.4, and the smoothness is 0.6); segmentation scales are respectively 20, 30 and 50.
MM-RSA and multi-resolution segmentation all consider the spectral and spatial information, and generate high-quality image segments in segmentation process. MM-RSA can generate better segments than the multi-resolution segmentation by visual detection. (2) Accuracy evaluation
In order to compared with MM-RSA, same original QuickBird image was respectively segmented by multi-resolution segmentation and pixel-based chessboard segmentation in eCognition 8.0 software. The multi-resolution segmentation generates 367 regions and the parameters of are: the segmentation scale is 30; the spectral weight is 0.9; the shape compactness is 0.4. The pixel-based chessboard segmentation generates pixel-based regions.
The nearest neighbor algorithm was used to classify the three segmentation results. MM-RSA and multi-resolution segmentation are object-based methods, and the chessboard segmentation is pixel-based method. Accuracy evaluation of the classification was utilized to compare three segmentation methods. There are seven categories by visual detection in the image: building, forest, water, grass (or cropland), bare land, road and shadow. We selected 2 to 8 samples for each category. In order to compare with the pixel-based classification, we only used spectral features (such as the spectrum mean and brightness) as the characteristic parameters of nearest neighbor algorithm. The three classification results are shown as Figure 5(a-c).
(d) segmentation scale: 20 (e) segmentation scale: 30 (f) segmentation scale: 50 Fig.4. Comparison of MM-RSA and multi-resolution segmentation
(a) Pixel-based classification (b) Multi-resolution-based classification (c) MM-RSA-based classification
Fig.5. Classification results of three segmentation algorithms As shown in Figure 5, there are misclassifications of
water and shadow in all of the three classification results, because the spectrum of water and shadow are similar. There is a serious “salt and pepper” phenomenon in the pixel-based classification, and many shadow pixels are mistakenly assigned to the water. Multi-resolution-based classification can easily distinguish water and shadow, but difficultly distinguish grassland and forest. Compared with the above two classifications, MM-RSA-based classification has higher accuracy and good effect. Especially it is able to distinguish grassland and forest very well, maybe because of introducing the texture image. The accuracy of MM-RSA-based classification is better than the other two algorithms by visual detection.
We made a quantitative comparison the three classification accuracy to further validate the accuracy of the MM-RSA-based classification. 350 random sample points were generated using a sampling tool developed in ArcGIS as reference data. Land cover information was determined based on the visual interpretation and each point was assigned to one of seven categories: building, forest, water, grass (or cropland), bare land, road and shadow. The comparison method is commonly used in the classification based on the confusion matrix to calculate overall accuracy and Kappa coefficient (Table 1).
TAB.1.
ACCURACY ASSESSMENT OF THE THREE CLASSIFICATIONS Classification
method Pixel- based Multi-resolution- based MM-RSA-based Overall accuracy 77.14% 84.28% 86.29%
Kappa
coefficient 0.7165 0.8038 0.8337
As shown in Table 1, the accuracy of MM-RSA-based classification is better than the pixel-based classification and the multi-resolution-based classification. The overall accuracies increase by 9.15% and 2.01% respectively. Kappa coefficients increase 0.1172 and 0.0299 respectively. The reasons are:
(1) The pixel-based segmentation only considers the spectrum feature of a single pixel, which is not close to real-world objects, but also can’t take full advantage of the other features in high spatial resolution images.
(2) The multi-resolution segmentation utilizes some of the spectrum feature and shape feature, but it can’t extend the other features. The region merging begins with a single pixel, which makes the seed regions contain a lot of noise.
(3) The MM-RSA brings into the texture image, and could take full advantage of the various features. The segment model has a certain extension. We can choose appropriate threshold function to get the best segmented image from different scales.
V. CONCLUSIONS
With the development of high spatial resolution remote sensing data, object-based image analysis has been widely applied in the field of remote sensing. The prerequisite of object-based image analysis is image segmentation. This paper proposed a multi-feature and multi-band region segmentation algorithm (MM-RSA). MM-RSA has the following characteristics.
(1) Multi-feature: The algorithm combines spectrum, texture, shape and other features.
original image bands, but many prominent features in images, the features can be combined with the original image bands. The algorithm can perform well based on the multi-band.
(3) Multi-scale: The algorithm can deal with multi-scale segmentation image.
(4) Reproducible:If the same parameters are provided, the algorithm will produce the same segmentation image.
(5) Flexible: The algorithm is flexible to set up parameters as threshold conditions of segmentation, but it needs to keep on trying.
(6) Extensible: The algorithm is based on the segment model, more other texture, shape features can be added to the criterion function of image segmentation.
Then an experiment is performed on a QuickBird image. Three algorithms, MM-RSA, multi-resolution-based image segmentation and pixel-based image segmentation were adopted to segment the same image. Then the nearest neighbor algorithm was used to classify the three segmentation results. MM-RSA accuracy is better than the others. The result shows that the MM-RSA is a viable, effective segmentation algorithm.
ACKNOWLEDGMENTS
This research work was supported by the National Science Foundation of China (NO.41061043).
REFERENCES
[1] X. F. Li, S. Q. Zhang, F, W. Fu, et al. Road Extraction form High-resolution Remote Sensing Images Based on Multiple Information Fusion. Acta Geodaetica et Cartographica Sinica. 2, 37(2008), pp. 178-184.
[2] R. L. Kettig, D. A. Landgrebe. Classification of Multispectral Image Data by Extraction and Classification of Homogeneous Objects. IEEE Transactions on Geoscience Electronics. 1, 14(1976), pp. 19-26.
[3] M. Baatz, A. Schape. Multiresolution Segmentation: an Optimization Approach for High Quality Multi-scale Image Segmentation. Angewendte Geographisehe Information Sverarbeitung XII, (2000) 12-23; Salzburg. Austria.
[4] H. D. Cheng, X. H. Jiang, Y. Sun, et al. Color Image Segmentation: Advances and Prospects. Pattern Recognition. 12, 34(2001), pp. 2259-2281.
[5] N. A. Otsu, A Threshold Selection Method from Gray Level Histograms. IEEE Transactions on Systems. 1, 9(1979), pp. 62-66.
[6] Y. F. Zhang, Y. Zhang. Automatic Threshold of Image Segmentation Using 2-D Entropy. Journal of Harbin Engineering University. 3, 27(2006), pp. 353-356.
[7] K. Y. Lin, L. H. Xu, J. H. Wu. A Fast Fuzzy C-Means Clustering for Color Image Segmentation. Journal of Image and Graphics. 2, 9(2004), pp. 159-163.
[8] J. Canny. A Computational Approach to Edge Detection. IEEE Transactions on Pattern Analysis and Machine Intelligence. 6, 8(1986), pp. 679-698.
[9] H. Moon. Optimal Edge-based Shape Detection. IEEE Trans on Image Processing. 11, 11(2002), pp. 1209-1226. [10]P. Wang, X. Q. Su, Y. X. Liu. Dynamic Thresholding
Based Region Combination. Acta Photonica Sinica. 3, 33(2004), pp. 378-381.
[11]R. Adams, L. Bischof. Seeded Region Growing. IEEE Transactions on Pattern Analysis and Machine Intelligence. 6, 16(1994), pp. 641-647.
[12]Z. Wang, J. R. Jensen, J. Im. An Automatic Region-based Image Segmentation Algorithm for Remote Sensing Applications. Environmental Modelling & Software. 25(2010), pp. 1149-1165.
[13]Q. X. Jiang, H. P. Liu. Extracting TM Image Information Using Texture Analysis. Journal of Remote Sensing. 5, 8(2004), pp. 458-464
Xiaoqing Zuo received the M.Sc. degree (2001) in GIS from Kunming University of Science and Technology and Ph.D. degree (2004) in GIS from Wuhan University. Now he is a professor in Faculty of Land Resource Engineering, Kunming University of Science and Technology. His research interests are in the areas of spatial data mining, 3DGIS and image processing.
Lei Chen is pursuing a M.Sc. degree in Cartography and Geographic Information Engineering from Kunming University of Science and Technology. His main interest is image processing.