Response Analysis of Infill Walled Building
Frame with Tuned Mass Dampers as Soft Storey
Arsha G Fernandez Dr. T Sundararajan
PG Student Scientist/Engineer
Department of Civil Engineering Department of Civil Engineering
Mar Baselios College of Engineering, Trivandrum VSSC
Tisny D.B Professor
Department of Civil Engineering
Mar Baselios College of Engineering, Trivandrum
Abstract
Tuned Mass Damper (TMD) is a passive control device which is simple, inexpensive and a reliable means for suppressing undesirable vibration of structures caused by harmonic or wind excitation. The effect of TMD with optimum parameters (frequency and mass ratios) is studied. In the present paper, a soft storey constructed at the top of a building is treated as a TMD and its usefulness in response reduction is evaluated. Analysis and modeling are done using FE software developed by VSSC, FEASTSMT and the building is subjected to an arbitrary acceleration as base excitation to record the response at top storey. TMDs with mass percentages of 2 and 3 are considered and the results are compared between buildings with and without TMD. Keywords: FEASTSMT, Response reduction, TMD, Soft storey, Infill Walls
________________________________________________________________________________________________________
I. INTRODUCTION
The major goal in structural engineering is to maintain the structural stability against the effect of various forces acting on the structure. The objective of seismic analysis of structure is to mitigate or reduce the seismic risk. Seismic risk refers to various factors such as seismic hazard, exposure and vulnerability.
TMDs are the simplest form of vibration absorbers which are relatively easier to implement. Tuned Mass Dampers are often used if the excitations are almost periodical and the structural response is dominated by its fundamental mode. By adding an auxiliary mass where the stiffness and damping are designed properly, the building vibrations can be substantially controlled. Hence to reduce the seismic response, optimum parameters needed to be considered for design. Mass ratio, frequency ratio and damping ratio are the criteria to be considered. TMD proves to be efficient in arresting acceleration and displacement responses of building when the optimum parameters are taken into consideration. For TMD to be effective in structures with high damping ratios, large mass ratios must be employed. Top floor with adequate stiffness and damping can be considered as a vibration absorber for the bottom floors.
In order to obtain the optimum parameters of TMD single and multiple degrees of freedom structure are considered. For an un-damped structure, the tuning ratio: Tuning ratio, ‘f ‘= 1/ (1+μ)
Damping ratio, ‘ξ’= √𝜇/(1 + 𝜇)
For a damped structure,
f= 1
1+𝜇[1 − 𝛽√ 𝜇 1+𝜇]
ξ= 𝛽
1+𝜇+ √ 𝜇 1+𝜇
For a MDOF system, tuning ratio ‘f’ is nearly equal to tuning ratio of SDOF system for mass ratio of µφ and damping ratio is equal to that of SDOF system multiplied by φ. i.e.
f= 1
1+𝜇𝜑[1 − 𝛽√ 𝜇𝜑 1+𝜇𝜑]
ξ= 𝜑[ 𝛽
1+𝜇+ √ 𝜇 1+𝜇]
II. ANALYTICAL MODELLING
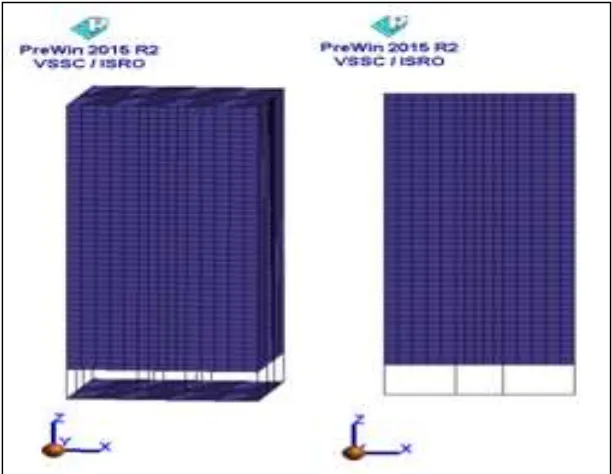
A ten storey building with a 3m height for each storey regular in plan with infill walls in the form of brick masonry with a bottom soft storey has been modeled. TMD is assumed to have the same damping as that of the structure. The building is fixed at the base and storey heights are assumed to be constant including the ground storey. Modeling is done using the finite element software developed by VSSC, namely FEASTSMT . The building details and its geometric properties are listed below.
Table – 1
Geometric Parameters of Models For 10 storey
No: of stories G+9
Storey Height 3m
Beam (Transverse and Longitudinal) 0.23m×0.5m
Column 0.3m×0.6m
Slab Thickness 0.15m
Infill Wall Thickness 0.23m
Grade of concrete and steel M25 & Fe415 Table – 2
Material Properties Beam ,Column and Slab elements Grade of concrete M25 Modulus of Elasticity 2.5E+10 N/m2
Poisson’s ratio 0.2
Density of concrete 2500kg/m3 Infill Wall (Brick Masonry) Modulus of Elasticity 6.3E+9 N/m2
Poisson’s ratio 0.15 Density of concrete 2000kg/m3
In order to tune the natural frequency of TMD with that of the building, TMD in the form of soft storey is modeled separately and the area, moment of inertia and thickness of structural elements are adjusted.
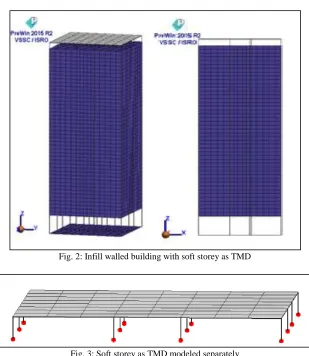
Fig. 2: Infill walled building with soft storey as TMD
Fig. 3: Soft storey as TMD modeled separately
Soft storey modeled as TMD ,fixed at the building top acts as a single rigid unit. It is composed of 16 columns of height 1m , modeled as beam elements and resting directly over the columns of the main structure. The columns are supported by a slab at the top.
Table – 3 Material properties of TMD
Material Density(kg/m3) E (N/m2) Poisson’s ratio
Steel 7850 2.1e+11 0.3
Table – 4
Free vibration characteristics of building Total mass= 2.19885e+6 kg
Mode
Frequency Hz rad/sec 1 1.3865 8.7116
2 2.021 12.6983
3 2.3775 14.9382 4 5.1748 32.5142 5 6.1286 38.507
TMD Parameters
Sadek, F (1997), proposed that effective mass ratio should be used for calculating optimum parameters of TMD. Effective mass ratio is the ratio of mass of TMD to normalized modal mass of building. As per Sadek, F (1997), effective mass ratio (µ) and optimum frequency ratio (f opt), is given by following equation:
µ = m
M Eqn. (1)
f opt= 1
1+𝜇𝜑[1 − 𝛽√ 𝜇𝜑
1+𝜇𝜑] Eqn. (2)
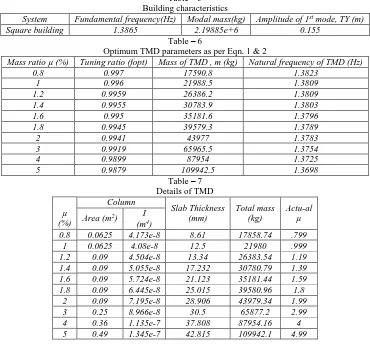
Table – 5 Building characteristics
System Fundamental frequency(Hz) Modal mass(kg) Amplitude of 1st mode, TY (m)
Square building 1.3865 2.19885e+6 0.155
Table – 6
Optimum TMD parameters as per Eqn. 1 & 2
Mass ratio µ (%) Tuning ratio (fopt) Mass of TMD , m (kg) Natural frequency of TMD (Hz)
0.8 0.997 17590.8 1.3823
1 0.996 21988.5 1.3809
1.2 0.9959 26386.2 1.3809
1.4 0.9955 30783.9 1.3803
1.6 0.995 35181.6 1.3796
1.8 0.9945 39579.3 1.3789
2 0.9941 43977 1.3783
3 0.9919 65965.5 1.3754
4 0.9899 87954 1.3725
5 0.9879 109942.5 1.3698
Table – 7 Details of TMD µ (%) Column Slab Thickness (mm) Total mass (kg) Actu-al µ Area (m2) I
(m4)
0.8 0.0625 4.173e-8 8.61 17858.74 .799
1 0.0625 4.08e-8 12.5 21980 .999
1.2 0.09 4.504e-8 13.34 26383.54 1.19
1.4 0.09 5.055e-8 17.232 30780.79 1.39
1.6 0.09 5.724e-8 21.123 35181.44 1.59
1.8 0.09 6.445e-8 25.015 39580.96 1.8
2 0.09 7.195e-8 28.906 43979.34 1.99
3 0.25 8.966e-8 30.5 65877.2 2.99
4 0.36 1.135e-7 37.808 87954.16 4
5 0.49 1.345e-7 42.815 109942.1 4.99
III. RESULTS AND DISCUSSIONS
Free Vibration Analysis
Free vibration analysis is carried out and natural frequencies and mode shapes of TMD are extracted from the analysis. TMD is tuned such that (by adjusting cross section and thickness of columns and slab respectively) its first frequency nearly matches with the one obtained from Sadek, F (1997) parameters that are presented in Table 5.
Table – 8
Free vibration characteristics of building with TMD
F R E Q U E N C Y (Hz)
Mass ratio (%) Mode no:
1 2 3 4 5
0.8 1.379 1.404 1.407 1.418 1.44 1 1.374 1.437 1.472 1.624 1.824 1.2 1.372 1.431 1.476 1.607 1.928
1.4 1.37 1.43 1.48 1.633 2.038
1.6 1.35 1.41 1.487 1.645 2.041
1.8 1.32 1.4 1.492 1.647 2.044
2 1.3 1.39 1.496 1.644 2.047
3 1.29 1.345 1.511 1.576 2.052
4 1.25 1.333 1.527 1.556 2.059
5 1.24 1.322 1.535 1.541 2.065
Frequency Response Analysis
Frequency response at the top 4 nodes of building is analysed . An arbitrary acceleration of 1g given at the bottom nodes of the building along both X and Y directions simultaneously. Response is measured in terms of acceleration at the top storey nodes which are more prone to severe shaking. Results are compared for models with and without TMD.
Table – 9
Acceleration response at Node 4927 without TMD Along X (m/s2) 13.45
Along y (m/s2) 11.77 Table – 10
Response at Node 4927 with TMD
Mass ratio of TMD Response along Y (m/s2) Response along X (m/s2) % response reduction
X Y
0.8 9 11.65 13.4 23.53
1 7.98 12.58 6.47 32.2
1.2 7.85 12.03 10.55 33.3
1.4 7.67 12.91 4.01 34.83
1.6 7.5 12.86 4.386 36.28
1.8 7.339 12.79 4.9 37.65
2 7.19 12.34 8.25 38.91
3 7.038 12.57 6.54 40.2
4 6.88 12.34 8.25 41.55
5 6.77 12.13 9.8 42.48
From Table 10, it can be observed that by tuning the TMD to fundamental frequency 1.3865Hz ( max: modal mass being excited along Y) for different mass ratios, it expeditiously arrests the response along Y with increasing mass ratio value.But along X, it shows an irregularity in response reduction as mass ratio increases. While response reduction is limited to a mere value to 14 % along Y, TMD contributes to a massive reduction upto 43% along X.
Fig. 4: % response reduction with different mass ratios Table – 11
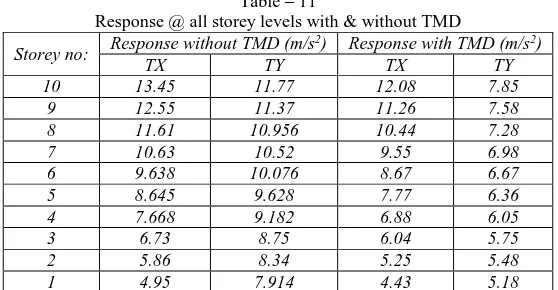
Response @ all storey levels with & without TMD Storey no: Response without TMD (m/s
2) Response with TMD (m/s2)
TX TY TX TY
10 13.45 11.77 12.08 7.85
9 12.55 11.37 11.26 7.58
8 11.61 10.956 10.44 7.28
7 10.63 10.52 9.55 6.98
6 9.638 10.076 8.67 6.67
5 8.645 9.628 7.77 6.36
4 7.668 9.182 6.88 6.05
3 6.73 8.75 6.04 5.75
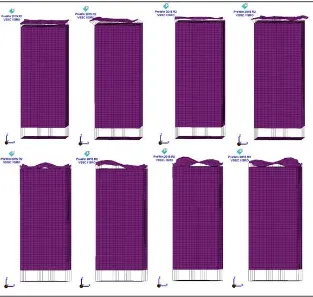
Fig. 5: 1st 8 Mode shapes of building with TMD
IV. CONCLUSION Following conclusions are deciphered from the present study:
1) Steel TMD with optimum frequency ratio, provided in the form of soft storey at building top is found to be effective in arresting seismic response of building.
2) TMD in the form of soft storey, tuned to fundamental frequency can bring about response reduction within a massive range of 20-43% along Y whereas it can only contribute a mere reduction up to 14% along X.
3) TMD can efficiently reduce the response for mass ratios ranging from 0.8 to 2 %.. It is found ineffective for mass ratios less than 0.8 and beyond 2%.
4) TMD as soft storey is efficient in reducing at all storey levels.
REFERENCES
[1] Bakre, S.V. (2002), “Seismic response of multistoried buildings with Weak storey at the top”, National seminar on structural dynamics in civil engineering
(SDCE-2002), 18-19th July 2002, IISC Bangalore.
[2] Thawre, R.Y (2004) “Seismic analysis of multistoried buildings with TMD”, submitted as M.Tech. Thesis, VRCE Nagpur.
[3] Pinkaew T., Lukkunaprasit P. And Chatupote P. (2003), “Seismic effectiveness of tuned mass dampers for damage reduction on structures”, Engineering
Structures, 25, 39-46.
[4] Sadek, F (1997), “A method of estimating the parameters TMD for seismic applications”, Earthquake Engineering and Structural Dynamics, 26, 617-635.
[5] Thakur V.M.1, Pachpor P.D “Seismic Analysis of Multistoried Building with TMD (Tuned Mass Damper)”; International Journal of Engineering Research