Usage-Centric Mobile Business Performance Metrics:
Framework and Case Study
Ahyoung Kim
1, Junwoo Lee
1, Mucheol Kim
2*1 Electronics and Telecommunications Research Institute, 218, Gajeong-ro, Yuseong-gu, Daejeon, Korea. 2 Sungkyul University, 53, Sungkyuldaehak-ro, Manan-gu, Anyang, Gyeonggi-do, Korea.
* Corresponding author. Tel.: +82-10-2733-7216; email: [email protected] Manuscript submitted May 15, 2017; accepted July 16, 2017.
doi: 10.17706/jcp.13.5.503-510
Abstract: The increases in mobile-phone users changed paradigms in mobile business and extended business area and its applications. Therefore, various attempts have been made to succeed in mobile business. In this study, performance indicators for measuring business performance are proposed, also using proposed performance indicators framework for analyzing usage-focused mobile business is suggested. Based on the characteristics of mobile business, performance indicators are classified to Customer Retention and Product Engagement. The customer’s usage data automatically collected from mobile application is analyzed by 2 performance indicators. In this paper, we will suggest the mobile business analysis framework for performance indicators, and introduce the result of analysis through case-study. The suggestion and mobile business analysis framework from this study support decision making in mobile business area such as mobile marketing and mobile commerce.
Key words: Mobile business, performance measure, performance metrics, usage analysis.
1.
Introduction
As the usage of mobile device and mobile data service increased, the paradigm of the IT industry has been changing rapidly in hardware-centered service to mobile-based software and application service. Since 2009 when iPhone was introduced and smartphones spread rapidly, the structure of IT industry is changed rapidly to mobile focused industrial structure [1]-[3].
Accelerating the spread of mobile devices and generalizing the usage of mobile internet, various new mobile services are appeared, and our lifestyle also is changed to mobile focused lifestyle. Through mobile we can connect to the web anytime, anywhere. Therefore, we can provide diverse services immediately at any time, in any location through various application of smartphone device [4], [5]. Furthermore, based on the enormous speed and impact on other industries, the importance is increasingly growing.
Based on previous experience, infrastructure evolution regardless of the type and form has had a significant impact on overall economy industries. Therefore, the changes of IT industrial structure and lifestyle are reasonable.
Therefore, in this study, Customer Retention and Product Engagement are selected as mobile business performance indicators. Selected performance indicators should be aimed to optimize in mobile business, and the performances are measured with customer’s usages. For this purpose, usage focused mobile business analysis framework that can analyze performance indicator is suggested, and using proposed framework the result of the experimental data is analyzed.
In chapter 2, based on literature review we will analyze performance indicator for E-business and the feature of the mobile business, and derive the mobile data analysis and the related implications of previous research. Based on this theoretical research, in Chapter 3, we will derive the performance indicators for mobile business. Considering derived performance indicators, in Chapter 4, we will design usage-focused mobile business analysis framework. In Chapter 5, we will analyze the result of experimental data. Finally, in Chapter 6, we will provide some concluding remarks regarding our proposal.
2.
Related Work
2.1.
Mobile Business Performance Metrics
Mobile business is exchanging products, services and information using mobile technology [6]. Namely, mobile business includes business process that makes it possible to trade products, services, and information through mobile device[7]. In other word, mobile business it the administrative tool that adjusts and manages the communication of organization using mobile technology including wireless internet access [8]. Moreover, it could be understood as expended web-based electronic commerce, also E-commerce and E-business that provides service through mobile and wireless network are considered as part of business [9].
Table 1. Characteristics of Mobile Business
Characteristics Description
Primary Characteristics
(Mobility)
Reachability Attributes which can be contacted anywhere anytime
Ubiquity Attributes which can fulfil the need both for real-time information and for communication anywhere
Convenience Attributes which are always at hand and are easy to use
Security Attributes which are provided authentication of the owner and enables a higher level security
Secondary Characteristics
(Localization)
Localization Attributes which can know where the users is physically located at any particular moment
Instant Connectivity Attributes which can be easier and faster to access information
Personalization Attributes which can be personalized to represent information or provide services in ways appropriate to a specific users
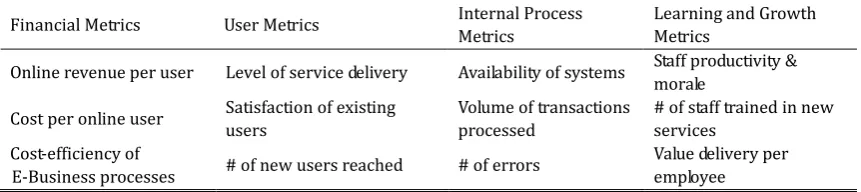
Table 2. Example of Performance Metrics for e-Business
Financial Metrics User Metrics Internal Process Metrics
Learning and Growth Metrics
Online revenue per user Level of service delivery Availability of systems Staff productivity & morale
Cost per online user Satisfaction of existing users Volume of transactions processed # of staff trained in new services Cost-efficiency of
E-Business processes # of new users reached # of errors
Value delivery per employee
presents the characteristics of Mobile Business.
E-business performance can be measured in several ways, ranging from Business contribution, user orientation, operational excellence, and ultimately, to future orientation [11]-[13]. Table 2 presents the example of performance metrics for e-Business.
2.2.
User Data Analysis Platform
The Flurry is the most well-known product and supports more features and platforms than the other products in spite of the free software. The Flurry analytics make deals with the diverse mobile OS including the BlackBerry and have the capability of collecting data from the mobile device by using the predefined by the Flurry. Additionally, the Flurry service is operated by the big data file system to take care of increasing the amount of data suddenly. The difference between the Flurry and our approach is that our approach can support the real time analysis and is custom-built with a secured data.
The MixPanel is commercial software and supports the complex query creation by using GUI editor instead of the CLI (Command Line Interface) [14], [15]. Additionally, this system makes the people to satisfy the analysis result through adequate UI according with a characteristic of the user data. KSuite have a user acquisition analysis, custom events tagging & timeline analysis in general. For the mobile analysis, this system has a special capability like view by device, OS, and revenue tracking. The Countly have similar analysis features based on the statistics like the products mentioned before and have an excellent usability through many types of report creation [16]. The difference from our approach is that these systems are focused on the UI to enhance the functions already made before, but our approach is trying to make a new novel algorithm based on the big data system, cloud environment. Finally, both the Apple and the Google have supported the good analysis tool for the digital content app too. However, these tools have a handicap that these tools are only for the smart content app bought or downloaded in their system.
3.
Mobile Business Analysis Framework
The mobile business analysis framework has a flexible architecture to satisfy the dynamic requests of users for an analyzed service. First, the mobile business analysis framework collects the usage frequency for the mobile product out of mobile devices that have installed the library for the analysis service. At this time, the data used for the identification of the user is ignored because most people are currently worried that Google and Apple have collected data related to them. Second, the usage frequency is analyzed based on many factors such as the location and device. The frequency of mobile apps based on time is calculated again according to the hour of the day, day of the week, and month of the year because the framework has to generate corresponding candidates for diverse user contexts. The frequency of mobile apps based on the location and device is calculated again, such as the time according to the latitude/longitude, the framework name, and the manufacturer. Additionally, this framework focuses on how long the mobile app is used, along with its frequency of use, as YouTube and Video Player applications are usually used for a long time after being executed. Finally, this framework considers the recentness of the mobile app as an important factor to determine what mobile apps are novel for users because the lifecycle of a mobile app is very short, and users consistently seem to want to use up-to-date applications.
R denote the list of candidates considered for the reliability of the mobile app based on factors such as the time, location, and device.
R
,
R
,
R
R
time location device (1)where Rtime is an ordered list of mobile app based on time, Rlocation is a list of mobile apps based on the
Rtime is an ordered list of mobile apps analyzed by the model using a collaborative filtering algorithm
based on the hour of the day instead of the user. This means that Rtime consists of the mobile apps selected
and ordered by the algorithm, which analyses the usage frequency, duration, and recentness of the mobile app considering the relative importance based on the hour of the day. The others, Rlocation and Rdevice, are the
means of filtering the candidate applications as an intermediate results from an ordered list selected according with the Rtime. In other words, the model can find which mobile apps are good for the users out of
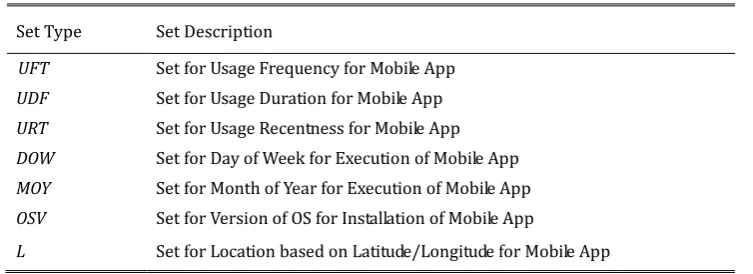
the intermediate results by using the location and device. These two parameters are configured based on the users’ decisions and are acceptable for the model to determine which mobile app is the best candidate. The model determines which factors the users want to use for the analysis service based on the user context, and sets a value for the variables α, β and γ. Table 3 presents the performance measurement set.
UFT,UDT,URT,DOW, MOY,OSV,L
U (2)
Table 3. Performance Measurement Set
Set Type Set Description
UFT Set for Usage Frequency for Mobile App
UDF Set for Usage Duration for Mobile App
URT Set for Usage Recentness for Mobile App
DOW Set for Day of Week for Execution of Mobile App
MOY Set for Month of Year for Execution of Mobile App
OSV Set for Version of OS for Installation of Mobile App
L Set for Location based on Latitude/Longitude for Mobile App
4.
Case Study
In this paper, we collected the data to evaluate the model explained in the previous chapter over a three-month period using the mobile devices of our team members. In particular, this evaluation is for Google Android OS because the development of the data-gathering algorithm with a client library is relatively easier than for Apple iOS.
The method used to analyze the usage frequency for the mobile apps based on the data collected out of the mobile devices was introduced in the previous chapter. As mentioned before, we determined the standards to measure how many times mobile apps are used by the hour instead of by the day or month because the general usage patterns for the mobile apps fluctuate severely. We collected 120 mobile apps, excluding some applications such as middleware applications from Google and the manufacturer because these applications are useless for collecting user context data.
Generally the importance of the mobile apps will be determined by the how many people use a certain of the mobile app within a period of the time. In this paper, we add some features to normalize the difference between the usage patterns by an hour in a day in addition to this general characteristic. First of all, we have measured the relationship between an hour in a day based on the usage frequency and the usage duration to determine what time is really important for all mobile apps. And we have analyzed and calculated the objective similarity value of all mobile apps based on the measurement for the relationship between hours in a day.
the mobile app in comparison with the number of the frequency of the other hour in a day. For example, a certain of the mobile app was invoked one thousand times at an hour in a day having ten thousand times. The other mobile app was collected twenty times at an hour in a day with forty times execution..
4.1.
Performance Measure of Message Types
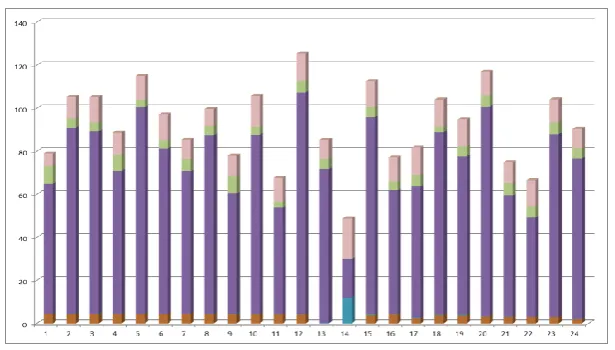
Fig. 1 shows the usage pattern for many apps related with message that are the most famous mobile app in South Korea. As you can see, the graph of the real data for the usage frequency fluctuates heavily according with the time dimension. So the graph for the average value does. However, the graph for the model explained in this paper shows that there is at a high level in spite of the distribution of the real data because the analysis model normalizes the difference between the hours in a day and recalculates the similarity by using the relative weight for the mobile app. The graph based on the usage duration shows that the analysis model in this paper suggests which time is important for this mobile app.
Fig. 1. Usage pattern analysis for message application.
4.2.
Performance Measure of SNS Types
SNS applications are the most popular applications because mobile devices are consistently connected to other people based on the network environment. Fig. 2 shows the usage pattern for SNS applications. SNS applications are popular in that many people want to check and see what kinds of activities other people are currently doing. In addition, the usage frequency and duration of SNS applications are relatively higher than other kinds of mobile applications.
4.3.
Relationship between the Hours in a Day
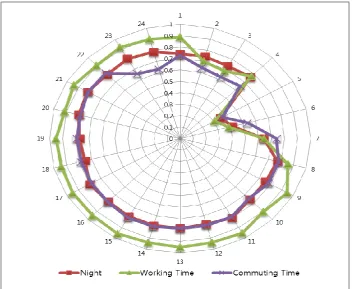
Fig. 3 shows that the relationship between the hours in a day based on the usage frequency of the mobile apps for this experiment. In the commuting time, the similarity of the times in the commuting time is higher than the other times in a day such as the night and the dawn. Similarly, the similarity of the times in a working time is higher than the other times in a day. This phenomena shows that we have to shorten the usage data gap between the hours in a day and normalize the real data by using this similarity result. After the normalization process, we have evaluated the usage pattern based on the frequency and the duration for the usage of the mobile app all candidates within our experiment environment. We have analyzed the equation introduced in this paper by comparing with the two kinds of measure that is a real data and an average value at an hour in a day.
Fig. 3. Relationship between the hours in a day.
5.
Conclusion
In this paper, we proposed usage-centric mobile business analysis framework via performance metrics and showed a case study with test data. The user data analysis platform consists of a client library and server part based on a large data system. The client library has the main responsibility for collecting user data from the mobile devices and sending these data to the server part of the analysis platform. The server part analyzes the received data using a predefined data pattern and stores the data in a large data system.
suggestion and mobile business analysis framework from this study support decision making in mobile business area such as mobile marketing commerce.
Acknowledgment
This work was supported by the Ministry of Science, ICT and Future Planning (MSIP, Korea).
References
[1] Bremser, W. G., & Chung, Q. B. (2005). A framework for performance measurement in the e-business environment. Proceedings of the 6th International Conference on Electronic Commerce: Vol. 4.Electronic Commerce Research and Applications (pp. 395-412).
[2] Girardello, A., & Michahelles, F. (2010). AppAware: Which mobile applications are hot? Proceedings of the 12th International Conference on Human Computer Interaction with Mobile Devices and Services (pp. 431-434).
[3] Davidsson, C., & Moritz, S. (2011). Utilizing implicit feedback and context to recommend mobile applications from first use. Proceedings of the Workshop on Context-Awareness in Retrieval and Recommendation (pp. 19-22).
[4] Böhmer, M., Ganev, L., & Krüger, A. (2013). Appfunnel: A framework for usage-centric evaluation of recommender systems that suggest mobile applications. Proceedings of the 2013 International Conference on Intelligent User Interfaces (pp. 267-276).
[5] Lee, K. H., Lee, Y. J., Choi, H., Chung, Y. D., & Moon, B. (2012). Parallel data processing with MapReduce: A survey. ACM SIGMOD Record, 40(4), 11-20.
[6] Paavilainen, J. (2002). Mobile Business Strategies: Understand the Technologies and Opportunities.
London: Addison-Wesley Professional.
[7] Kalakota, R., & Robinson, M. (2002). M-Business: The Race to Mobility. New York: McGraw-Hill.
[8] Scornavacca, E., & Barnes, S. J. (2004). M-banking services in Japan: A strategic perspective.
International Journal of Mobile Communications, 2(1), 51-66.
[9] Mylonopoulos, N. A., & Doukidis, G. I. (2003). Introduction to the special issue: Mobile business: Technological pluralism, social assimilation, and growth. International Journal of Electronic Commerce, 8, 5-22.
[10] Müller-Veerse, F. (1999). Mobile Commerce Report. London: Dulacher Corp.
[11] Van Grembergen, W., & Amelinckx, I. (2002). Measuring and managing e-business projects through the balanced scorecard, system sciences. Proceedings of the 35th Hawaii International Conference on System Sciences.
[12] Van Grembergen, W., & Saull, R. (2001). Information technology governance through the balanced scorecard. Proceedings of the 34th Hawaii International Conference on System Sciences(HICSS).
[13] Rosemann, M. (2001). Evaluating the management of enterprise systems with the balanced scorecard.
Information Technology Evaluation Methods and Management, Hershey, 171-184. Idea Group Publishing.
[14] Woerndl, W., Schueller, C., & Wojtech, R. (2007). A hybrid recommender system for context-aware recommendations of mobile applications. Proceedings of the 23rd International Conference on Data Engineering Workshop (pp. 871-878).
[15] Karatzoglou, A., Baltrunas, L., Church, K., & Böhmer, M. (2012). Climbing the app wall: Enabling mobile app discovery through context-aware recommendations. Proceedings of the 21st ACM International Conference on Information and knowledge Management (pp. 2527-2530).
recommender systems that suggest mobile applications. Proceedings of the 2013 International Conference on Intelligent User Interfaces (pp. 267-276).
Ahyoung Kim is a researcher in electronics and telecommunications research institute in Korea. Her research interests include mobile business, pattern analysis, context-aware technology, internet of things, and content technology. She received the B.S., M.S. degrees from the School of Computer Science and Engineering at Chung-Ang University, Seoul, Korea in 2007 and 2009.
Junwoo Lee is a principle engineering research staff in electronics and telecommunications research institute in Korea. His research interests include network technology, internet of things, and smart content technology. He received the B.S., M.S. degrees from the School of Computer Science and Engineering at Hanyang University, Seoul, Korea in 1996 and 1998.