Application Of Ekahau Real Time Location
Software For The Calibration Of Test Beds For
Wireless Network-Base Asset Location
Management System
Henry Akpan Jacob1
Department of Electrical/Electronic and Computer Engineering University of Uyo Akwa Ibom State
Nigeria
Kalu Constance2
Department of Electrical/Electronic & Computer Engineering, University of Uyo, Akwa Ibom, Nigeria
Aneke Chikezie Samuel3
Department of Electrical/Electronic and Computer Engineering, University of Uyo, AkwaIbom, Nigeria
Abstract In this paper, empirical research is conducted for the application of wireless network in real-time indoor asset location management system. Particularly, the aspect of the work presented in this paper entails setting up of Ekahau real-time location system (ERTLS), conducting site survey on selected test beds in the Faculty of Engineering located at the main campus of University of Uyo and calibrating the selected test beds with the Ekahau ERTLS for application in a wireless network-based real-time indoor asset location management system. The selected test beds in the Faculty of Engineering includes the FL3 classroom, the Computer Engineering laboratory, and the Engineering workshop. The site survey and calibration results show that the FL3 classroom and the Computer Engineering laboratory have very good calibration quality, signal strength, location coverage and data rate in almost all the surveyed areas whereas the Engineering workshop has poor results in some areas due to high electro-magnetic interference (EMI) present at various sections of the workshop. Specifically, the signal strength value for the FL3 classroom and the Computer Engineering laboratory is about -20dBm which is very good but that of the workshop test bed fall within -40dBm and -55dBm which is a fair value. Also, the data rate in the FL3 classroom and the Computer Engineering laboratory tends towards 150Mb/s which is a high data rate but that of the workshop test bed fall significantly below the value of 150Mb/s. In all, the site survey and calibration results show that the different test beds presented different characteristics that affected their survey metrics.
Keywords— Keyword Ekahau; real-time location system; calibration quality; signal
I. Introduction
The advent of different technologies such as
wireless networks, internet, geographical information
systems (GIS) and global positioning systems (GPS), have
introduced a new type of information technology called
location based service (LBS) [1,2,3,4,5]. Location based
service (LBS) is defined as the ability to locate a mobile
user geographically and deliver services to the user based
on his location [6,7,8,9,10]. Also, location based services can be defined as services that integrate a mobile device’s
location or position with other information so as to provide
added value to a user [11,12,13,14].
An Indoor Location System (ILS) is a term that describes a
technology that locates, monitors and tracks assets and
people using various positioning algorithms [15,16,17].
Ideally, such technologies do these in real time[18]. A
location system determines the location of an object (client)
in a particular space, such as an enterprise facility or
warehouse. Positioning technologies realize a number of
location-aware solutions through the coordinates of an
object. They are able to determine positions in real time.
Hence, location technologies are also referred to as time
location system (RTLS).In terms of implementation, there
are generally two approaches for the indoor location system
implementation [19].The first approach is to develop a
sensors focused primarily on location application [19]. The
second is to use an existing wireless network infrastructure
such as a WLAN to locate devices [19]. The first approach
has the positioning system designed from scratch. The
focus is on detecting the first path, and all the system
architecture building blocks are designed accordingly. For
the second approach, the use of the network infrastructure
in indoor positioning is also feasible, but more complex
algorithms are needed in order to compensate for overall
design.
For any RTLS to be applied in asset location management
system, the region where the asset is to be located and
monitored must be surveyed and calibrated using
appropriate software system and allied devices. One of such
software system is the Ekahau time location system (RTLS)
[20,21,22]. In this paper, the Ekahau RTLS software is used
to survey and calibrate selected test beds for deployment of
wireless network-base asset location management system.
The survey and calibration results are expressed in the
following metrics: asset calibration quality, signal strength
indicator (RSSI), location coverage and data rate. The case
study sites are located in the Faculty of Engineering of
university of Uyo and they include the FL3 classroom, the
Computer Engineering laboratory, and the Engineering
workshop. The details of the Ekahau RTLS software, the
survey and calibration procedure as well as the survey and
calibration results for the selected test beds are presented in
this paper.
II. Overview of Ekahau Real-Time Location System (ERTLS)
Ekahau real time location system (RTLS) software
system is a technology that enables automated monitoring
of asset or personnel location in real time. Ekahau RTLS
system relies on standard 802.11 a/b/g wireless networks
and it employs Wi-Fi access points’ signal strength
measurements for the tracking the asset or personnel
location[23]. Since it can utilize existing wireless network
infrastructure which makes it more cost effective to deploy
where wireless network is already in use. Besides, the
deployment of Ekahau RTLS does not interrupt network
activities. The basic structure of the Ekahau RTLS is made
up of the various components, as shown in Figure 1.The
Ekahau RTLS configuration is based on the wireless local
area network (WLAN) components along with the Ekahau
kits, as shown in Figure 2.
Figure1: Block diagram of the Ekahau RTLS
The WLAN infrastructure that is required for the Ekahau
system to operate consists of the following items:
i. Server (a computer system).
ii. Cables such as the Ethernet CAT-5 cables, power cables, etc.
iii. Wireless Adapter such as the Dlink’s wireless N-150 USB adapter).
iv. Access points (Aps) such as the Linksys
WAP610N.
The Ekahau kit comprise of software and hardware
components. The software components comprises of the
following items:
i. Ekahau Positioning Engine (EPE): ii. Tag Activator
iii. License File
iv. Ekahau Site Survey (ESS):
v. Ekahau Vision: Ekahau proprietary web application for assets location monitoring
The Ekahau kit hardware components are as follows:
i. Network Interface Card(NIC)-300
ii. Tags: The two tags used in this project work are
Figure2: Components of the Ekahau kit and the
WLAN[23]
Figure 3: Tags III. METHODOLOGY
A. THE STEPS FOR SETTING UP THE EKAHAU RTLS FOR THE CALIBRATION OF THE TEST
BEDS TO BE USED IN AN ASSET LOCATION MANAGEMENT SYSTEM
The following steps were followed in setting up the Ekahau RTLS:
i. Draw the test bed map to scale.
ii. Setting up a WLAN with static IP addresses assigned to the APs.
iii. Upload the test bed map to Ekahau site survey kit. iv. Scale the uploaded map to become radio map.
v. Conduct site survey and calibration.
vi. Obtain and interpret the survey metrics for the best site calibration.
B. THE CASE STUDY TEST BEDSMEASUREMENTS AND CHARACTERISTICS
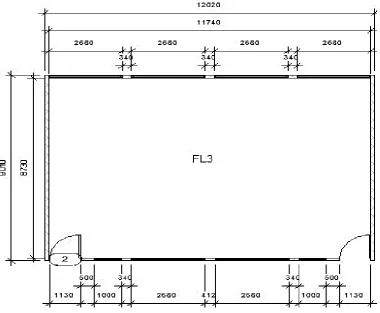
The cases study test environments (referred to as test beds) are the sites where the Ekahau RTLS was implemented. The test beds selected for the study is located in the Faculty of Engineering at the main campus of University of Uyo and they include; the FL3 classroom, Computer Engineering laboratory, and the Engineering workshop. The site measurements and floor plan for each of the test beds are presented in Figures 4, Figures 5 and Figures 6.
The FL3 classroom characteristics are as follows:
i. Sources of electro-magnetic interference (EMI): 8 ceiling fans, fluorescent bulbs.
ii. It is not too close to the densely populated machine area (workshop).
iii. Top floor of the popular Campus GD/FL block, therefore it has less movement of people when compared to the ground floor.
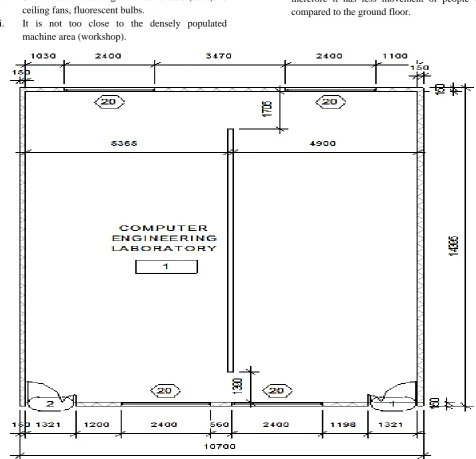
Figure 5: Site Measurements for Computer Laboratory with dimension of14.39 x 10.70 𝑚2 drawn at a scale of 1:100 The computer laboratory characteristics are as follows:
i. Sources of EMI: 6 ceiling fans, fluorescent bulbs,
inverters, computer monitors, voltage regulators.
ii. Relatively far from the densely populated machine
area (workshop). It is separated from the main
lecture halls. The laboratory is only used for
practical purposes; this means there will be lesser
movement of people when compared to the lecture
Figure6: Site measurements for Engineering Workshop with dimension of20.45 x 13.02 𝑚2 drawn at a scale of 1:100
The Engineering Workshop site characteristics are as
follows:
i. Sources of EMI: lathe machines, heavy wattage
bulbs, guillotine shear machine, drilling machine,
welding machines, power inverters, metallic vices,
iron benders.
ii. The most-populated machine area on campus.
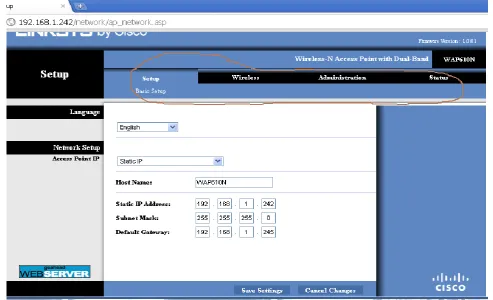
C. SETTING UP OF THE WLAN WITH STATIC IP
ADDRESSES ASSIGNED TO THE APS.
Linksys access point WAP610N was used in the
WLAN; it has a dual band access point (AP) that is
compatible with 802.11a/b/g/n radios. Configuration on the
Linksys access point WAP610N was done using the
graphical user interface (GUI) through the web application
Figure 7: Access point configuration
Notably, IP address class C with subnet 255.255.255.0
were used for the tags, the access points and the computers
used in the network. The IP address assigned to each device
are as follows:
a) Network Segment Used
192.168.10.[host] Subnet: 255.255.255.0
(/24 in slash notation)
b) Tags: 192.168.10.100 - 192.168.10.105 Subnet: 255.255.255.0
APs (Access Points): IP Address and Subnet
i. Ekahau_AP1
192.168.10.240 255.255.255.0
ii. Ekahau_AP2
192.168.10.241 255.255.255.0
iii. Ekahau_AP3
192.168.10.242 255.255.255.0
iv. Ekahau_AP4
192.168.10.243 255.255.255.0
v. Ekahau_AP5
192.168.10.244 255.255.255.0
c) Ekahau Positioning Engine:
192.168.10.24 Subnet: 255.255.255.0
d) Ekahau Site Survey (Laptop): i. LAN : 192.168.10.13
Subnet: 255.255.255.0
ii. WAN : 192.168.10.15
Subnet: 255.255.255.0
[Dlink Wireless Network Card was used for Sniffing with
Omnipeek Software]
D. ACTIVATION OF THE TAGS AND IMPLEMENTATION OF
THE EKAHAU SITE SURVEY
The tags are miniature electronic devices that send
the received RSSI information over the Wi-Fi network to
the EPE. The tags are assigned IP addresses for
identification on the network. The tags used for the work
are Ekahau T301-A and T301-B tags. For the T301-A Tag,
the media access control (MAC) address is located above
the identification sticker as shown in Figure 8 whereas for
the T301-B tag, the MAC address can be found behind the
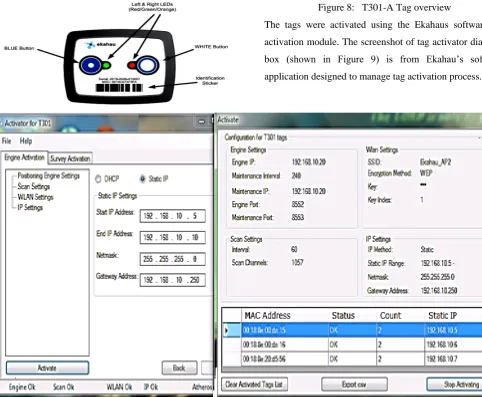
Figure 8: T301-A Tag overview
The tags were activated using the Ekahaus software tab
activation module. The screenshot of tag activator dialogue box (shown in Figure 9) is from Ekahau’s software
application designed to manage tag activation process.
Figure9: The screenshot of Ekahau’s tag activator dialogue box
After the WLAN was set up , the tags were
activated in the Ekahau real-time location system (ERTLS),
then , the site survey was conducted to calibrate the
locations within each of the test beds. Site survey
was conducted as follows:
i. The site maps were imported into the
Ekahau site survey (EPE) application
ii. The site maps were then scaled on the
application
iii. Calibration was carried out and site
survey metrics were obtained and
analysed.
The site survey metrics captured include calibration quality,
signal strength, data rate and location coverage. The site
survey results are presented in the next section.
IV. RESULTSAND DISCUSSION
A. SITE SURVEY AND CALIBRATION RESULTS: CALIBRATION QUALITY ANALYSIS
A good calibration will result into proper location
of the tag to a high precision on the radio map, while a poor
calibration will lead to error in tag placement.
Considering the legend shown on each site map below -
from low to high; the red indicates a low calibration quality,
yellow indicates fair calibration while the green indicates a
high calibration quality. Tags that fall within the green
portion will have more location accuracy while those within
the red areas will have lower location accuracy.
B. FL3 CLASSROOM– CALIBRATION QUALITY
The calibration map of the FL3 classroomis shown
in Figure 10;the entire is green. This test bed is separated
Figure10: Calibration Quality – FL3 Classroom
C. COMPUTER LABORATORY – CALIBRATION QUALITY
The calibration map of the Computer Laboratory is
shown in Figure 11; Figure 11 has all area green except
some few regions which means that there is very good
calibration quality, particularly for the regions in green
colour. On the other hand, the regions with red colour have
poor calibration quality. Two zones were created because
movement took place in those regions more frequently than
others. The visible purple colouredlines is a result of the
superimposed colours at the zones.
Figure11: Calibration Quality – Computer Laboratory
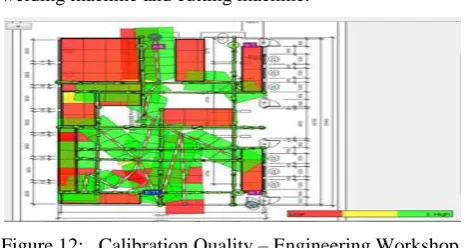
D. ENGINEERING WORKSHOP – CALIBRATION QUALITY
Unlike the other test beds, workshop is more prone
to electro-magnetic interference (EMI) because there are so
many machining processes running. Sources of EMI at the
workshop include, the lathe machine, drilling machine,
welding machine and cutting machine.
Figure 12: Calibration Quality – Engineering Workshop
The calibration map of the workshop shown in
Figure 12 has many fields as red which interprets low or
poor calibration quality in those areas. Most of the fields
coloured red are restricted areas especially the rectangular
portion (welding bay) at the top-left corner guided to
prevent accidents to operators. Less movement of people
takes place in those areas.
E. Site Survey and Calibration Results: Signal Strength Analysis
The signal strength metric, indicated as RSSI, is
the measure of the power present in a received radio signal.
Usually, the closer a device is to the network, the higher the
RSSI value measured. Also the closer the value is to zero,
the stronger the network strength.
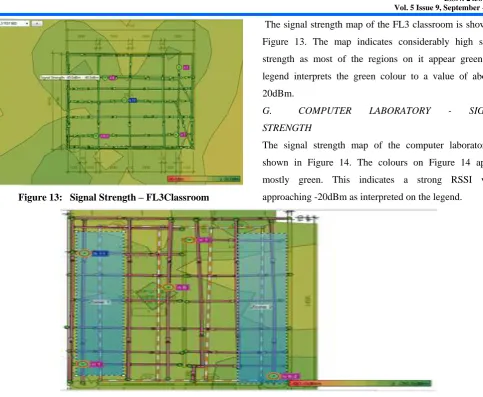
Figure 13: Signal Strength – FL3Classroom
The signal strength map of the FL3 classroom is shown in
Figure 13. The map indicates considerably high signal
strength as most of the regions on it appear green; the
legend interprets the green colour to a value of about
-20dBm.
G. COMPUTER LABORATORY - SIGNAL STRENGTH
The signal strength map of the computer laboratory is
shown in Figure 14. The colours on Figure 14 appear
mostly green. This indicates a strong RSSI value
approaching -20dBm as interpreted on the legend.
Figure 14: Signal Strength – computer Laboratory
H. ENGINEERING WORKSHOP – SIGNAL STRENGTH
Figure 15: Signal Strength – Engineering Workshop Unlike the signal strength map of the other test
beds, Figure 15 has lesser green palettes. From the legend
and -20dBm (strong). For the workshop, the RSSI value can
be estimated on the legend to fall within 40dBm and
-55dBm which is a fair value. The result is due to more EMI
present within the workshop test bed.
J. SITE SURVEY AND CALIBRATION RESULTS: DATA RATE ANALYSIS
Data rate quickly gives an estimate of the
achievable throughput per location.
Figure 16: Data Rate –FL3Classroom
The data rate map for the FL3 classroom is shown
in Figure 16. All portions on Figure 16 indicate green
colour. From the Ekahau software legend properties,
150Mb/s is a high data rate. Checking the legend, the test bed’s data rate strongly approaches 150Mb/s which shows
that the FL3 classroom has a high data rate.
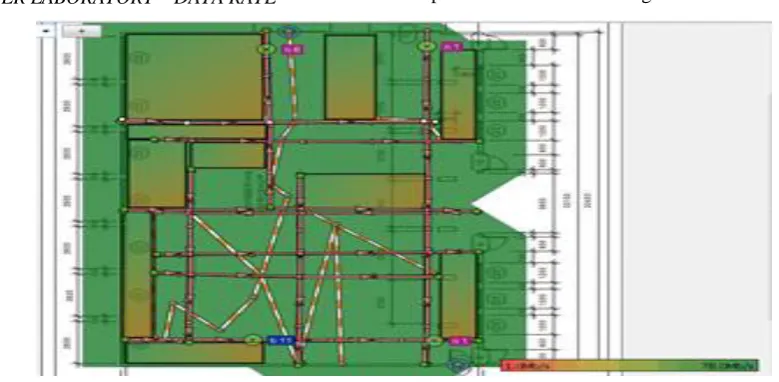
L. COMPUTER LABORATORY – DATA RATE
Figure 17: Data Rate – Computer Laboratory
The data rate map for the computer laboratory is
shown in Figure 17. Figure 17 indicates a green.
Considering the legend, the data rate strongly approaches
150Mb/s which is a good result.
M. ENGINEERING WORKSHOP – DATA RATE
Unlike the FL3 and computer engineering test beds, not all
portions on the workshop map in Figure 18 indicate a
green. Some parts are yellowish indicating a low data rate
at such areas. The reason for this difference is due to the
high EMI experienced in the workshop. It can be observed
that the yellowish portions are machine areas, restricted
portions and no walkthroughs areas.
Figure18: Data Rate – Engineering workshop
N. SITE SURVEY AND CALIBRATION RESULTS:
LOCATION COVERAGE ANALYSIS
The location coverage metric describes the amount
of area reached by the network. It is needed in the survey
to properly analyze the position of devices such as the APs
for maximum coverage distance.
Figure19: Location coverage – FL3 classroom
The location coverage map for the FL3 classroom is shown
in Figure 19. All portions on Figure 19indicate a green
except outside the test bed region. Based on the Ekahau
software legend, the map indicates excellent network
coverage.
P. COMPUTER LABORATORY – LOCATION COVERAGE
Figure20: Location coverage –Computer Laboratory
The location coverage map for the Computer
Laboratory is shown in Figure 20. Figure 20 indicates a
green in all the areas. According to the Ekahau software legend, the Computer Laboratory test bed’s location
network coverage is excellent.
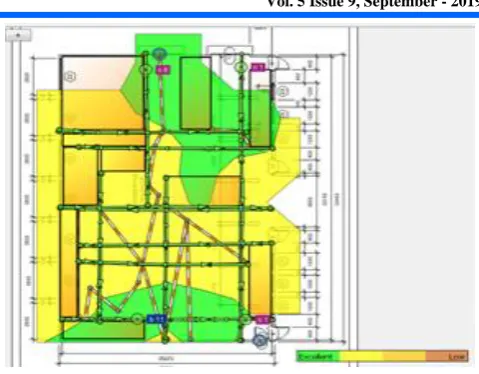
Q. ENGINEERING WORKSHOP – LOCATION COVERAGE
Just as expected, due to the high EMI present in the
workshop, not all portions on the map (Figure21)
indicate a green. Some areas in the map are green
while more portions are yellowish.
Figure 21: Location Coverage –Engineering Workshop
The green fields interpret excellent location coverage while
the yellow fields interpret fair location coverage. It can also
be observed that the yellow portions are machine areas,
restricted portions and no walkthroughs, and these regions
exhibit more EMI than others.
V. CONCLUSION
The application of Ekahau real time location system
(RTLS) software and allied devices in real time asset
location management system is presented. Specifically, the
Ekahau real time location system RTLS software and allied
devices were used to conduct site surveys on selected test
beds in the Faculty of Engineering located at the main
campus of University of Uyo. Furthermore, the Ekahau
RTLS software was used to calibrate the test beds for use in
a real time asset location management system. The different
test beds presented different characteristics that affected
their survey metrics; data rate, location coverage, signal
strength and calibration quality.
REFERENCES
1. Turk, T. (2006, September). Location Based Services (LBS) and Related Standards.
In International Symposium on Geospatial
Databases for Sustainable Development, Goa.
2. Kolvoord, R., Keranen, K., & Rittenhouse, P. (2017). Applications of location-based services and mobile technologies in K-12 classrooms. ISPRS International Journal of Geo-Information, 6(7), 209.
telecartography. Springer Science & Business Media.
5. Kiefer, P., Huang, H., Van de Weghe, N., &Raubal, M. (Eds.). (2018). Progress in Location
Based Services 2018. Springer International
Publishing.
6. Steinfield, C. (2004). The development of location based services in mobile commerce. In E-life after the dot com bust(pp. 177-197). Physica, Heidelberg.
7. Abulleif, T., & Al-Dossary, A. (2008). Location based services (lbs). In Third National GIS Symposium in Saudi Arabia.
8. Ali, A. A. M., Ahmad, N. A., Sahibuddin, S., &Anuar, M. S. M. (2017). Location-based Services: A study on applications and services. Open International Journal of Informatics (OIJI), 5(2), 7-18.
9. Steinfield, C. (2004). The development of location based services in mobile commerce. In E-life after the dot com bust(pp. 177-197). Physica, Heidelberg.
10. Kushwaha, A., &Kushwaha, V. (2011). Location based services using android mobile operating system. International Journal of Advances in Engineering & Technology, 1(1), 14.
11. Dru, M and Saada, S. (2001). Location-based Mobile Services: The Essentials. Alcatel Telecommunications Review, pp. 71-76. 12. Spiekermann, S. (2004). General Aspects
of. Location-based services, 9, 14-33.
13. Singhal, M., & Shukla, A. (2012). Implementation of location based services in android using GPS and web services. International Journal of Computer Science Issues (IJCSI), 9(1), 237. 14. da Rocha, R. C. A. (2004). Middleware for
Location-based Services. Laboratory for Advanced Collaboration, PontifıciaUniversidadeCatolica do Rio de Janeiro, 25, 1443-1454.
15. Torres-Solis, J., Falk, T. H., &Chau, T. (2010). A review of indoor localization technologies: towards navigational assistance for topographical disorientation. In Ambient Intelligence. IntechOpen.
16. Curran, K., Furey, E., Lunney, T., Santos, J., Woods, D., & McCaughey, A. (2011). An evaluation of indoor location determination technologies. Journal of Location Based Services, 5(2), 61-78.
17. Gosai, A., & Raval, R. (2014). Real Time Location based Tracking using WIFI Signals. International Journal of Computer Applications, 101(5).
18. Koyuncu, H. and Shuang, Y. ( 2010). A Survey of Indoor Positioning and Object Locating Systems. International Journal of
Computer Science and Network Security (IJCSNS), 10(5): 122-146.
19. Nuño-Barrau, G., & Páez-Borrallo, J. M. (2006). A new location estimation system for wireless networks based on linear discriminant functions and hidden Markov models. EURASIP Journal on Advances in Signal Processing, 2006(1), 068154. 20. Curran, K., Furey, E., Lunney, T., Santos, J.,
Woods, D., & McCaughey, A. (2011). An evaluation of indoor location determination technologies. Journal of Location Based Services, 5(2), 61-78.
21. Schrooyen, F., Baert, I., Truijen, S., Pieters, L., Denis, T., Williame, K., &Weyn, M. (2006). Real time location system over WiFi in a healthcare environment. Journal on Information Technology in Healthcare, 4(6), 401-416.
22. Zirari, S., Canalda, P., & Spies, F. (2010, June). WiFi GPS based combined positioning algorithm.
In 2010 IEEE International Conference on
Wireless Communications, Networking and
Information Security (pp. 684-688). IEEE.
23. Ekahau (2006). Comparison of Wireless Indoor Positioning Technologies. An Ekahau