ISSN: 2149-214X
www.jeseh.net
Student Understanding of a Simple
Heating Curve: Scientific Interpretations
and Consistency of Responses
Paul G. Jasien
California State University
To cite this article:
Jasien, P.G. (2018) Student understanding of a simple heating curve: Scientific
interpretations and consistency of responses.
Journal of Education in Science, Environment
and Health (JESEH), 4
(2), 172-182.
DOI:10.21891/jeseh.432526
This article may be used for research, teaching, and private study purposes.
Any substantial or systematic reproduction, redistribution, reselling, loan, sub-licensing,
systematic supply, or distribution in any form to anyone is expressly forbidden.
Authors alone are responsible for the contents of their articles. The journal owns the
copyright of the articles.
Student Understanding of a Simple Heating Curve: Scientific
Interpretations and Consistency of Responses
Paul G. Jasien
Article Info
Abstract
Article History
Received:
10 September 2017
This work seeks to elucidate undergraduate science students' basic knowledge of concepts related to the energy changes for a simple heating curve and their ability to integrate related concepts. The participants were drawn from first and second semester General Chemistry classes, as well as junior/senior level Physical Chemistry classes at a four-year public university in the United States. The research instrument for this study was developed and tested over an 18-month period from preliminary data from students at the same university. The data were analyzed for students' basic knowledge and the ability to make connections between related concepts. A definite lack of demonstrated skill in integrating multiple concepts was revealed at all student levels with respondents often giving inconsistent answers to related questions. It is suggested that these critical thinking skills can be cultivated in students through various active learning pedagogies based on explicit multi-concept problem solving exercises, rather than the usual simple ones that test concepts individually.
Accepted: 09 May 2018
Keywords
Misconceptions Heating curves Phase changes Concept integration Kinetic-molecular theory
Introduction
The study of energy changes during chemical and physical processes is a concept that pervades all levels of chemistry instruction. The ideas are imbedded in the United States (U.S.) Next Generation Science Standards
(NGSS, 2016) for middle through high school. Beginning in middle school and continuing at subsequent grades, the standards discuss the role that energy transfer plays in various processes and also proposes introducing some ideas from Kinetic Molecular Theory (KMT) as one of the Disciplinary Core Ideas (PS3.A): “Temperature is a measure of the average kinetic energy of particles.” The relationship of a particle's average kinetic energy (KE) to its temperature as stated in KMT is of fundamental importance in understanding the physical world at the particulate level. KMT was cited as one of the six "Great Ideas" of chemistry that should be taught in General Chemistry (Gillespie, 1997). However, students sometimes have difficulty integrating the ideas of molecular motion and KMT as was noted by Osborne and Cosgrove (1983) many years ago when they wrote, "Further, more ideas to do with particles moving and colliding appeared to be understood by older pupils, but sustained probing of these ideas did not produce sound scientific explanations in terms of intermolecular forces or of loss of kinetic energy" (p. 830).
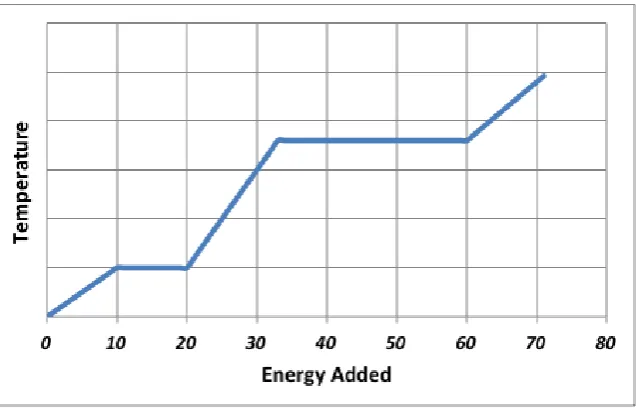
One application of the concept of KMT is to phase transitions of simple substances. As part of learning about this concept, a simple “Temperature vs. Energy Added” heating curve for a substance is typically presented (Figure 1) and discussed in physical science and chemistry textbooks from middle school through college. The associated discussion often centers around the fact that the temperature during phase transitions is constant. The simple shape of this plot, along with the associated phases, are easily memorized by students at the pre-college level. On the other hand, the more difficult ideas such as the relationship of the positively sloped regions to the heat capacity and the lengths of the horizontal regions to the enthalpies of fusion and vaporization are introduced later in a student's physical science training. A critical examination of college students' knowledge of these horizontal regions and their relationship to energy changes provides the context for the current report.
the investigation by Viennot (1997) who examined yet another area of difficulty that is related to energy exchange during phase transitions. He noted that some learning difficulties may be related to the fact that the transfer of energy does not have to lead to an increase in temperature for a phase change and pointed out that one alternative belief is that the maximum temperature for a substance is the boiling point. Lastly, in the work of Hwang and Hwang (1990), as summarized by Chang (1999), it was reported that a number of students at grade levels from middle school to university have difficulty understanding the balance of energy when a liquid is boiling and believe that the temperature would keep rising upon heating. A previous investigation of phase transitions by Jasien (2013) also noted confusion related to the relationship of temperature and energy transfer during phase transitions among college students.
Figure 1. A typical "Temperature vs. Energy Added" plot
College-level chemistry textbooks have widely varying coverage of heating curves and the analysis of them in terms of KE and PE changes. In addition, these books usually only briefly mention the related concepts of KMT that explain phase transitions. For example, one widely used U.S. chemistry textbook by Mcmurry et al. (2012) states, "Once the temperature of the water reaches 100°C, addition of further heat again goes into overcoming intermolecular forces rather than into increasing the temperature as indicated by the second plateau at 100°C on the heating curve" (p. 361).
Another commonly used textbook by Zumdahl & Zumdahl (2014) describes changes in potential energy (PE) at the melting point of solid water and mentions intermolecular forces, but not KE as follows, "At this temperature, called the melting point, all the added energy is used to disrupt the ice structure by breaking the hydrogen bonds, thus increasing the potential energy of the water molecules" (p. 402).
Spencer et al. (2006) gives a much more complete description by explaining the associated energy changes during the phase transition as: "At the boiling point of the liquid, the energy input from heating overcomes the intermolecular forces that attract the molecules to one another. Since the energy is used to overcome the intermolecular forces, there is no increase in the kinetic energy of the molecules and hence no change in the temperature of the system" (p. 321).
Method
Participants
The data reported in this work was collected from students at a mid-sized (~12,000+ student) public university in the U.S. The students surveyed came from a ethnically diverse group from a university that is classified by the federal government as an Hispanic Serving Institution. Although no specific gender or ethnicity information was collected during the administration of the assessment, it would be expected that the distribution of the backgrounds of the respondents reflects the diversity of the university, which means that greater than 50% of the students in all groups were female. The protocol for the data collection was approved by the University Institutional Review Board for Research on Human Subjects. Data came from various groups over the period from Fall 2014 to Spring 2016. A total of 181 2nd-semester General Chemistry (GC2) students from five
sections, 76 Physical Chemistry (PHC) students from two sections of a course covering thermodynamics and chemical kinetics, and 72 1st-semester General Chemistry (GC1) students from one section were assessed. The
GC2 sections were taught by two experienced instructors in the Department, while one of the two PHC sections and the GC1 section were taught by the author. In all cases, the assessment was administered a few weeks after the appropriate material was discussed in class and the students had already been tested through a course exam.
Data Collection and Analysis
The assessment instrument used in this investigation was developed over an 18-month period that involved collecting preliminary data from 2nd-semester General Chemistry and upper-division Physical Chemistry
students. In the early development stages, questions on the topics of phase transitions and energy changes were asked in open-ended response format. Analysis of the answers to the questions allowed for the categorization of common responses, which were used to develop a multiple-choice based assessment instrument. This test-version of the assessment consisted of some basic questions on a "Temperature vs. Energy Added" graph (Figure 1), followed by specific sets of paired questions about the associated energy changes and the reasons for them. The questions were reviewed by another experienced faculty member in the department for clarity, to assure that students would understand them and provide responses that would answer the proposed research question.
A test-version of the assessment was administered to several classes of GC2 and PHC students. Analysis of these results led to minor modifications in the wording of some questions/answers to remove ambiguities and eliminate seldom chosen responses. The result was a final assessment consisting of: (i) four recall-type questions on KMT, KE, and the interpretation of a heating curve (Box 1), and (ii) three paired synthesis questions related to changes in the total energy (E), KE, and PE during a phase transition (Box 2). Because the development of responses was based on student essays, it is believed that questions and answers, as posed, provide sufficient insight into the thought processes of students to address the primary research question.
Box 1: The four "recall-type" questions used in this work.
1. According to Kinetic Molecular Theory, the average kinetic energy of a collection of particles is directly related to the particles’
a) temperature b) mass c) volume d) potential energy e) All of the above.
2. Kinetic energy is best described as:
a) stored energy due to the position or condition of an object b) energy due to an object’s motion
c) the energy available to do work on another object d) a measure of heat energy
e) All of the above.
3. The phase(s) of the substance most likely to exist in the region between 20 and 33 units of energy being added is/are:
a) solid b) liquid c) gas d) solid and liquid e) liquid and gas
4. The phase(s) of the substance most likely to exist in the region between 33 and 60 units of energy being added is/are:
Separate statistical analyses of the responses of the five sections of GC2 and the two sections of PHC students were done in two ways to check for inter-section differences for each of the two groups. First, a point system for the correct answers and associated reasons was used to calculate an overall score for each student. The overall mean scores were compared using either an ANOVA (GC2 – 5 sections) or independent samples t-test (PHC – 2 sections). These results indicated no significant difference between sections for the GC2 groups [F(4,176) = .85,
p = .50] or for the PHC groups [F(1,74) = .075, p = .78]. Additionally, the distribution of responses (i.e. A, B, C, D, E) for each question was examined for differences using a simple chi-square test. Only one question of the ten for one section of the GC2 group showed a statistically significant difference (p < .05) in the distribution of the responses. Based on these results, the five sections of GC2 students were grouped together (N = 181). For the two sections of the PHC students, none of the ten questions showed a significant difference in the distribution of responses, i.e. all p-values > .05, and both sections were grouped (N = 76).
Box 2: The six "analysis-type" questions used in this work.
5. What happens to the total energy of the substance in the region between 33 and 60 units? a) It increases. b) It decreases.
c) It remains constant. d) It could increase or decrease depending on the substance.
6. The best reason for the answer to question 5 is:
a) There is no change in the temperature of the substance. b) Energy is being transferred into the substance.
c) The Law of Conservation of Energy holds. d) The particles are moving faster.
e) There is no physical or chemical change.
7. What happens to the kinetic energy of the substance in the region between 33 and 60 units? a) It increases. b) It decreases.
c) It remains constant. d) It could increase or decrease depending on the substance.
8. The best reason for the answer to question 7 is:
a) There is no change in the temperature of the substance. b) Energy is being transferred into the substance.
c) The Law of Conservation of Energy holds. d) The particles are moving faster.
e) There is no physical or chemical change.
9. What happens to the potential energy of the substance in the region between 33 and 60 units? a) It increases. b) It decreases.
c) It remains constant. d) It could increase or decrease depending on the substance.
10. The best reason for the answer to question 9 is:
a) There is no change in the temperature of the substance. b) Energy is being transferred into the substance.
c) There is no physical or chemical change.
d) The change in potential energy is opposite that of the kinetic energy. e) Chemical bonds are being broken.
Results and Discussion
The presentation and discussion of the data from this study is divided into three parts. The first relates to questions assessing lower-order cognitive skills associated with the recall questions (Q1-Q4), the second examines the abilities of students to analyze energy changes during a phase transition (Q5-Q10), while the third describes the ability of students to choose answers that are self-consistent. These latter two give information on students' abilities to "apply" and "analyze" as categorized in Bloom's Taxonomy.
Recall Questions
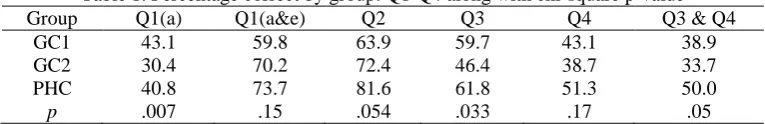
Given in Table 1 are the results for Q1-Q4, which examined knowledge that can best be categorized as simple recall. The percentage of correct responses in column Q1(a) of Table 1 includes only those students who correctly answered (a). The column labeled Q1(a & e) gives the percentage of students choosing answer (a) (correct) plus those answering (e) (partially correct).
As can be seen from Table 1, the percentage of students correctly answering each of the four questions is conspicuously lower than might be expected. This is consistent with what other researchers have concluded about students' alternative conceptions of basic topics (Barke et al., 2009; Bodner, 1991; Kind, 2004; Mulford et al., 2002). For two of the four questions there is a statistically significant difference among the groups examined, with the GC2 students scoring lower in the majority of categories.
Table 1. Percentage correct by group: Q1-Q4 along with chi-square p-value
Group Q1(a) Q1(a&e) Q2 Q3 Q4 Q3 & Q4
GC1 43.1 59.8 63.9 59.7 43.1 38.9
GC2 30.4 70.2 72.4 46.4 38.7 33.7
PHC 40.8 73.7 81.6 61.8 51.3 50.0
p .007 .15 .054 .033 .17 .05
The pattern of correct responses is not generally consistent with what one might expect, as it does not mirror the educational level of the students. The fact that the GC1 students overall perform better than the GC2 students in some categories may be attributed to the fact that many of the GC2 students did not take the 1st-semester course
in the preceding semester and therefore the information may not be as fresh in their memories, when compared to the GC1 students. On the other hand, the 2nd-semester course at the university specifically addresses the
concept of enthalpy changes in phase transitions at a much higher-level than is done in the 1st-semester course,
so this material has been recently "covered". For the PHC students, the relationship between temperature and the translational KE, , had been recently discussed in the context of the molar heat capacity for a perfect monatomic gas. An interesting result shown in Table 1 is that although there is a statistically significant difference between groups in correctly identifying the pure liquid region of the phase diagram (Q3), this is not true for the liquid-vapor phase change region (Q4).
With respect to the question on KMT (Q1), there was confusion among students about what KMT posits. This led to a large percentage of students in the GC2 and PHC groups selecting the response (e), even though it included the answers: volume and potential energy. One might speculate that the reason for this is that students recalled that the formula for KE is ½ mv2 and therefore the only "reasonable" response that included both
temperature and mass was (e). When including answers (a) and (e) any significant differences between the groups on Q1 vanish.
Energy Change Questions
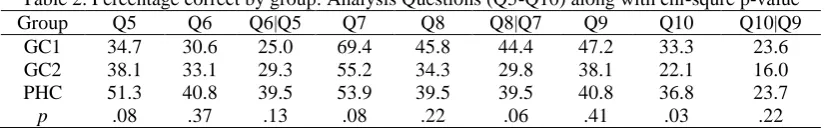
Table 2 gives the percentage of correct responses for questions dealing with the changes in E (Q5), KE (Q7), and PE (Q9) during the liquid to vapor phase change. The results for the "reasons" for the respective changes (Q6, Q8, Q10) are also tabulated, independent of whether students had correctly answered the question on the direction of the energy change. Perhaps more important in revealing how well students integrate concepts, Table 2 presents the percentage of students who correctly answered both questions in a paired set. This is given in the columns labeled X|Y, which signifies that X was correct, given that Y was also correct. The ability to correctly answer each of the paired energy questions requires slightly higher cognitive skills than the "recall" questions (Q1-Q4). The data in Table 2 do not show statistically significant differences between groups, except for Q10.
E
tran=
3An interesting feature of these data is that only about one in three of the GC1 and GC2 students and one in two PHC students can correctly reason that the energy of the substance is increasing (Q5). This occurs despite the fact that the x-axis in the plot (Figure 1) is clearly labeled "Energy Added." Answering this question correctly requires the student to interpret the meaning of the label on the x-axis and relate it to their answer for the change in E. The lack of significant differences in the responses is quite disconcerting given that the more academically advanced PHC students might be expected to perform better than students in the GC1 or GC2 groups.
Table 2. Percentage correct by group: Analysis Questions (Q5-Q10) along with chi-squre p-value
Group Q5 Q6 Q6|Q5 Q7 Q8 Q8|Q7 Q9 Q10 Q10|Q9
GC1 34.7 30.6 25.0 69.4 45.8 44.4 47.2 33.3 23.6
GC2 38.1 33.1 29.3 55.2 34.3 29.8 38.1 22.1 16.0
PHC 51.3 40.8 39.5 53.9 39.5 39.5 40.8 36.8 23.7
p .08 .37 .13 .08 .22 .06 .41 .03 .22
The closeness of the values in columns Q6 and Q6|Q5, as well as in Q7 and Q8|Q7 for all the groups reflects the fact that although a number of students may have serendipitously correctly answered the questions about how E or KE change, students getting the reason correct in most cases got the direction correct. This is less true for the question about the PE, because the correct reason is not as straightforward as that for the E and KE questions. For the reason why PE changes (Q10), answers (a), (c), and (d) should be quickly ruled out as incorrect, however answer (e) might be deemed acceptable by students. The reason is that students often equate "intermolecular forces" with "chemical bonds" (Miller, 2016). It is also been observed that because of their lack of experience with other liquids, students often only think of water when they think of phase transitions (Jasien, 2013). Since the predominant intermolecular force holding water molecules together in the liquid is hydrogen bonding, choosing: "(e) Chemical bonds are being broken." as a reason for the change in PE could make logical sense to students. It may even be the case that some of these students' previous chemistry instructors or their reference material may have used the term "intermolecular bonds" to describe "intermolecular forces" (Purdue, 2016; Wikibooks, 2016; MITOPENCOURSEWARE, 2016). The purpose here is not to debate the correctness of this usage, but to simply point out that this terminology can very well lead to the choice of answer (e) as the reason for the PE change. This may account for the fact that only 3% of GC1 students chose (e) as the reason for the PE increase, while 16% of GC2 and 23% of PHC students did so. The GC1 students all came from the author's section where it was strongly emphasized that "intermolecular forces" are distinct from "chemical bonds". Nevertheless, including the students who would be credited with answering both Q9 and Q10 correctly with either (b) or (e) for the reason, does not lead to significant differences in the groups for Q10|Q9 category.
A range of 54-69% of the students correctly reasoned that KE was constant in the constant T region, with 30-44% giving both the correct change in KE and the reason for it. This may imply that these students made the correct conceptual connection, but could also simply be an artifact of students seeing no change in T and associating it with no energy change. In fact, Table 3 gives some information on students answering incorrectly
that E and PE are constant in the phase change region. In all three groups this is on the order of 50% for E and 20% for PE. Of those answering in this way, anywhere from about one-third to one-half gave the reason as:
There is no change in the temperature of the substance. However, this was less common for the PE than for the total E. For all data analyzed, there were no significant differences among the groups.
Table 3. Percentage by group indicating constant E and PE during the phase change Group E constant NTC|E constant* PE constant NTC|PE constant*
GC1 59.7 55.8 23.6 29.4
GC2 57.5 52.9 23.2 42.9
PHC 47.4 38.9 19.7 33.3
p .24 .42 .80 .69
* Percentage of students in the previous column indicating a reason of "No temperature change" (NTC).
Consistency of Responses
Although the results in Tables 2 and 3 present interesting snapshots of the abilities of students to analyze the energy changes and reasons for them, another interesting result involves the ability of students to make connections between concepts as they synthesize their knowledge of KMT, energy changes, and phase changes. Given in Table 4 is a summary of some student responses to the questions on KMT (Q1) and the KE changes (Q7,Q8) for the liquid-vapor phase transition region of the diagram. The column headings use the notation X|Y as introduced in the previous section. The Q1(a&e) column from Table 1 is reproduced here for ease of comparison. The column labeled Q7|Q1(a&e) indicates a huge falloff in the percentage of students that correctly say that KE depends on T and can then use this idea to conclude that the KE is constant in the phase change region. These decreases amount to 11% (GC1), 30% (GC2), and 34% (PHC). There is a similar huge drop off in students who say that KE depends on T and give a correct reason for Q8 that: "There is no change in the temperature of the substance." This latter comparison is not as clear-cut as the former, since these percentages include students who could given any of the four answers for the change in KE in the phase change region. A more telling statistic is given in the Q8|(Q1a&e&Q7) column. This gives the percentage of students who correctly associated (i) constant KE with constant T from KMT, (ii) constant T from the plot in the phase change region, and (iii) the reason for the constant KE. This amounts to from 23% to 35% of the students. In none of the three cases just discussed, is there a significant difference among the three groups. Needless to say, this is somewhat disappointing, especially for the PHC group which has a significant amount of chemistry (and physics) background.
Table 4. Percentage of correct responses by group for "synthesis" questions
GRP Q1(a&e) Q7|Q1(a&e) Q8|Q1(a&e) Q8|(Q1a&e&Q7) Q8|(Q1a&e&Q7)*
GC1 59.8 48.6 36.1 34.7 58.1
GC2 70.2 39.8 24.9 22.7 32.3
PHC 73.7 39.5 30.3 30.3 41.1
p .15 .40 .19 .11 .01
* Includes only the student subset correctly identifying the relationship of average KE to T.
It could be argued that this is an unfair comparison since it includes all students, independent of whether they stated that the average KE of particles depends on temperature. Given in the last column of Table 4 are the percentages of students making the connections between KMT, the KE change, and the reason for it in the phase change region. Here there is a significant difference between the groups, with the GC1 group now answering the three questions correctly at a rate 17% higher than the PHC students and 26% higher than the GC2 students. However, no significant difference between the GC2 and PHC groups (p' = .35) was seen.
Despite students' conceptions that KE depends on T, many disregarded this knowledge when answering the question related to the "Temperature vs. Energy Added" graph. Two possible reasons for this disconnect are: (1) students were unable to actually process what the graph meant, and/or (2) they were unable to analyze the questions and integrate the ideas needed to make the connection between the questions. This is Bloom's Taxonomy "Analyze," which includes the ability to "draw connections between ideas." Given the relative performance of the groups, it may be hypothesized that the GC1 group's success rate may be more related to the recentness of the material than their ability to analyze the situation more completely.
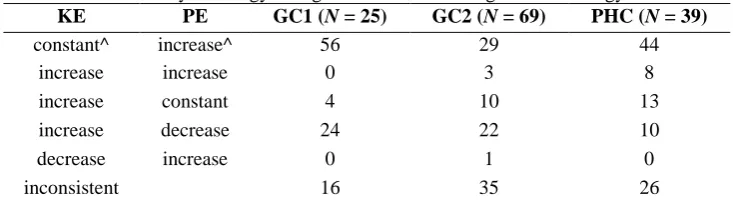
One last measure of students' abilities to integrate knowledge will now be examined. Here, the reason for a particular answer will not be considered; only whether a consistent set of answers is given for the changes in E, KE, and PE. There are a number of possibilities for consistent combinations other than the correct one. For instance a student could answer that the total energy increases and that the KE increases and PE decreases. Although not correct, the answers are consistent, as long as |∆KE| > |∆PE|. The data in Table 5 examines these answers, but only for the subset of students who correctly answered that the energy was increasing in the phase change region. This provides further evidence that students answering these types of multiple-choice questions may not relate their answers from one question to another. This may be the legacy of our students being "raised" on assessments based on multiple-choice questions that examine one concept at a time.
Table 5: Consistency of energy changes for students stating the total energy increases* KE PE GC1 (N = 25) GC2 (N = 69) PHC (N = 39)
constant^ increase^ 56 29 44
increase increase 0 3 8
increase constant 4 10 13
increase decrease 24 22 10
decrease increase 0 1 0
inconsistent 16 35 26
* Percentage of students for the given N. ^ Correct answer.
Implications for Teaching
Although the sample size used in this study is relatively small and the findings may not be generalizable, this work reveals several student misconceptions and inconsistencies in university-level chemistry students. The problem of conceptual inconsistencies is not new, but the current work elucidates some new instances where students fail to integrate related ideas and develop a consistent picture of a concept. A large number of students also appeared to completely neglect a previous response when deciding on the answer to a related question. Some of this may be associated with the way students are tested. Exam questions often focus on simple problems that examine one concept at a time. This may be due to difficulties in creating or grading multiple-concept questions which, more often than not, involve essay-type assessments with a commensurate increase in grading load. On the other hand, some instructors may not ask these concept-integration questions since students may do poorly on them, which can be demoralizing for students. Unfortunately, a Catch-22 situation arises where we don't teach students to integrate concepts since it is difficult to assess them, so students do not learn this skill. The ability to connect ideas is an essential skill and additional emphasis is being placed on this at many levels, particularly in the early years of formal science education (Chiu & Linn, 2011; Davis & Linn, 2000; Linn et al., 2006; Tinker & Pallant, 2008).
Over the years, various pedagogical methods to encourage students to think critically have been developed. Many have shown promise for helping students think critically and integrate concepts, at least in the hands of instructors well-trained and enthusiastic about the specific innovation. One method that aims to help students draw connections is concept mapping (Nakhleh & Saglam, 2005). A complete study investigated the effect of this technique on general chemistry students and concluded that: "When used appropriately, they challenged students to think at a deeper level" (Francisco et al., 2002). Perhaps one reason for the lack of widespread use of
concept mapping is in the phrase: "When used appropriately". This implies that there may be a substantial barrier for instructors and students to efficiently use this technique, although the effort may be worth it.
The problem of helping students make connections and integrate concepts through writing has been addressed via the Science Writing Heuristic (SWH) described by Greenbowe and Hand (2005). This has shown promise in helping students develop connections during experimentation and improve their critical thinking abilities in the lab (Gupta et al. 2014), but also may be part of the solution for teaching critical thinking in the classroom setting as well.
Yuretich (2004) has described how active learning techniques in large lecture classes can be used to teach critical thinking skills. He reported on his efforts to convert multiple-choice questions into a better tool to teach and assess the critical thinking abilities of students in his large oceanography classes for non-science majors. Some of their class activities involve a "think-pair-share" format, as well as multiple-choice questions that lead to students analyzing, synthesizing, and evaluating the topics and thereby use higher-order cognitive skills. This type of repeated questioning has been seen to be particularly effective for students who are "low-skilled comprehenders". Pyburn et al. (2014) compared the use of multiple-choice based activities with "elaborative interrogation" on the development of chemistry skills in general chemistry and concluded that for all levels of chemistry: "… testing can be used to enhance (not just assess) student learning…" (p. 2055). This idea of repeated retrieval of information is consistent with some modern theories of "learning" (Brown et al., 2014).
used by the author in a "flipped" version (Bergman & Sams, 2014) of 1st-semester General Chemistry. The
"think-pair-share" questions that have been developed progress from those requiring lower-order, to those necessitating higher-order cognitive skills. This may account for some of the ability of the GC1 students to outperform the GC2 and PHC students on some questions. However, this is purely speculative and this hypothesis needs to be tested by a future investigation with a control group, since it may turn out that any higher achievement on certain questions may simply be due to the temporal proximity of the course material.
Conclusion
Assessment of students' knowledge of KMT and its relationship to energy changes during phase transitions in a simple heating curve has revealed a number of student misconceptions and inconsistencies. Despite the fact that the "recall" questions posed should have been easily answered by students, there still remain many of them who struggle to demonstrate even the most basic knowledge. More importantly, this study underscored the definite lack of demonstrated skill in integrating multiple concepts. In some cases, students completely disregarded previous answers when answering subsequent questions, resulting in conflicting responses. Overall, the current results provide further evidence of the need for instructors to build critical thinking skills in students. Experienced instructors "know" that students often learn facts in isolation, i.e. Bloom's "Remembering". In these cases, students fail to achieve integration of related ideas, i.e. Bloom's "Applying" and "Analyzing". This situation can leave extensive gaps in a student's knowledge of any topic. It is suggested that although there are definite challenges with doing so, more multi-concept problems should be presented to students early in their university education to encourage the development of their critical thinking skills. There have been a number of demonstrated pedagogical methods for doing this, which should be more commonly utilized. For instance the use of the "think pair-share" format in conjunction with questions that incrementally ramp up the number of concepts needed to answer correctly is one easily implemented method for helping cultivate these skills in students (although there are many others). Having said this, instructors need to be sure to also include these types of questions on graded assessments, otherwise students will not see any value in learning to "Apply" and "Analyze", since their grade will not be affected by not doing so.
Limitations of the Study
The current work represents a snapshot of student understanding of KMT and energy changes for a simple heating curve. Although the data was not collected in direct student interviews, the answer choices were based on the most common responses in essay format and therefore are a fairly accurate reflection of student thinking. Since the reported data was collected from students at a single university, the results may not be transferrable to every university. Furthermore, the General Chemistry curriculum as taught at the university, may not exactly match the topical coverage of all first-year chemistry courses. In addition, due to the diverse student population of the university, the results may not be transferrable to students of more highly selective colleges and universities. However, the correlations elucidated here may very well be transferrable to other public universities with ethnically diverse students. Lastly, the relatively good performance of the GC1 students may be due to the temporal proximity of the tested material or unconscious bias during instruction that might lead to better performance by this group.
Acknowledgements
The author wishes to thank Dr. Michael Schmidt for his critical reading of the manuscript and thoughtful suggestions on the structure of the assessment.
References
Bar, V., & Travis, A.S. (1991). Children's views concerning phase changes. Journal of Research in Science Teaching, 28, 363-382. doi: 10.1002/tea.3660280409
Barke, H-D., Hazari, A., & Yitbarek, S. (2009). Misconceptions in chemistry: Addressing perceptions in chemical education. Berlin, Germany: Springer-Verlag.
Bloom, B.S., Engelhart, M.D., Furst, E.J., Hill, W.H., & Krathwohl, D.R. (1956). Taxonomy of educational objectives: Handbook I, Cognitive domain. New York, NY: McKay.
Bodner, G.M. (1991). I have found you an argument: The conceptual knowledge of beginning graduate students.
Journal of Chemical Education, 68, 385-388. doi: 10.1021/ed068p385.
Brown, P.C., Roedinger, H.L. III, & McDaniel, M.A. (2014). Make it stick: The science of sucessful learning. Cambridge, MA: Belknap Press of Harvard University Press. p. 75f.
Chang, J-Y. (1999). Teachers college students' conceptions about evaporation, condensation, and boiling.
Science Education, 83, 511-526. doi: 10.1002/(SICI)1098-237X(199909)83:5<511::AID-SCE1>3.0.CO;2-E
Chiu, J.L. & Linn, M.C. (2011). Knowledge integration and wise engineering, Journal of Pre-College Enginnering Education Research, 1, 1-14. doi: 10.7771/2157-9288.1026.
Davis, E.A. & Linn, M.C. (2000). Scaffolding students' knowledge integration: Prompts for reflection in KIE.
International Journal of Science Education, 22, 819-837.
Francisco, J.S., Nakhleh, M.B., Nurrenbern, S.C., & Miller, M.L. (2002). Assessing student understanding of general chemistry with concept mapping, Journal of Chemical Education,79, 248-257. doi:
10.1021/ed079p248.
Gillespie, R.J. (1997). The great ideas of chemistry, Journal of Chemical Education, 74, 862-864. doi: 10.1021/ed074p862.
Greenbowe, T.J., & Hand, B. (2005). Introduction to the science writing heuristic. In N.J. Pienta, M.M. Cooper, & T.J. Greenbowe (Eds.), Chemist's guide to effective teaching (pp. 140-154). Upper Saddle River, NJ: Pearson Prentice Hall.
Gupta, T., Burke, K.A., Mehta, A., & Greenbowe, T.J. (2014). Impact of guided-inquiry based instruction with a writing and reflection emphasis on chemistry students' critical thinking abilities. Journal of Chemical Education,92, 32-38. doi: 10.1021/ed500059r.
Hwang, B.T., & Hwang, H.W. (1990). Research report sponsored by the National Science Council, R.O.C., (Grant Number NSC79-01110S003-021-D). Tapei, Taiwan: National Research Council.
Jasien, P.G. (2013). Roles of terminology, experience, and energy concepts in student conceptions of freezing and boiling. Journal of Chemical Education, 90, 1609-1615. doi: 10.1021/ed2007668.
Kind, V. (2004). Beyond appearances: students’ misconceptions about basic chemical ideas. (2nd Ed.).
http://www.rsc.org/learn-chemistry/resource/res00002202/beyond-appearances?cmpid=CMP00007478. Linn, M.C., Lee, H-S., Tinker, R., Husic, F., & Chiu, J.L. (2006). Teaching and assessing knowledge integration
in science. Science, 313, 1049-1050. doi: 10.1126/science.1131408.
Mcmurry, J.E., Fay, R.C., & Fantini, J. (2012). Chemistry (6th ed.). Upper Saddle River, NJ:Pearson Prentice
Hall.
Miller, G. (2016). Ending misconceptions about inter- and intramolecular forces. http://apcentral.collegeboard.com/apc/members/courses/teachers_corner/47526.html
MITOPENCOURSEWARE. (2016). Intermolecular forces. http://ocw.mit.edu/courses/materials-science-and-engineering/3-091sc-introduction-to-
solid-state-chemistry-fall-2010/bonding-and-molecules/12.-intermolecular-forces/.
Mulford, D.R., & Robinson, W.R. (2002). An inventory for alternate conceptions among first-semester general chemistry students. Journal of Chemical Education, 79, 739-744. doi: 10.1021/ed079p739
Nakhleh, M.B. & Saglam, Y. (2005). Using concept maps to figure out what your students are really learning. In N.J. Pienta, M.M. Cooper, & T.J. Greenbowe (Eds.), Chemist's guide to effective teaching. (pp. 129-139). Upper Saddle River, NJ: Pearson Prentice Hall.
Next Generation Science Standards. (2016). http://www.nextgenscience.org/.
Osborne, R.J., & Cosgrove, M.M. (1983). Children's conceptions of the change of state of water. Journal of Research in Science Teaching, 20, 825-838. doi: 10.1002/tea.3660200905.
Purdue University Chemistry Topic Review. (2016).
http://chemed.chem.purdue.edu/genchem/topicreview/bp/intermol/intermol.html
Pyburn, D.T., Pazicni, S., Benassi, V.A., & Tappin, E.M. (2014). The testing effect: An intervention on behalf of low-skilled comprehenders in general chemistry, Journal of Chemical Education, 91, 2045-2057. doi: 10.1021/ed4009045.
Spencer, J.N., Bodner, G.M., & Rickard, L.H. (2006). Chemistry: Structure and dynamics (3rd ed.). Hoboken,
NJ: John Wiley & Sons.
Tinker, R., & Pallant, A. (2008). Understanding heat and temperature: Can atoms help? The Concord Consortium, 12(1). Retrieved from https://concord.org/sites/default/files/newsletters/2008/spring/at-concord-spring-2008.pdf
Wikibooks. (2016). General chemistry / intermolecular bonds. Retrieved September 2016 from https://en.wikibooks.org/wiki/General_Chemistry/Intermolecular_bonds.
Yuretich, R.F. (2004). Encouraging critical thinking: Measuring skills in large introductory classes. Journal of College Science Teaching, 33(3), 40-45.
Zumdahl, S.S., & Zumdahl, S.A. (2014). Chemistry, hybrid edition (9th ed.). Belmont, CA: Brooks Cole.
Author Information
Paul G. JasienDepartment of Chemistry & Biochemistry California State University, San Marcos San Marcos, CA 92096-0001
USA