Open Access
Research article
Mohs math – where the error hides
Jeffrey I Ellis*
1, Tatiana Khrom
1, Anthony Wong
1, Mario O Gentile
2and
Daniel M Siegel
1Address: 1Department of Dermatology, SUNY Downstate Medical Center, Brooklyn, New York, 11203, USA and 2Jxnstudio.com, Philadelphia,
Pennsylvania, USA
Email: Jeffrey I Ellis* - [email protected]; Tatiana Khrom - [email protected]; Anthony Wong - [email protected]; Mario O Gentile - [email protected]; Daniel M Siegel - [email protected]
* Corresponding author
Abstract
Background: Mohs surgical technique allows a full view of surgical margins and has a reported cure rate approaching 100%.
Method: A survey amongst Mohs surgeons was performed to assess operator technique. In addition, an animated clay model was constructed to identify and quantify tissue movement seen during the processing of Mohs surgical specimens.
Results: There is variability in technique used in Mohs surgery in regards to the thickness of layers, and the number of blocks layers are cut into. A mathematical model is described which assesses the clinical impact of this variability.
Conclusion: Our mathematical model identifies key aspects of technique that may contribute to error. To keep the inherent error rate at a minimum, we advocate minimal division and minimal physical thickness of Mohs specimens.
Background
Over the past sixty years, Mohs micrographic surgery has become the standard of care in the management and treat-ment of many skin cancers. Unlike standard vertical sec-tioning, the horizontal sectioning utilized by Mohs technique allows a full view of surgical margins [1] and has a reported cure rate between 88 to 100% [2-7]. Differ-ences in operator technique are already known [8,9], however their impact into the ability to fully view the sur-gical margins have not been defined. This paper is divided into two parts; Part I: A survey of the techniques of prac-ticing Mohs Surgeons. Part II: A mathematical model is described which assesses the clinical impact of technique variability.
Methods
Survey methodsAn e-mail survey was conducted utilizing several derma-tology e-mail lists including RxDERM-L at ucdavis and the Academic Dermatologic Surgeons listserve. 28 Mohs sur-geons responded, and were asked the questions seen in [Table 1].
Mathematical model methods
To best appreciate the following mathematical model, it is crucial for one to be familiar with the processing of tissue in Mohs surgery. For those not involved with Mohs sur-gery on a daily basis, this can be challenging to visualize. As such, a clay animation of ideal Mohs tissue processing Published: 06 December 2006
BMC Dermatology 2006, 6:10 doi:10.1186/1471-5945-6-10
Received: 18 August 2006 Accepted: 06 December 2006
This article is available from: http://www.biomedcentral.com/1471-5945/6/10
© 2006 Ellis et al; licensee BioMed Central Ltd.
is provided to clarify the geometry of expected tissue movement during processing [see Additional file 1].
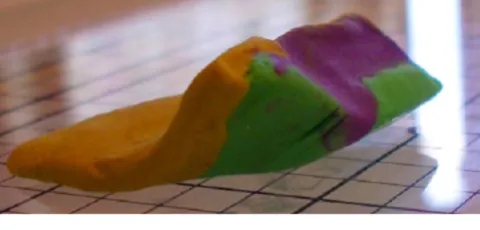
Using this clay model, one can begin to imagine where errors may occur during tissue processing. The first exam-ple of processing error can we call "Edge Lift Roll". An ani-mation of this potential processing error can be seen at [see Additional file 2]. In this case, when the tissue is proc-essed, asymmetrical compression is applied to the tissue (Fig-ure 7). This results in a rolling of the specimen while processing, and may result in one edge lifting from the plane of sectioning (Figure 8, 9). This can potentially result in a false negative, and a future recurrence of tumor. One can also easily imagine that asymetircial compres-sion could also lead to an edge folding into the plane of sectioning thereby causing a false positive.
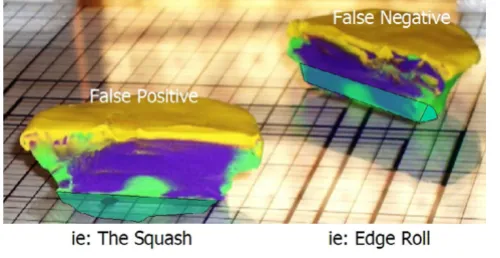
"The Squash" [see Additional file 3] can occur if a block is thick with dermis or fat bellowing from the midsection (Figure 10). If redundancy from the core of the block slides into the plane of sectioning (Figure 11, 12) – one may observe a false positive, resulting in additional and unnecessary layer harvesting.
"Tip Lift" [see Additional file 4] may occur if during the attempt to flatten the outer edge of a block (Figure 13), the inner tip lifts from the plane of sectioning (Figure 14, 15). This may result in a false negative, and potentiates future recurrence.
"Thin Section Collapse" [see Additional file 5] error is based on an exaggerated model where a layer is cut into thin slivers (Figure 16). We mention it here as a subtle var-iation may occur in clinical practice. In this case, when an attempt is made to flatten the epidermis, the tissue col-lapses and rolls to one side (Figure 17, 18). In this exam-ple, the tumor that was reaching the base of the specimen is lifted away from the base and is removed from the plane of sectioning. This can potentially result in either a false positive or a false negative – as a tumor can be lifted away (as demonstrated here), or brought into the plane of sec-tioning.
Results
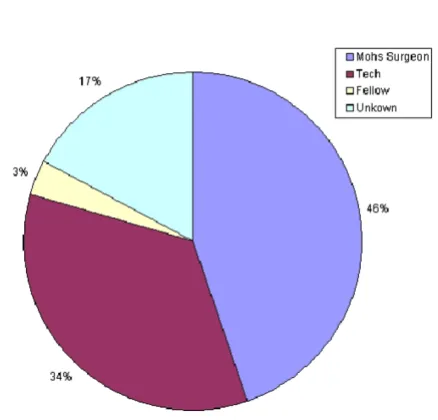
Survey resultsExperience ranged from 2 to 29 years, with a mean of 12 years. 46% of the time, the Mohs Surgeon reported cutting the excised layer into blocks (see Figure 1). As expected, the average number of blocks needed for a given layer increased from 1 or 2 blocks for a 10 mm specimen to 6 blocks for a 40 mm specimen (see Figure 2). However, when evaluating the range of this data, one sees that there is great variability. To make the sizes referred to less abstract, consider (figure 3). Here we see that a dime is about 15 mm, a nickel is 20 mm, half dollar 30 mm, and portrait of George Washington 40 mm. Some surgeons reported processing a dime size layer whole, while others reported cutting it into three blocks. Similarly, some would process George Washington's portrait (40 mm) into 2 blocks – while others would process the same layer into 6 blocks (see figure 4).
Regarding the thickness of Mohs layer's, similar variability was reported. Though the average depth showed progres-sive thickening, as may have been expected (see figure 5), analysis of the range reveals that some surgeons tend take thin layers while others tend to cut to subcutis – regardless of specimen size (see figure 6).
The question remains... does it matter? A mathematical model was created to assess the importance of these Mohs technique variables.
Pie chart: Who is cutting the excised layer into blocks?
Figure 1
Pie chart: Who is cutting the excised layer into blocks? Table 1: Survey Questions
1. How many years have you been performing Mohs Surgery?
2. Who cuts your excised layer into blocks? a. You
b. Fellow c. Tech
3. For specimens ranging from 1–4 cm, on average
Mathematical model results, derivation of a mathematical proof
Careful analysis of tissue movement in "ideal" processing, and the errors that may occur when tissue is processed allows one to derive a mathematical expression. This is a useful exercise because analysis of the expression can allow one to draw conclusions related to the specific aspects of the technique that contribute most to potenti-ating error.
It is clear that for any layer, there is an "ideal area" (Figure 19) that represents the perfect footprint of the tissue, allowing for 100% visualization of the surgical margins. Errors in tissue processing will result in either a loss of ideal area (false negative), or gain in area (false positive). Review of the models above identifies that the loss or gain in processed tissue is related to the area of the sidewalls of the block. (Figure 20) This is a part of the tissue often overlooked – as it has no significance if the tissue is proc-essed correctly. To explain the errors identified here, it is important to precisely calculate the area of these
side-walls. While tissue has dynamic properties categorized as stress relaxation and creep, we have ignored these in this model, as their impact is minimal on the analysis we present.
Step 1: Calculation of ideal area (Figure 19)
Abase = Πr2
Step 2: Calculation of the area of the side wall of one block (Figure 22)
Aside = (d)(r1) + 1/2(d)2
Step 3: Calculation of the total area of the side walls (Fig-ure 21)
Total area of the side walls = (N) × (Aside)
Step 4: A false negative is the ideal area (Abase) minus a
percentage of Aside. And a false positive is the idea area plus a percentage of Aside.
Let k = the percentage roll, falling between 0 and 1.
Substituting what we know, and performing some simple trigonometry, we continue our derivation as shown in [Table 2]
We must solve for r1 (See Figure 22) Note: although r1 and r2 are not collinear, they become collinear when the Mohs tis-sue is processed (see Additional file 1 for review of movement during processing)
r = r1 + r2
r1 = r - r2
Sin (45) = d/r2
r2 = d/Sin (45) = d/0.851
Illustration of the size of US coins
Figure 3
Illustration of the size of US coins.
Bar graph: Average number of blocks for an excised layer
Figure 2
r1 = (r - d/0.851)
Step 5: We can place the expression of error over the ideal area, to create a mathematical formula that predicts error. This formula will produce the value that is equal to the percentage of tissue that is lost from the ideal preparation of a specimen. If we assume only a 5% roll (k = 0.05), we have the following expression (see Figure 23) (Note: for simplicity, let us assume that k is the same on each side)
Alternatively, we could calculate the percentage of the tis-sue that is viewed on a prepared histological preparation of a Mohs slide. The percentage of viewable surface area would be calculated by subtracting the result of Figure 23 from 1, as shown in Figure 33.
The final mathematical expression derived from the proof above can be seen in Figure 25. Of note, N (the number of blocks), and d (depth of layer) are directly related to the degree of processing error anticipated. This final expres-sion is demonstrated with real numbers to illustrate its importance.
To illustrate variability of thickness of specimens, Figures 24, 25, 26, 27 are shown. All of these figures assume a 5% roll (k = 0.05). Several conclusions can be made by look-ing at this series of figures. First, it is clear that the greater the number of blocks (N), the higher the predicted error. Looking across the figures, one sees how anticipated error grows with thicker layers.
A 5% roll is an estimation used, but is not based on any known data. Figures 28, 29, 30, 31 demonstrate changes
Clay model of asymmetrical compression
Figure 7
Clay model of asymmetrical compression.
Bar graph: Average thickness of an excised layer
Figure 5
Bar graph: Average thickness of an excised layer.
Bar graph: Range – Number of blocks for an excised layer
Figure 4
Bar graph: Range – Number of blocks for an excised layer.
Bar graph: Range – Thickness of excised layers
Figure 6
in error that can be anticipated if there is greater than a 5% roll, with Figure 28 illustrating a 5% roll, and Figure 31 a 25% roll.
Figure 32 demonstrates a proposed clinically relevant set of parameters. Illustrated is anticipated error for a 10 mm layer, with a 5% roll during processing. One sees as the thickness increases from 2 to 15 mm, anticipated error grows. It is also apparent that as N grows, so does the anticipated error. Error rates reported in this graph are between 1 and 7%, consistent with reported rates of recur-rence and far below the recurrecur-rence rates seen with stand-ard excision and breadloaf sectioning.
Discussion
Is recurrence of a tumor after Mohs surgery always a result of error? Persistent tumor may be related to "difficulties of anatomic site[10], tumor size and histological
sub-type[11], as well as observer error in histological interpre-tation and potential tumor multifocality[12]" [13]. There are also many processing errors that may occur including inaccurate mapping, tissue staining, and tissue prepara-tion for secprepara-tioning. It is clear that in order to maximize the value of the technique, processing of tissue must be as ideal as possible.
The importance of processing tissue in an 'ideal way' is not a new one. The benefits of processing a layer as one block have been previously described [14]. In addition, several authors have suggested techniques to facilitate obtaining quality and complete horizontal sections [15-17].
It seems prudent to anticipate some questions that this paper may raise, and provide answers at this time. One
Clay model of a thick layer (squash error)
Figure 11
Clay model of a thick layer (squash error).
Clay model of asymmetrical compression
Figure 9
Clay model of asymmetrical compression.
Clay model of asymmetrical compression
Figure 8
Clay model of asymmetrical compression.
Clay model of a thick layer
Figure 10
frequently asked question is "Wouldn't you notice miss-ing tissue (i.e.: edge role)" The answer is simply no. Remember that the clay models show an exaggerated event to help illustrate a potential event. If only 5% of the tissue rolled, this would unlikely be perceivable. Even if it were perceived that this tissue seemed "smaller", it would be easy to disregard this fact as anticipated tissue shrink-age [18].
Another question often asked relates to tissue dyes. In the models presented, the clay was not marked with an orien-tation dye. If the edge lifted, wouldn't the marked edge be lost? The answer is that it depends. As we know, the orien-tation dye we use is far from precise, and often "bleeds" slightly. It is easy to imagine tissue could be removed form the plane of section, while some orientation dye remains. One must remember that the only absolute edge is an epi-dermal edge; it is the non-epithelial edges that are subject to the errors we have demonstrated. As tissue dyes do "bleed", they cannot be considered absolute boundary markers.
Finally, curetting or debulking a tumor may have addi-tional benefit related to processing. Though this is contro-versial amongst Mohs surgeons, removing the bulk of a tumor will serve to significantly decrease the thickness of
Clay model of a tip lift
Figure 15
Clay model of a tip lift.
Clay model of a tip lift
Figure 13
Clay model of a tip lift.
Clay model of a thick layer (squash error)
Figure 12
Clay model of a thick layer (squash error).
Clay model of a tip lift
Figure 14
a Mohs layer. In doing so, it may serve to decrease the like-lihood of the processing errors described here.
The model presented in this paper could be adapted to any layer of Mohs surgery, with or without debulking. The conclusions will always be the same. A variety of process-ing errors can be significantly reduced by takprocess-ing thin lay-ers, and processing tissue in the least number of blocks possible.
Conclusion
As previously described, variability exists in the technique of Mohs Surgery. This paper represents the first known
attempt to quantitate in a mathematical way the conse-quence of some components of this variation. Evidence is provided which suggests that minimizing the number of blocks an excised layer is cut into when processing, and minimizing the thickness or depth of an excised layer can dramatically improve the cure rate of Mohs Surgery.
Mathematical proof, demonstrating ideal area
Figure 19
Mathematical proof, demonstrating ideal area.
Clay model of an exaggerated thin section
Figure 17
Clay model of an exaggerated thin section.
Clay model of an exaggerated thin section
Figure 16
Clay model of an exaggerated thin section.
Clay model of an exaggerated thin section
Figure 18
Table 2: Mathematical proof
False (-) Ideal False (+)
Abase - k(Aside)(N) Abase Abase + k(Aside)(N) Πr2 - k(A
side)(N) Πr2 Πr2 + k(Aside)(N)
Πr2 - k((d)(r
1) + 1/2(d)2)(N) Πr2 Πr2 + k((d)(r1) + 1/2(d)2)(N)
Πr2 - k((d)((r - d/0.851)) + 1/2(d)2)(N) Πr2 Πr2 + k((d)((r - d/0.851)) + 1/2(d)2)(N)
Mathematical proof, false positive and false negative
Figure 20
Mathematical proof, false positive and false negative.
Mathematical proof, area of the side walls
Figure 21
Mathematical proof, area of the side walls.
Mathematical proof, area of the side walls
Figure 22
Mathematical proof, area of the side walls.
Mathematical proof, mathematical formula of predicted error
Figure 23
Mathematical proof, mathematical formula of predicted error.
Predicted error for a 2 mm thick layer with 5% roll
Figure 24
Predicted error for a 10 mm diameter layer, with a 10% roll
Figure 29
Predicted error for a 10 mm diameter layer, with a 10% roll.
Predicted error for a 15 mm thick layer with 5% roll
Figure 27
Predicted error for a 15 mm thick layer with 5% roll.
Predicted error for a 5 mm thick layer with 5% roll
Figure 25
Predicted error for a 5 mm thick layer with 5% roll.
Predicted error for a 10 mm thick layer with 5% roll
Figure 26
Predicted error for a 10 mm thick layer with 5% roll.
Predicted error for a 10 mm diameter layer, with 5% roll
Figure 28
Predicted error for a 10 mm diameter layer, with 5% roll.
Predicted error for a 10 mm diameter layer, with a 15% roll
Figure 30
Abbreviations
Aside = Area Side
r = r1 + r2 = radius of Abase
r1 = length of base
r2 = length of side wall
N = Number of blocks
d = depth (thickness)
Competing interests
The author(s) declare that they have no competing inter-ests.
Authors' contributions
DMS conceived of the study, and participated in its design and coordination. JIE, TK, AW and DMS designed the mathematical proof. JIE created the clay animations, and statistical analysis. MOG helped in the modeling and ani-mations. All authors read and approved the final manu-script.
Additional material
References
1. Cottel WI, Bailin PL, Albom MJ, Bernstein G, Braun M 3rd, Hanke CW, Sutnick TB, Swanson NA: Essentials of Mohs micrographic surgery. J Dermatol Surg Oncol 1988, 14:11-3.
2. Leibovitch I, Huilgol SC, Selva D, Richards S, Paver R: Basal cell car-cinoma treated with Mohs surgery in Australia I. Experience over 10 years. J Am Acad Dermatol 2005, 53:445-51.
Additional File 1
Optimal tissue processing. Power point animation of optimal tissue processing
Click here for file
[http://www.biomedcentral.com/content/supplementary/1471-5945-6-10-S1.ppt]
Additional File 2
Edge lift error. Power point animation of an edge lift error Click here for file
[http://www.biomedcentral.com/content/supplementary/1471-5945-6-10-S2.ppt]
Additional File 3
Squash error. Power point animation of a thick layer squash error Click here for file
[http://www.biomedcentral.com/content/supplementary/1471-5945-6-10-S3.ppt]
Additional File 4
Tip lift error. Power point animation of a tip lift error Click here for file
[http://www.biomedcentral.com/content/supplementary/1471-5945-6-10-S4.ppt]
Additional File 5
Thin section collapse error. Power point animation of a thin section col-lapse error
Click here for file
[http://www.biomedcentral.com/content/supplementary/1471-5945-6-10-S5.ppt]
Predicted error for a 10 mm diameter layer, with a 5% roll
Figure 32
Predicted error for a 10 mm diameter layer, with a 5% roll.
Predicted error for a 10 mm diameter layer, with a 25% roll
Figure 31
Predicted error for a 10 mm diameter layer, with a 25% roll.
Mathematical formula of predicted viewable margin
Figure 33
Publish with BioMed Central and every scientist can read your work free of charge "BioMed Central will be the most significant development for disseminating the results of biomedical researc h in our lifetime."
Sir Paul Nurse, Cancer Research UK
Your research papers will be:
available free of charge to the entire biomedical community
peer reviewed and published immediately upon acceptance
cited in PubMed and archived on PubMed Central
yours — you keep the copyright
Submit your manuscript here: BioMedcentral 3. Leibovitch I, Huilgol SC, Selva D, Richards S, Paver R: Basal cell
car-cinoma treated with Mohs surgery in Australia II. Outcome at 5-year follow-up. J Am Acad Dermatol 2005, 53:452-7. 4. Malhotra R, Huilgol SC, Huynh NT, Selva D: The Australian Mohs
database: periocular squamous cell carcinoma. Ophthalmology
2004, 111:617-23.
5. Malhotra R, James CL, Selva D, Huynh N, Huilgol SC: The Austral-ian Mohs database: periocular squamous intraepidermal car-cinoma. Ophthalmology 2004, 111:1925-9.
6. Malhotra R, James CL, Selva D, Huynh N, Huilgol SC: The Austral-ian Mohs database, part II: periocular basal cell carcinoma outcome at 5-year follow-up. Ophthalmology 2004, 111:631-6. 7. Malhotra R, Huilgol SC, Huynh NT, Selva D: The Australian Mohs
database, part I: periocular basal cell carcinoma experience over 7 years. Ophthalmology 2004, 111:624-30.
8. Silapunt S, Peterson SR, Alcalay J, Goldberg LH: Mohs tissue map-ping and processing: a survey study. Dermatol Surg 2003,
29:1109-12.
9. Hanke CW, Lee MW: Cryostat use and tissue processing in Mohs micrographic surgery. J Dermatol Surg Oncol 1989,
15:29-32.
10. Panje WR, Ceilley RI: The influence of embryology of the mid-face on the spread of epithelial malignancies. Laryngoscope
1979, 89:1914-20.
11. Robins P: Chemosurgery: my 15 years of experience. J Derma-tol Surg Oncol 1981, 7:779-89.
12. Dzubow LM: Chemosurgical report: recurrence (persistence) of tumor following excision by Mohs surgery. J Dermatol Surg Oncol 1987, 13:27-30.
13. Dzubow LM: False-negative tumor-free margins following Mohs surgery. J Dermatol Surg Oncol 1988, 14:600-2.
14. Randle HW, Zitelli J, Brodland DG, Roenigk RK: Histologic prepa-ration for Mohs micrographic surgery. J Dermatol Surg Oncol
1993, 19:522-4.
15. Dogan MM, Snow SN, Lo J: Rapid skin edge elevation using the OCT compound droplet technique to obtain horizontal microsections in Mohs micrographic surgery. J Dermatol Surg Oncol 1991, 17:857-60.
16. Franks JW: A precision machine for mounting tissue for Mohs micrographic surgery. Dermatol Surg 1998, 24:989-93.
17. Nouri K, O'Connell C, Alonso J, Rivas MP, Alonso Y: The Miami Special: a simple tool for quality section mounting in Mohs surgery. J Drugs Dermatol 2004, 3:175-7.
18. Gardner ES, Sumner WT, Cook JL: Predictable tissue shrinkage during frozen section histopathologic processing for Mohs micrographic surgery. Dermatol Surg 2001, 27:813-8.
Pre-publication history
The pre-publication history for this paper can be accessed here: