Back calculation Anti Windup PID controller on Several
Well-Known Tuning Method for Glycerin Bleaching Process
Temperature Regulation
Mohd Hafiz A. Jalil
1, Mohd Nasir Taib
1, M. H. Fazalul Rahiman
1, Rohaiza
Hamdan
1,*1Faculty of Electrical Engineering
University Teknologi Mara, Shah Alam, Malaysia.
1.
Introduction
Bleaching process is a decisive process in glycerin purification which aim to remove pigment colour and any impurities such as mineral salt substance for colour removal and increase the purity of glycerin [1]. In this process, the pigment colour and the impurities are adsorb by an adsorbent or bleaching agent such as activated carbon to remove any unwanted substances of glycerin. Basically, the process begins by mixing the crude glycerin with adsorbent material followed by heating process where the temperature is regulated and maintained at specific desired temperature for a certain time that last around 15 to 120 minutes depending on the source of crude glycerin, the type and the dosage of adsorbent before its goes to the next processes which is filtering process for obtaining bleached glycerin. Amongst the processes, heating process plays major role in determining the successful of bleaching process since optimum temperature regulation could increase the efficiency of absorption process [2]. However, unlimited temperature rise that is beyond desired temperature and excessive prolonged heating process will cause undesirable side reaction such as darkening process instead of discoloration [3]. Since the heating process is
conducted in batch, the temperature regulation
improvement during bleaching process will consequently lead to faster settling time and cause the process to finish quicker. Also, this action will indirectly reduce the batch cycle time. It can be emphasized that; proper temperature regulation is necessary for maintaining and increasing the effectiveness of bleaching process.
In process control engineering, even though there are vast developments of advanced methodologies of controller design during recent years, proportional-integral and derivative (PID) controller is still the most frequently adopted controllers in industrial operations [4]. The survey that includes more than 11000 controller in industries, indicated that over 97% of them utilize PID controller feedback algorithm [5]. The popularity of PID controller among industry sector is due to its simplicity [6, 7] and capability to provide satisfactory performance in wide range practical situations [8]. Unfortunately, in order to provide robust controller performance in regulating temperature of glycerin bleaching process using standalone PID controller is not an easy task. The analysis towards implementation of PID controller using several well-known PID controller tuning [9] and different PID controller structure [10] indicated that the PID controller provide high overshoot and/or large settling time. One of unfavorable features that adversely affect the closed loop performance of PID controller is the existence of actuator constraint that lead the PID controller to suffer integral windup phenomenon. The typical way to prevent PID controller from windup phenomenon is by adding anti windup scheme on the controller. Back calculation anti windup scheme is one of the famous PID controllers anti windup scheme that reset the integral gain dynamically based on tracking time constant, Ta instead of resetting the integral gain
instantaneously. Initial study that emphasis on the effectiveness of back calculation anti windup scheme to prevent PID controller from windup phenomenon during temperature regulation of glycerin bleaching process has
Abstract: The aim of this paper is to comprehend the performance of back calculation anti windup scheme with difference tracking time constant, Ta on Proportional – Integral - Derivative (PID) controller for improving
temperature regulation of glycerin bleaching process. Several available well tuning methods including Ziegler Nichols (ZN), Internal Model Control (IMC) and Integral Square Error (ISE)-Load are used and analyzed. The performance of the controller tuning methods are compared based on percentage of overshoot, settling time, rise time and time to recovery on the presence of disturbance. From the results, the best performance of temperature regulation for glycerin bleaching process can be reached by using ISE-Load tuning with tracking time constant, Ta
equal to derivative time constant, Td.
Bleached glycerin
Temperature controller NaOH
Diluted carbon
Mixed raw material
Dosage pump
pH controller
Heater RTD pH sensor Level
sensor AG1
Manual valve Pump
3
AC power controller been conducted and the results are as presented in [11].
However, it only focuses on ZN tuning method with Ta
equal to TiTd . In this study, as an advancement to the previous outcome, the performance evaluation of the back calculation anti windup on PID controller using several available well known tuning method includes ZN tuning, ISE-Load tuning and IMC tuning with difference selection Ta value are executed. The comparative studies
are carried out with an objective to determine the finest tuning of PID controller with back calculation anti windup scheme for temperature regulation of glycerin bleaching process.
The remaining parts of this paper are organized as follow. Section 2 describes the reactor tank of glycerin bleaching process pilot plant and its interfacing. The following section, Section 3, represents the modeling of heating process for glycerin bleaching process using ARX model. Section 4 depicts on the PID controller design which include the description of the PID tuning method and the explanations on the concept of back calculation method. Section 5 describes the simulation and real-time experimental results and discussion, while section 6 provides summary of the article.
2.
System Description
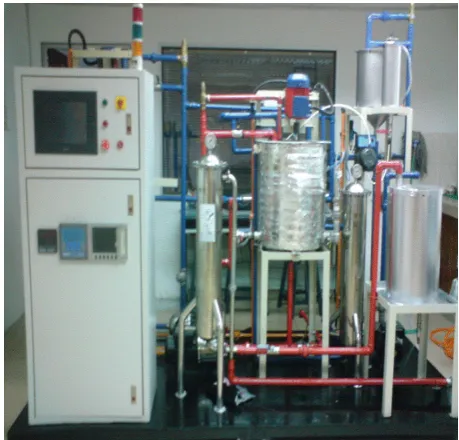
The experimental works of this study are carried out using laboratory scale of glycerine purification pilot plant that is located in Distributed Control System Laboratory of Electrical Engineering in UiTM, Shah Alam. Fig. 1 shows the pilot plant while Fig. 2 shows the P&ID for the reactor tank in which the process variable (temperature) are measured and controlled. The reactor tank has a maximum volume of 38 litres with 24 inches height and 12 inches diameter. The reactor tank is equipped with dual band single phase heaters of 8 inches width and circulated around the reactor. Each of the heaters has power rating of 1.5kW and driven by 25 AC power controllers, while for measuring temperature, RTD Pt 100 3-wires is used. During heating process, the reactor is insulated with fibre and aluminium foil in order to increase the effectiveness of heating process and to reduce the heat losses to surrounding. Agitator (AG 1) that assembled with the tank ensures the compounds are mixed homogenously and also provides uniform spread of heat released inside the reactor. During the bleaching process, the plant is operated at 85oC to give adequate
heat for optimum adsorption process.
The Labview software is used as control platform for monitoring and controlling the temperature inside the reactor tank. For this purpose, the reactor plant has been interface with the computer via NI DAQ card. Fig. 3 shows the configuration of the system interfacing. The temperature of the reactor is controlled by controlling the control signal ranging from 0V to 5V and converted directly to control signal ranging from 4mA to 20mA using signal converters designed in Labview software so that the control input are compatible with system input. Then the control signals (4mA to 20mA) are fed to ac power controller to drive the heater via NI9265 data
acquisition card. The RTD Pt 100 3-wires will measure the temperature inside the tank in the form of ohmic resistance. Then it will be fed into NI8756 for converting the ohmic resistance to degree Celsius. Throughout the process, the data gathered are monitored and stored in computer via Labview software.
Fig. 1 Glycerin Bleaching process pilot plant
Fig. 3 Configuration of system interfacing
3.
Modeling
Due to lack information of the process such as coefficient rate of heat transfer and liquid density, the system identification approach based on Linear Auto-Regressive with Exogenous Input (ARX) model is used in developing the model of heating process of glycerin bleaching process. General form of an ARX model is given by the following equation;
(1)
where u(t) and y(t) is the input output of the system while e(t) is the white noise. The A(q) and B(q) are the polynomial equation that denote for the denominator and numerator of the system and can be expressed as below;
(2)
(3)
where q-1 is a backward shift operator . The a 1….ana
and b1….bnb is the input output parameter which had to be
estimated. In this case, the na and nb are set to 1 for assign
the model to be first order model whereas the value of a1
and b1, are estimated using linear regression approach.
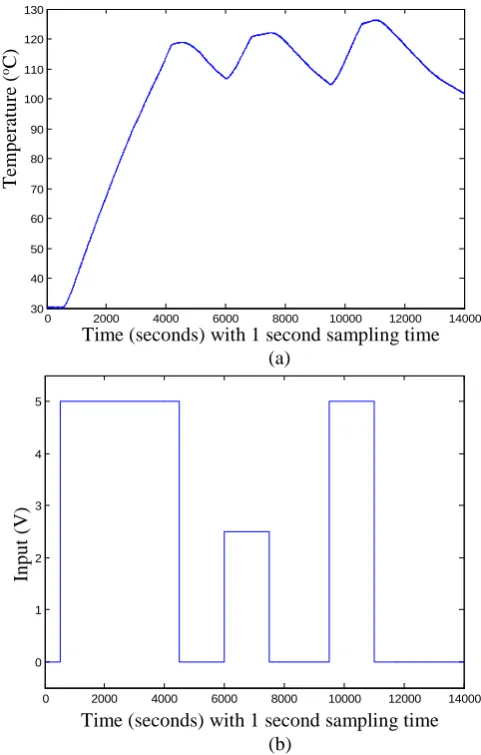
The input output experimental data for estimating the model are obtained by performing open loop experiment. In order to ensure that the input fluctuated enough to excite the whole interest dynamic region and to cover the whole region of operation, the single variables step test with series of step change was injected to the plant. The input output data of the experiment are as shown in Fig. 4. This experiment was executed for 14000 seconds and all the data are monitored and captured with 1 second sampling time.
Prior to modeling, the experimental data was separated into two set of data using interlacing technique where the odd data is used for estimating model parameter while even data is used for validation purpose. This experimental data organization will increase sampling time from 1 second to 2 seconds[12]. For model validation, R2 or also known as best fits is used
where the selection of model is depending on the
percentages value of model fits. Higher best fit percentages indicate more precise approximate model as compared with the true process [12, 13].
Fig. 4 Open loop experiment data: (a) Output, and (b) Input
4.
PID Controller
Proportional Integral derivative (PID) controller is a feedback controller that combined all three controller action which is proportional action, P (present element), integral action, I (past element) and derivative action, D (future element). These combination caused PID controller to possess the capability of dealing with both transient and steady state response improvement [14, 15] and become dominant controller in solving problem within process control industry[16] . The formulae for the parallel form of PID controller are as shown in equation (4).
(4)
where Kp is referred as proportional gain, Ti is referred as
integral time constant, and Td is referred as derivative
time constant. Computer
(Labview)
NI9217 PT100
Driver Heater
NI9265
Reactor tank (Heating Process)
NI DAQ Plant
e(t) A(q)
1 u(t) A(q) B(q) y(t)= +
a n a n 1
1q ... a q
a 1
A(q)= + − + + −
b n b n 1
1q ... b q
b
B(q)= − + + −
+ + =
= T s
s T
1 1 K E(s) U(s) (s)
G d
i p pid
T
em
p
er
at
u
re
(
oC)
0 2000 4000 6000 8000 10000 12000 14000 30
40 50 60 70 80 90 100 110 120 130
Time (seconds) with 1 second sampling time (a)
0 2000 4000 6000 8000 10000 12000 14000 0
1 2 3 4 5
In
p
u
t (V
)
Those parameters are known as the tuning parameter of PID controller and it is important to determine appropriate PID tuning parameter since each parameter affects the error generated which reflects on system performance and stability of the controlled process.
4.1
PID Tuning
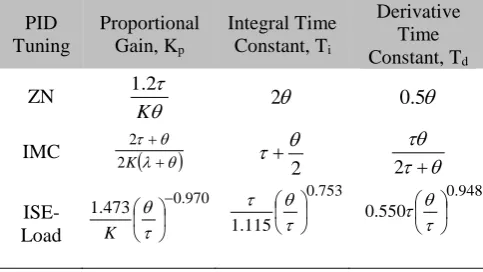
A vital part in designing stable PID controller is to tune its parameters. It was claimed that, there are 691 PID tuning formula that has been identified over the years to tune parameter of the PID controllers [17]. To find optimal tuning of PID that will results satisfactory controller performance is an issue in designing PID since there is no general conclusion that indicates which method is the best, in fact there is no best at all [18, 19]. Furthermore specific method of PID tuning might be effective for specific process [18]. To test all of the available PID tuning merely to find the best tuning for a single application is not an effective attempt and required tremendous work. Therefore, this study only focus on several well-known tuning methods which are ZN, IMC, and ISE-load [18, 20]. These tuning methods were chosen based on the fact that these tuning cover both of set point tuning (IMC) and load tuning (ZN and ISE-Load). Moreover, these tuning also cover the high integral gain tuning (ISE-Load), medium integral gain tuning (ZN) and low integral gain tuning (IMC) as discussed in [18]. The formulae of those tuning method used in this study are as shown in Table 1. For IMC tuning the value of λis chosen to be equal with 0.25τ as applied in [18].
Table 1. ZN, IMC, and ISE-load formulae for PID controller tuning.
PID Tuning
Proportional Gain, Kp
Integral Time Constant, Ti
Derivative Time Constant, Td
ZN
θ τ
K
2 . 1
θ
2 0.5
θ
IMC τ
(
λ++θθ)
K
2 2
2
θ τ +
θ τ
τθ + 2
ISE- Load
753 . 0
115 .
1
τ θ
τ 0.948
550 .
0
τ θ τ
The process gain, K, time constant, τ, and time delay, ϴ that used for calculating the tuning parameters of PID are obtained from the open loop process step response and the parameters are estimated using tangent and point method are as illustrated on Fig. 5. Details description of this technique is explained in [21].
Fig 5 Tangent and point method in determination process parameter
4.2
PID Back Calculation Anti windup
Scheme
Every actuators device in control system are subjected to a constraint on the magnitude of the control input [22]. It has been recognized that, the input constraint is the common nonlinearities that will caused undesirable effect in closed loop response such as excessive overshoot and instability [23, 24]. The problem arises when the actuator is pushed into saturated region by large amplitude of disturbances and triggers a mismatch between the controller outputs and the system input: changes in the controller output beyond the linear range of the actuator. This situation can be referred as windup phenomenon [23].
For PID controller, the windup phenomenon can be prevented by integrate anti windup scheme on PID controller [23, 25]. The back calculation is one of the familiar anti windup scheme for PID controller. The advantages of this scheme is the correction of integral gain is executed slowly and dynamically based on Ta
value rather than reset the integral gain instantaneously [26, 27].
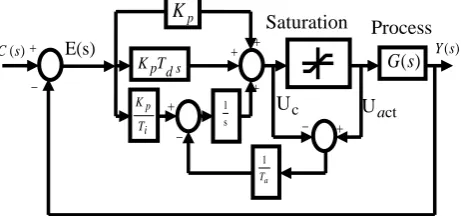
The basic concept operations of back calculation method in preventing windup phenomenon can be expressed based on the additional feedback attached on PID structure as illustrated in Fig. 6. When the controller output goes beyond the saturated value of the system, the additional feedback will measure the difference between saturate control signals, Uact and unsaturated control
signal, Uc. Then, the difference will being feedback to the
integrator via 1/Ta gain to reset the integral term. This
recalculation process is occurs continuously until the value of integral term gives a controller signal at the saturation limits.
The performance of back calculation scheme in preventing PID controller from windup phenomenon is depending on the selection of Ta value. Basically, the
choice of Ta value will specify on how fast the integral
term is being reset and this indirectly effect on overall controller performance [25, 28]. Generally, the Ta value
θ
τ
6
3
%
L
970 . 0 473 .
1 −
must be bigger from Td and must be lower than Ti [29].
However an empirical study suggested to choose Ta
= TiTd [27]. For this study, three value of Ta is
considered which are Ta equal to Ti, TiTd , and Td.
Fig. 6 PID controller with back calculation anti windup block diagram.
5.
Results and Discussion
This section is divided into three sub-sections. The first subsection will describes about modeling results while the second subsection denote the results on determination of PID controller parameter and Ta
parameter. The simulation results and real time of controller performance will be presented in the third subsection. In this study, the performance of the controller are analyzed based on rise time, settling time, percentages of overshoot and time to recovery disturbances. For disturbance test, -15oC step input that
act as disturbances was injected to the plant during steady state condition (constantly at 8000 second) and the test only executed on PID controller with antiwindup. The controller has been designed with sampling times 2 seconds similar with sampling time for modeling.
5.1
Modeling
The result of dynamical model based on ARX model for the heating process in the form of s-domain is as presented by the equation (5). The validation test shows that the approximated model having 99.67% best fit. Based on this validation results it was shown that the approximate model is good enough in representing the dynamic of the process due to high percentages of model fit as stated in [12, 13].
(5)
5.2
PID controller Parameter and tracking
Time Constant, Ta Parameter
Table 2 shows the estimated parameter of process gain, time delay and time constant of the process obtained based on methodology explained in section 3. Then, based on the obtained parameter, the PID parameter and tracking time constant are calculated based on formulae
shown in Table 1 and written in section 4.2 and the calculated parameter are as shown in Table 3 and Table 4 respectively.
Table 2. Process parameter using point and tangent method.
Process Gain Time Delay in
second(s)
Time constant in second(s)
17.8 90 1032
Table 3. PID controller parameter.
PID Tuning
Proportional Gain, Kp
Integral Gain, Ki
Derivative Gain, Kd
ZN 0.773 4.3x 10⁻³ 34.8
IMC 0.538 5.0x10⁻⁴ 23.2
ISE-
Load 0.882 5.9x10
-3 49.6
Table 4. Tracking time constant parameter.
PID Tuning
Tracking Time Constant, Ta
Ti TiTd Td
ZN 180 90 45
IMC 1077 215 43
ISE-
Load 147.4 90.8 56
5.3
Simulation and Real-Time Experimental
Results
The simulation results of the performance of PID controller based on the ISE –load, ZN, and IMC tuning formula with different Ta value in regulating the
temperature of glycerin bleaching process are as presented in Fig. 7 while the PID control signal is shown in Fig. 8. The integral term behaviors of the PID controller with different Ta value are as shown in Fig. 9
and the performance in recovery disturbances are as shown in Fig. 10. The analyses of the simulation results are as tabulated in Table 5. From the results, it is observed that, the PID controllers without anti windup either using load tuning (ISE-Load and ZN) or set point tuning (IMC) are suffered on windup phenomenon and gives poor closed loop transient performance. This circumstance can be expressed by observing the behavior of controller output and integral gain of PID without anti windup. In this case, it also notice that the PID controller with ISE-Load and ZN tuning are more susceptible to the windup problem and the effect of windup are more worse because both of tuning have high integral gain as compared with IMC tuning that have low integral gain.
0001411 .
0 01078 . 0 ) (
) ( ) (
+ = =
s s A
s B s
Gp
i p
T K
p
K
s 1
) (s G )
(s
C Y(s)
+
_
+
+ + +
+
_ _
a
T
1
s d pT
K
Saturation Process
E(s)
c
0 1000 2000 3000 4000 5000 6000 7000 8000 30 40 50 60 70 80 90 100 110 120 130
1500 2000 2500 82
84 86 88 90
Fig. 7 Performance response of PID controller with and without antiwindup with different tracking time constant;
(a) ISE-Load, (b) ZN, (c) IMC.
Fig. 8 Control Signal of PID controller with and without antiwindup with different tracking time constant; (a)
ISE-Load, (b) ZN, (c) IMC. 0 1000 2000 3000 4000 5000 6000 7000 8000
30 40 50 60 70 80 90 100 110 120 130
1500 2000 2500 82
84 86 88
90 1 Set-Point
2 ZN without antiwindup 3 ZN, 4 ZN, 5 ZN, d i
a TT
T = i a T T = d a T T =
Time (seconds) with 2 second sampling time (b) T em p er at u re ( o C) 1 2 4 3 5
0 1000 2000 3000 4000 5000 6000 7000 8000 -500 -400 -300 -200 -100 0 100 200
0 500 1000 1500 2000 -20
0 20 40 60
Time (seconds) with 2 second sampling time (a) 1 2 3 4 C ont rol le r O ut put ( V )
1.ISE-Load without antiwindup 2.ISE-Load, 3.ISE-Load, 4.ISE-Load, d i
a TT
T = i a T T = d a T T =
0 1000 2000 3000 4000 5000 6000 7000 8000 -500 -400 -300 -200 -100 0 100 200
0 500 1000 1500 2000 2500 -20
0 20 40 60
Time (seconds) with 2 second sampling time (b) C ont rol le r O ut put ( V ) 1
1.ZN without antiwindup 2.ZN, 3.ZN, 4.ZN, d i
a TT
T = i a T T = d a T T = 2 3 4
0 1000 2000 3000 4000 5000 6000 7000 8000 -500 -400 -300 -200 -100 0 100 200 C ont rol le r O ut put ( V )
1.IMC without antiwindup 2.IMC, 3.IMC, 4.IMC, d i
a TT
T = i a T T = d a T T =
0 500 1000 1500 2000 -20 0 20 40 60 2 3 4 1
Time (seconds) with 2 second sampling time (c)
Time (seconds) with 2 second sampling time (a) T em p er at u re (
o C) 1
2
3 4
5
1 Set-Point 2 ISE-Load without
antiwindup 3 ISE-Load, 4 ISE-Load, 5 ISE-Load, d i
a TT
T = i a T T = d a T T =
0 1000 2000 3000 4000 5000 6000 7000 8000 30 40 50 60 70 80 90 100 110 120 130 1.Set-Point
2.Without antiwindup 3.IMC, 4.IMC, 5.IMC, d i
a TT
T = i a T T = d a T T =
Time (seconds) with 2 second sampling time (c)
1 2
0 1000 2000 3000 4000 5000 6000 7000 8000 -500 -400 -300 -200 -100 0 100 200
0 500 1000 1500 2000 -30 -20 -10 0 10 20
0 1000 2000 3000 4000 5000 6000 7000 8000 -500 -400 -300 -200 -100 0 100 200
0 500 1000 1500 2000 -30 -20 -10 0 10 20
Fig. 9 Behavior of Integral term of PID controller with and without antiwindup with different tracking time
constant; (a) ISE-Load, (b) ZN, (c) IMC.
Fig. 10 Performance of PID controller with and without antiwindup with different tracking time constant in disturbances recovery; (a) ISE-Load, (b) ZN, (c) IMC. 0 1000 2000 3000 4000 5000 6000 7000 8000
-500 -400 -300 -200 -100 0 100 200
0 500 1000 1500 2000 -30 -20 -10 0 10 20
Time (seconds) with 2 second sampling time (b) 2 3 4 1 In teg ral g ai n
1.ZN without antiwindup 2.ZN, 3.ZN, 4.ZN, d i
a TT
T = i a T T = d a T T =
3800 4000 4200 4400 4600 4800 5000 5200 5400 5600 5800 65 70 75 80 85 90 T em p er at u re ( o C)
Time (seconds) with 2 second sampling time (b) 1.Set-Point 2.ZN, 3.ZN, 4.ZN, d i
a TT
T = i a T T = d a T T = 1 2 3 4
3800 4000 4200 4400 4600 4800 5000 5200 5400 5600 5800 65 70 75 80 85 90
Time (seconds) with 2 second sampling time (a) T em p er at u re ( oC) 1.Set-Point 2.ISE-Load, 3.ISE-Load, 4.ISE-Load, d i
a TT
T = i a T T = d a T T = 1 2 3 4 In teg ral g ai n 1
Time (seconds) with 2 second sampling time (a)
2
3 4
1.ISE-Load without antiwindup 2.ISE-Load, 3.ISE-Load, 4.ISE-Load, d i
a TT
T = i a T T = d a T T =
1.IMC without antiwindup 2.IMC, 3.IMC, 4.IMC, d i
a TT
T = i a T T = d a T T = In teg ral g ai n
Time (seconds) with 2 second sampling time (c)
1 2 3 4
Time (seconds) with 2 second sampling time (c)
3800 4000 4200 4400 4600 4800 5000 5200 5400 5600 5800 65 70 75 80 85 90 T em p er at u re ( oC) 1.Set-Point 2.IMC, 3.IMC, 4.IMC, d i
a TT
T = i a T T = d a T T =
1 2
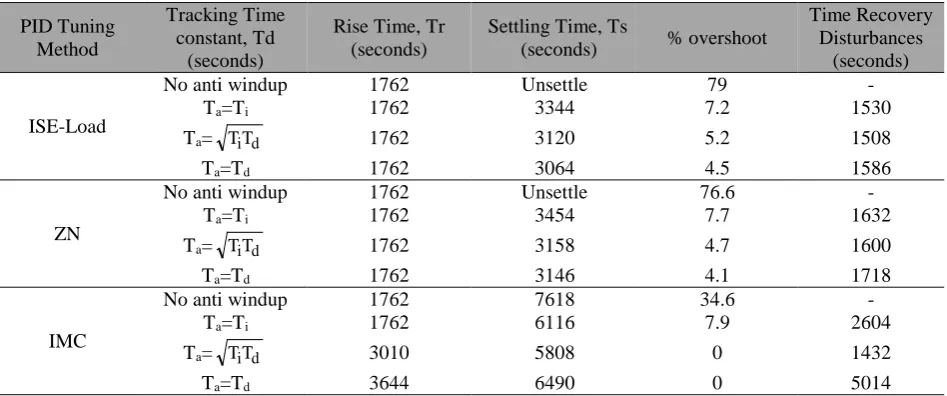
Table 5. Analysis of simulation results.
PID Tuning Method
Tracking Time constant, Td
(seconds)
Rise Time, Tr (seconds)
Settling Time, Ts
(seconds) % overshoot
Time Recovery Disturbances
(seconds)
ISE-Load
No anti windup 1762 Unsettle 79 -
Ta=Ti 1762 3344 7.2 1530
Ta= TiTd 1762 3120 5.2 1508
Ta=Td 1762 3064 4.5 1586
ZN
No anti windup 1762 Unsettle 76.6 -
Ta=Ti 1762 3454 7.7 1632
Ta= TiTd 1762 3158 4.7 1600
Ta=Td 1762 3146 4.1 1718
IMC
No anti windup 1762 7618 34.6 -
Ta=Ti 1762 6116 7.9 2604
Ta= TiTd 3010 5808 0 1432
Ta=Td 3644 6490 0 5014
The results also clearly show that, the
implementation of back calculation anti windup on PID controller gives significant impact in preventing the windup phenomenon on PID controller and indirectly improved the closed loop performance of PID controller either using load tuning or set-point tuning in regulating temperature of glycerin beaching process especially for reducing the overshoot and providing faster settling time.
Further observation on the results denote that, the selection of Ta gives impact towards how fast the integral
term will reset and steer the control signal back to the operational range of the actuator and this indirectly impact on response behavior. The results revealed that, the rate of resetting the integral term are more aggressive when Ta equal to Td are chosen as setting combination
when compared to Ta equal to Ti pair. Based on the
analyses of the simulation results shown in Table 1, for ISE-Load tuning, the fastest settling time and minimum overshoot of response are obtained by selecting Ta equal
to Td. This setting provides response that achieves settling
time 56 seconds faster as compared to response resulting
from selecting Ta equal to TiTd and also; it is 280
seconds faster compared to system with Ta equal to Ti.
Furthermore, ISE-Load with Ta equal to Td possess
percentages overshoot that is 0.7% lower than system
with Ta equal TiTd and 2.7% lower than tuning
selection that set Ta equal to Ti. However, in disturbance
recovery, the performance of choosing Ta equal to Td
provide 78 seconds longer as compared with choosing the
value Ta equal TiTd and also provide 56 seconds longer
as compared by choosing the value Ta equal to Ti. The
analysis of performance ISE load tuning also showed that, the different value of Ta does not impact the rise
time and all of the selection Ta provides equal time which
is 1762 seconds.
The analysis of performance PID controller with ZN tuning denote that it has similar transient patent with PID controller with ISE-Load tuning where the fastest settling time and minimum overshoot are given by choosing Ta
equal to Td whereas for fastest time in recovering
disturbances are given by select the Ta equal TiTd .
For IMC tuning, the analysis indicates that the
selection value Ta equal to Td and TiTd will eliminate
the overshoot as compared with Ta equal to Ti but it
produce slow transient response and resulted large rise time. Nevertheless the fastest settling time and fastest time recovery disturbances are achieved by selecting the
value Ta equal to TiTd .
Further observation on the analysis shows that, amongst three PID controller tuning methods evaluated here, the ISE-Load with selection Ta equal to Td provide
the fastest settling time as compared with other tuning method and for minimum overshoot is achieved by IMC
tuning with selection Ta equal to Td or TiTd which
provide 0% overshoot, while for the fastest time in recovery sudden disturbances are given by IMC tuning
with selection Ta equal to TiTd .
These analysis indicates that all tuning discussed has they own advantages and disadvantages. To select the tuning that produces the best performance is highly depending on the desired control objectives. Tuning that produces the fastest settling time with a low percentage of overshoot is preferred in this study so that it has ability to improve the batch cycle time and also maintain product quality. From the simulation results, the ISE-Load with Ta
value equal to Td is selected due to capability of the
tuning in providing faster settling time as compared with other tuning. Moreover the tuning also provides low percentages overshoot and appropriate performance in recovering load disturbances.
providing better PID controller performance in regulating the temperature of glycerin bleaching process. For comparative purpose, another two tuning which are ZN tuning and IMC tuning, are also executed in real time. In this case, the ZN tuning with Ta equal to Td and IMC
tuning with Ta equal to TiTd are selected due to the
capability of the tuning in providing fast settling time and with low percentages overshoot as compared with other selection of Ta value for each PID controller tuning
method.
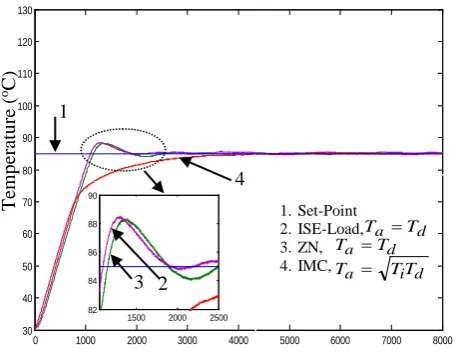
The comparative real time performances of selected PID controller tuning are as illustrated in Fig. 11 whereas Fig. 12 shows the performances in recovery disturbance and the analysis of the performances are as tabulated in Table 6. From the results, the ISE-Load tuning with Ta
equal to Td provide faster time to achieve rise time,
settling time and also in recovery disturbances as compared with ZN tuning with Ta equal to Td. The results
also shows that, the ISE-Load tuning with Ta equal to Td
provides less undershoot as compared with ZN tuning with Ta equal to Td. Even though the IMC tuning with Ta
equal to TiTd produce response without overshoot and
promote faster response in recovery load disturbances as compared with ISE-Load tuning with Ta equal to Td , it
stipulate large settling time. From this observation and analysis, it is shown that the real time results provide similar transient patent with simulation results for regulating temperature of glycerin bleaching process and reveals the capability of ISE-load tuning, with Ta equal to
Td, in providing better transient response as compared to
other tuning used in this study.
Fig. 11 Comparative real time performance of PID controller with difference tuning: ISE –Load with Ta
equal to Td, ZN with Ta equal to Td and IMC with Ta
equal to TiTd .
Fig. 12 Comparative real time performance of PID controller with difference tuning: ISE –Load with Ta
equal to Td, ZN with Ta equal to Td and IMC with Ta
equal to TiTd on disturbances recovery.
Table 6. Real time results analysis
PID
Rise Time, Tr (seconds)
Settling Time,
Ts (seconds)
%
overs-hoot
Time Recovery
Distur-bances (seconds) ISE-Load
(Ta=Td) 1596 3356 6.4 1814
ZN
(Ta=Td) 1640 3472 6.1 1900
IMC
=
d T i T a
T 2906 6100 0.5 1184
6.
Summary
This paper has presented the implementation results of back calculation anti windup on several well tuning method with difference time constant on regulating temperature for glycerin bleaching process. The result indicating that, the PID controller with back calculation anti windup scheme has capability in providing robust control performance in temperature regulation of glycerin bleaching process. From comparative analysis, it can be concluded that the PID controller using ISE-Load tuning with Tracking time constant, Ta equal to derivative time
Td gives the best performance in regulating temperature
of glycerin bleaching process that could enhance the effectiveness of glycerin bleaching process.
3800 4000 4200 4400 4600 4800 5000 5200 5400 5600 5800 65
70 75 80 85 90
1 2
3 4
1.Set-Point 2.ISE-Load 3.ZN 4.IMC
Ta = TiTd
d
a T
T =
d
a T
T =
T
em
p
er
at
u
re (
oC)
Time (seconds) with 2 second sampling ti
Time (seconds) with 2 second sampling time 0 1000 2000 3000 4000 5000 6000 7000 8000 30
40 50 60 70 80 90 100 110 120 130
1500 2000 2500 82
84 86 88 90
1
2 3
4
T
em
p
er
at
u
re (
oC)
1.Set-Point 2.ISE-Load, 3.ZN, 4.IMC,
Ta = TiTd
d
a T
T =
d
a T
References
[1] Mali Hunsom, Payia Saila, Penpisuth
Chaiyakam, and W. Kositnan, "Comparison and Combination of Solvent Extraction and
Adsorption for Crude Glycerol Enrichment,"
International Journal of Renewable Energy Research, vol. 3, pp. 364-372, 2013.
[2] D. J. Sessa and D. E. Palmquist, "Effect of heat on the absorption capacity of an activated carbon for decolorizing/deodorizing yellow zein,"
Journal of Bioresource Technology, vol. 99, pp. 6360-6364, 2008.
[3] G. Kaynak, M. Ersoz, and H. Kara, "Investigation of the properties of oil at the bleaching unit of an oil refinery," Journal of Calloid and interface Science, vol. 280, pp. 131-138, 2004.
[4] A. O'Dwyer, "PI and PID controller tuning rules: an overview and personal perspective,"
Proceedings of the IET Irish Signals and System Conference, pp. 161-166, 2006.
[5] L. Desbourough and R. Miller, "Increasing Customer Value of Industrial Control Performance Monitoring—Honeywell’s Experience," Sixth International Conference on Chemical Process Control, AIChE Symposium,
vol. 98, pp. 172-192, 2002.
[6] P.Cominos and N.Munro, "PID controllers: recent tuning methods and design to
specification " IEE Proceedings -Control Theory and Applications, vol. 149, pp. 46-53, 2002. [7] F. A. Salem, "New Efficient Model-Based PID
Design Method," European Scientific Journal,
vol. 9, pp. 181-199, 2013.
[8] O. Arrieta and R. Vilanova, "Simple PID tuning rules with guarented Ms robustness
achievement," 18th IFAC World Congress, pp. 12042-12047, 2011.
[9] N. Kamaruddin, Z. Janin, Z. Yusuf, and M. N. Taib, "PID Controller Tuning for Glycerin Bleaching Process Using Well-Known Tuning Formulas-A Simulation Study," 35th Annual Conference of IEEE Industrial Electronics, 2009. IECON '09., pp. 1682-1686, 2009.
[10] Z. Janin, Z. Yusuf, and M. N. Taib, "Glycerin Bleaching Process Control Structure "
International Journal of Electrical and Electronic Systems Research, vol. 4, 2011.
[11] M. H. A. Jalil, M. H. Marzaki, N. Kasuan, M. N. Taib, and M. H. F. Rahiman, "Implementation of
anti windup scheme on PID controller for regulating temperature of glycerin bleaching process," 2013 IEEE 3rd International Conference on System Engineering and Technology (ICSET), pp. 113-117, 2013.
[12] M. H. F. Rahiman, "System Identification of Steam Distillation Essential Oil Extraction System," Ph.D dissertation, Faculty of Electrical Engineering, University Teknologi MARA, 2009.
[13] M. N. Taib, R. Adnan, and M. H. F. Rahiman, "Practical System Identification," 2007.
[14] S. R. Vaishnav and Z. J. Khan, "Performance of tuned PID controller and a new hybrid fuzzy PD+I controller," World Journal of Modelling Simulation, vol. 6, pp. 141-149, 2010.
[15] A. O'Dwyer, "PID compensation of time delayed processes 1998-2002: a survey," Proceeding of thr American Control Conference, pp. 1494-1499, 2003.
[16] A. O'Dwyer, Handbook of PI and PID Controller Tuning Rules, 2nd ed.: Imperial College Press, 2006.
[17] A. O’Dwyer, "PI and PID Controller Tuning Rules: An Overview and Personal Perspective,"
IET Irish Signals and Systems Conference, pp. 161-166, 2006.
[18] W. Tan, J. Liu, T. Chen, and H. J. Marquez, "Comparison of some well-known PID tuning formulas," Computers and Chemical
Engineering vol. 30, pp. 1416-1423, 2006.
[19] A. O'Dwyer, "Performance and robustness issues in the compensation of FOLPD processes with PI and PID controllers," Proceedings of the Irish Signals and Systems Conference, pp. 227-234, 1998.
[20] W. K. Ho, O. P. Gan, E. B. Tay, and E. L. Ang, "Performance and Gain Margins of Well-Known PID Tuning Formulas," IEEE Transactions on Control Systems Technology, vol. 4, pp. 473-477, 1996.
[21] C. A. Smith and A. B. Corripio, Principles and Practice of Automatic Process Control, 2 ed.: John Wiley & son, Inc., 1997.
[23] M. Bak, "Control of Systems with Constraints," Ph.D. Thesis, Department of Automation, Technical University of Denmark, 2000.
[24] A. Krolikowski, "Adaptive Generalized Predictive Control Subject to Input Constraint,"
Proceedings of the 7th Mediterranean Conference o Control and Automation (MED99), pp. 374-387, 1999.
[25] A. Visioli, Practical PID Control, 1st ed.: Springer-Verlag London Limited, 2006.
[26] H. Markaroglu, M. Guzelkaya, I. Eksin, and E. Yesil, "Tracking Time Adjustment in Back Calculation Anti-Windup Scheme," in
Proceedings 20th European Conference on Modelling and Simulation, 2006.
[27] K. J. Astrom and T. Hagglund, PID
Controllers:Theory, Design and tuning, 2nd ed.: Instrument Society of America (ISA), 1995.
[28] G. J. Silva, A. Datta, and S. P. Bhattacharyya,
PID Controllers for Time-Delay Systems, 1st ed.: Boston, MA : Birkhäuser Boston, 2005.