Research on Burn Control of Core Plasma with
the Transport Code
∗
)
Yuya MIYOSHI, Yuichi OGAWA and Makoto NAKAMURA
1)Graduate School of Frontier Science, 5-1-5 Kashiwanoha, Kashiwa-shi, Chiba 277-8568, Japan
1)Fusion Reactor Design Group, Devision of Advanced Plasma Research, Naka Fusion Institute, Japan Atomic Energy
Agency, 2-166 Oaza-Obuchi-Aza-Omotedate, Rokkasho, Kamikita, Aomori 039-3212, Japan
(Received 9 December 2011/Accepted 7 August 2012)
For the fusion reactors or experimental devices, one will be required to control several plasma parameters, like the fusion power, the heat flux, the neutron flux, the beta-value and so on. To control these parameters, many diagnostics and actuators are needed, but the diagnostics and actuators available in DEMO/commercial reactors are limited because of the high heat or neutron flux. For these reasons, to realize the fusion reactors, the construction of the reactor control logic is required. We are developing the burn control logic in the core plasma with a 1.5D transport code, and discussing on the relationship between control parameters and actuators. To demonstrate the feasibility of the core plasma control, we have demonstrated the simultaneous control of the fusion power and the safety factor profile with the gas-puffand NBI.
c
2012 The Japan Society of Plasma Science and Nuclear Fusion Research Keywords: burn control, NBI, gas-puff, q-profile, multiple control DOI: 10.1585/pfr.7.2405135
1. Introduction
In operating fusion experimental and DEMO reactors, control of many various parameters would be indispens-able from the viewpoints not only of plasma performance but also of engineering requirements. For example, one is required to keep the plasma density, temperature, fusion power and so on to the target values, by taking many phys-ical and/or engineering constraints such as the limitation of the heat flux to the divertor into account. For satisfy-ing these requirements, the consideration on the diagnos-tics and the actuators is very important, because almost all of diagnostic tools might be unavailable under the envi-ronment of high radiation and methods of active control would be quite limited. Taking these limitations and con-straints, it is, therefore, required to identify the combina-tion of diagnostics and actuators and to construct the con-trol logic [1–3].
For this purpose, at first, we have started the simula-tion of core plasma control by using core plasma transport code. Similar analyses are done in some researchers; e.g., the current drive simulation with the measurement of cur-rent profile peaking factor [4], the curcur-rent drive and control simulation in ITER [5, 6], the density profile control anal-ysis in ASDEX [7]. The plasma burn control simulation is done in JT-60U [8–10] and in Ref [11]. In most of these researches, they control one parameter with one actuator for moderate performance plasma. For the future reactors, however, controlling multiplex parameters with multiplex author’s e-mail: [email protected]
∗)This article is based on the presentation at the 21st International Toki
Conference (ITC21).
actuators in higher performance plasma is needed. It is also needed to clarify the tolerance of controlling the high performance plasma.
To do this, one must take the interaction between the actuators into account. Based on this perspective, one can write the relationship between the control values and the
↔
G×A=↔C, (1)
actuators which is need for future reactor as follows for convenience.
Here, we call the tensor G in left hand of eq. (1) ‘gov-erning tensor’, the vector A in left hand of eq. (1) ‘actuator vector’ and the vector C in right hand of eq. (1) ‘control volume vector’. The elements of actuator vector are gas-puff, NBI, DT fuel pellet, impurity injection and so on, while those of the control volume vector are fusion power, plasma density, q-profile, divertor heat load and so on. In general, for example, fusion power mainly depends on the amount of gas-puff. The influence, however, of NBI, pellet injection and impurity injection for the fusion power also must be taken into account. This means that off-diagonal terms in the governing tensor might become quite impor-tant, and the control might become very complex. In ad-dition, sometimes we may consider the situation that the number of the actuator would be less than that of the con-trol volume; i.e., the governing tensor is not a square ma-trix.
In this article, we will show the simulation of simul-taneously control of the fusion power and the safety factor profile with gas-puffing and NBI for the ITER steady-state operation plasma. In this case, the control logic can be
c
2012 The Japan Society of Plasma
written as follows:
In an alpha-heating dominated plasma, the amount of
a11 a12 a21 a22
Pfus−Preffus qmin−qrefmin
= Ppuf Pnbi , (2)
gas-puff, which governs the plasma density, strongly af-fects on the fusion power and the NBI, which is expected to control the current profile, contributes to the minimum
q-value. In section 2, the simulation model of the core
plasma control is shown. In section 3, we show the several simulation results such as the fusion power control by use of the PID control of the gas puff, the minimum-q value control by use of the NBI, and the simultaneous control of fusion power and the minimum value of the safety factor by uses of gas-puffand NBI. Consideration on the actua-tors and control parameters in fusion reactor is quite im-portant. In section 4, the discussion and summary are pre-sented.
2. Simulation Model of the Core
Plasma Control
The simulation is done with 1.5D transport code. Here we adopt the ITER steady-state operation mode. The main input parameters are as follows:
Rp=6.3 m, ap=1.75 m, κ=1.8, δ=0.4, Ip=9 MA, Bt=4.76 T,
Pnbi=70 MW, Enbi=1 MeV,
where Rp, ap,κ,δare the plasma major radius, minor
ra-dius, elongation, triangularity, respectively, and Ip, Bt, Pnbi, Enbiare the plasma current, the toroidal magnetic field, the
power of NBI, the energy of NBI, respectively. The trans-port coefficients are below.
Dj=0.02/ne(1020m−3), χj=0.08 Te(keV)/ne(1020m−3).
The amount of gas-puffis determined based on pro-portion, integration and differential of fusion power. The PID gain is decided with Ziegler-Nichols ultimate sensitiv-ity method. The plasma transport equation are from
∂nj(r,t)
∂t =
1
V
∂ ∂rΓ
j
ion(r,t)+S i
(r,t), (3)
Γi
ion(r,t)=V|∇r| 2
×
Dj
∂nj(r,t)
∂r =
1
V +Vjnj(r,t)
, (4)
Sj(r,t)=SNBIj (r,t)+Sntrj (r,t), (5) 3
2 ∂pi
∂t =
1
V
∂ ∂r
Qj+
5 2TjΓ
j ion + 1 V Γj ion nj
∂pj
∂r +Sp j,
(6)
Qj=V|∇r|2
χj
∂pj
∂r +pjvj
, (7)
∂Θ ∂t =−
1 Φ ∂ ∂r ⎛ ⎜⎜⎜⎜⎜ ⎝ηR
−1(J
ϕ−Jϕex)
R−2
⎞ ⎟⎟⎟⎟⎟
⎠, (8)
Θ≡ ∂Ψ ∂Φ ≡
1 (2π)2q, Φ=
r I(Ψ)
R2 d
3x, (9)
eq. (3) to (9).
Where index j, SNBIj , Sntrj and Sp jare particle species,
source from NBI injection, source from gas-puffand heat source respectively. Sntrj is calculated from Boltzman equa-tion with Monte-Carlo method. SNBIj is calculated from 1-D Fokker-Plank equation and NBI current profile is cal-culated at the same time.The NBI and bootstrap currents are self-consisitently determined from the tranpsort simu-lation results, and since the total plasma current is kept to the fixed value, the remainder of the current is presumed to be ohmic current.
3. Transport Simulation Result
3.1
Fusion power control
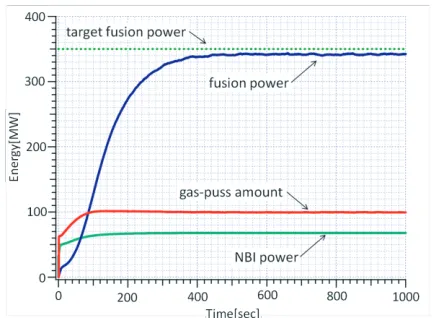
At first, we have carried out the fusion power control by using the modulation of the gas puffing. The simulation result is shown in Figs. 1 and 2. Figure 1 shows the control of burning plasma with the fusion power of about 350 MW.
Fig. 1 The blue, red and green solid lines are fusion power, gas-puffamount and NBI power respectively, and green dashed line is target fusion power.
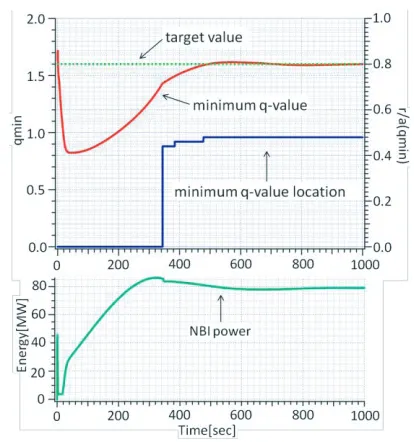
Fig. 2 The red line and blue line are minimum q-value and r/a
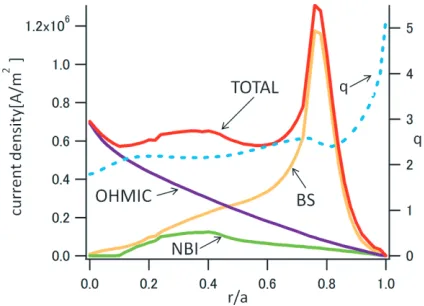
Fig. 3 The red, yellow, green and blue lines are total, boot strap, NBI and ohmic current profile, and light blue dashed line is q profile.
Since the NBI power is 70 MW, the achievement of Q> 5 plasma is demonstrated. Figure 2 shows the minimum
q-value and its location. Since the location of the
mini-mum q-value is in the region of r/a=0.45, the reversed shear profile is observed. The current profile at 1000 sec is shown in Fig. 3. Since the ohmic current is nearly zero, the steady-state operation is realized in this simulation. This might be a typical target plasma for the steady-state oper-ation in ITER, while the plasma parameters with the nor-malized beta value of 2.71, the H factor of 2.82 and the plasma density normalized by the Greenwald density limit ofn/nGW=0.90 are presumed for this plasma.
3.2
Minimum q-value control
In this section, we show the minimum q-value control with NBI. Most of input parameters are same with those in the previous section. The amount of gas-puffis fixed to be 8.0×10²¹particle/sec and NBI power is determined
so as to achieve the reference value of the minimum q-value by using the PID control technique. The simulation results are shown in Fig. 4. In this case, the PID gain is determined with the ultimate sensitivity method too. Fig-ure 4 demonstrates the control of the minimum q-value to be 1.6. However, we should remark that the minimum q-value is less than 1 between 20 sec and 200 sec. At this time, the fusion power becomes about 210 MW and Q is less than 5, so it seems to be necessary to control the fusion power. In this simulation, the NBI power is about 80 MW, gas-puffamount is 8.0×10²¹particle/sec and minimum
q-value is 1.6 at 1000 sec, in the while, in the fusion power control simulation of the previous section the NBI power is 70 MW, gas-puffamount is about 10.0×10²¹particle/sec
and minimum q-value is about 2.1 at 1000 sec. This shows the minimum q-value is depend heavily on not only NBI power but also gas-puffamount. Figure 5 shows the cur-rent profile at 1000 sec in minimum q-value control case. As shown in Fig. 5, bootstrap current is less than that in Fig. 3 and NBI current in Fig. 5 is larger than that in Fig. 3.
Fig. 4 The red blue and green solid line are minimum q-value,
r/a where q-value is minimum and NBI power
respec-tively. The green dashed line is target minimum q-value.
Fig. 5 The red, yellow, green and blue solid lines are total, boot strap, NBI and ohmic current profile, and light blue dashed line is q profile.
It seems that gas-puffamount has large influence on boot-strap current.
3.3
Simultaneous control
Fig. 6 The green, black, blue and red solid lines are fusion power, gas-puff amount, NBI power and minimum q-value respectively, and blue and green dashed lines are target fusion power and target minimum q-value respec-tively.
Fig. 7 The red, yellow, green and blue solid lines are total, boot strap, NBI and ohmic current profile, and light blue dashed line is q profile.
of course, contribute to the density/temperature equations as particle/heat sources, yielding in the change of the fu-sion power. This results in simultaneous control of fufu-sion power and q-min with a combination of the gas puffand NBI power. To simulate the simultaneous control, we add the off-diagonal term in eq. (2), i.e., the effect of the NBI power to the fusion power is taken into account, by in-troducing the PD control technique. The simulation re-sults are shown in Fig. 6, where the fusion power goes to constant value smoothly, keeping a slightly higher fusion power of the target value (350 MW). In this case, the en-ergy gain Q seems to achieve over 10. At the same time,
q-value goes to the target value (qmin=1.8) smoothly. The
reversed shear current profile, however, is not observed in this calculation and it is not full steady state operation, yet. The current profile is shown in Fig. 7. To produce the full steady state operation like Fig. 3, reversed share profile will
be needed. To do this, more appropriate control logic of current profile is needed.
4. Discussion on Control Parameters
and Summary
For the future reactors, the control of many plasma pa-rameters is indispensable. To satisfy this requirement, the construction of the ideal control logic with the combination of the multiplex diagnostics and the multiplex actuators is needed. To find out what parameters are most important, what actuators are most efficient and what diagnostics can be extrapolated in the future reactors is the ultimate goal. The most of previous researches analyze the control of one actuator and one parameter, and the analysis of multiple controls hasn’t been done much. Here, we show the exam-ple of the combination control simulation. We control the fusion power and the safety factor with gas-puffand NBI. The fusion power and the safety factor are controlled by gas-puffand NBI respectively with the PID logic. The PID gain is determined with Ziegler-Nichols ultimate sensitiv-ity method. To control them individually is easy, but si-multaneous control is difficult because of their interaction. In this article, we adjust the PID gain of safety factor and add the PD gain of fusion power to the NBI power at the simultaneous simulation, so as to control these parameters to the target value. In this case, however, reversed shear profile is not observed and it is not full steady state oper-ation. More detailed analysis of minimum q-value control is needed. The current profile control simulation in the ad-vanced tokamak is shown in Ref [12], where the current profile is controlled with LHCD and FWCD assuming that plasma parameters are measureable in real time. In our simulation, we control the current profile with NBI assum-ing the ITER steady-state operation mode as the first step to the analysis of the Demo reactors or the commercial re-actors.
By the way, the time constant of current profile is sev-eral tens of seconds, so the time required for the feedback will be a few seconds. Even though we have no direct mea-surement of the safety factor profile in a fusion reactor, it might be possible to evaluate the current profile (i.g., q-min value and position) by using transport simulation. There-fore, we could control the safety factor profile with the help of the transport simulation in parallel with the plasma op-eration. The fusion reactor control with a help of simul-taneous plasma simulation might be feasible in the future, and this kind of “smart control” seems to be very attrac-tive and helpful in the case that measurable parameters are quite limited such as a fusion reactor.
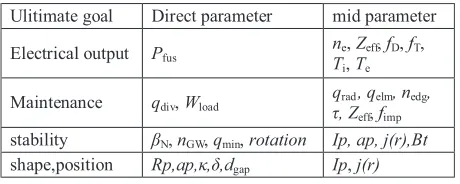
com-Table 1 Parameter categorization.
mercial reactor, but plasma current or current profile mea-surement will be difficult. The diagnostics in the DEMO are discussed in Ref [13] and [14]. The discussion of diag-nostics systems through the simulation of burn control is shown in Ref [15]. To discuss the measureable parameters and the parameters which we want to measure, we catego-rize the goal of the fusion reactor into four items, and list up the parameters associated with them in Table 1. Most of the parameters which we can measure are mid param-eters in Table 1. This categorization might be helpful for
discussing the control of the fusion reactors. More detailed analysis of the control logic and discussion of diagnostics are future work.
[1] J.A. Snapes et al., Fusion Eng. Des. 85, 461 (2010). [2] B. Goncalves et al., Energy Conversion and Management
51, 1751 (2010).
[3] Y. Kamata, J. Plasma Fusion Res. 86, 519 (2010) (in Japanese).
[4] H. Ouarit et al., Fusion Eng. Des. 86, 1018 (2011). [5] J. Citrin et al., Nucl. Fusion 50, 115007 (2010). [6] R.V. Budny, Phys. Plasmas 17, 042506 (2010). [7] A. Mlynek, et al., Nucl. Fusion 51, 043002 (2011). [8] K. Shimomura et al., Fusion Eng. Des. 82, 953 (2007). [9] H. Takenaga et al., Nucl. Fusion 48, 035011 (2008). [10] H. Takenaga et al., J. Nucl. Mater. 390- 391, 869 (2009). [11] H.P.L. de Esch et al., Fusion Eng. Des. 26, 589 (1995). [12] D. Moreau, Nucl. Fusion 39, 685 (1999).
[13] A.E. Costley, IEEE Transaction on Plasma Science 38, No10, OCTOBER (2010).