A multi objective model for supplier evaluation and selection
in the presence of both cardinal and imprecise data
Seyed Morteza Hatefi
1,*1Faculty of Engineering, Shahrekord University, Rahbar Boulevard, PO Box 115, Shahrekord, Iran.
Received 3 November 2016; accepted 6 April 2017, available online 6 April 2017
1.
Introduction
The main purpose of the recent supply management is to gain the long term relationship with fewer and reliable suppliers. Therefore, supplier evaluation, which is an important phase in supply management, depends on assessing a wide range of quantitative and qualitative factors [1]. Brun et al. [2] introduced a framework for selecting the right performance measurement system for different supply chains. Ho et al. [3] and Karsak and Dursun [4] obtained two comprehensives review on supplier selection methods.
A part of literature is assigned to the supplier selection problem in which performance criteria are imprecise and express in the form of fuzzy numbers. In this line of research, Azadi et al. [5] proposed fuzzy data envelopment analysis for green supplier selection. Hatami-Marbini et al. [6] applied a flexible cross-efficiency data envelopment analysis to solve supplier selection problem. Fallahpour et al. [7] proposed an integrated model based on the fuzzy data envelopment analysis and genetic programing for green supplier selection.
All aforementioned studies are subjective approaches that require experts’ subjective opinion and their judgments to solve supplier selection problem. Subjective information may strongly affect the final ranking results. Secondly, when applying the AHP method, it is generally a difficult task for the decision maker to accurately assign crisp numbers to each pair-wise comparison. Thirdly, when the size of problem (i.e., the number of criteria and suppliers) grows, it is almost impossible using the AHP method because of difficulties when dealing with large pair-wise comparison matrices. Therefore, some authors use a more robust mathematical method such as DEA which does not require any subjective information [8-12].
In all DEA models extended in the aforementioned studies, it is emphasized that the performance measures (i.e., inputs and outputs) are exact. However, there are real situations, in which some of the inputs and outputs with respect to supplier attributes are imprecise in the form of bounded data, ordinal data and ratio bounded data. To address this issue, Wu et al. [13] presented a modified DEA method for supplier selection with imprecise information.
Saen [14] proposed an imprecise DEA (IDEA) model to evaluate the performance of suppliers in the presence of both quantitative and qualitative data. The author applied the proposed model to evaluate the performance of 18 suppliers based on three performance measures. The total cost of shipments (TC) and supplier reputation (SR) considered as the cardinal and ordinal inputs, respectively. Besides, the number of bills received from supplier without errors (NB) considered as a bounded output. However, the IDEA model proposed by Saen [14] has some drawbacks such as unrealistic inputs-outputs weights and poor discrimination power among all suppliers, especially efficient suppliers. Since for each supplier, the IDEA model provides a flexibility to choose the weights in its own favour, i.e. in a way to maximize its own efficiency score. Allowing such weight flexibility may result in identifying a supplier to be efficient by giving an extremely high weight to criteria with respect to which it has shown an extremely good performance and an extremely small weight to those with respect to which it has shown a bad performance. Such an extreme weighting is unrealistic and causes the IDEA model to have a poor discriminating power. Moreover, IDEA model presented by Saen [14] is not an appropriate decision tool for supplier selection. Since, in case where there are several efficient suppliers, the conventional IDEA model cannot discriminate them and select the best
Abstract: Imprecise data envelopment analysis (IDEA) has been applied for supplier selection in the presence of both cardinal and imprecise data. In addition to its popularity, IDEA has some drawbacks such as unrealistic inputs-outputs weights and poor discrimination power among all DMUs. To alleviate these deficiencies, this paper develops a multi objective imprecise data envelopment analysis (MOIDEA) based on the common weights. The proposed MOIDEA model is utilized for supplier evaluation and selection in the case where there exist both cardinal and imprecise data. To show both robustness and discriminating power of the proposed approach, it is applied on a numerical example taken from the literature. The results reveal several merits of the common weight MOIDEA model for supplier selection.
supplier. Saen [15] also proposed a pair of nondiscretionary factors imprecise data envelopment analysis (NF-IDEA) mode for supplier selection.
To avoid unrealistic weight distribution and overcome the poor discriminating power of DEA models with exact data, several approaches have been proposed in DEA literature. One of them is constructed based on the weight restrictions. In the case of supplier selection, Saen [16] addressed a DEA model by considering both cardinal and ordinal data and weight restrictions. However, DEA models with weight restrictions are formulated based on the value judgment, which reduces the degree of objectiveness of DEA. To alleviate aforementioned deficiencies, some studies focused on the common weight DEA models with exact data [17-20].
This paper develops a multi-objective imprecise DEA model based on the common weights for supplier evaluation in the presence of both cardinal and imprecise data. The proposed model improves the discriminating power among all suppliers. In addition, it can discriminate the efficient suppliers and determine a single supplier as the best one and at the same time it does not require any subjective information. The proposed model is computationally efficient, since, it does not require solving one LP model to evaluate each supplier. The efficiency of all suppliers can be provided by just solving the proposed model one time.
The rest of the paper is organized as follows. Section 2 briefly presents the conventional IDEA model. The proposed common weight multi-objective DEA model under both cardinal and imprecise data is constructed in section 3. The solution procedure of the proposed model is demonstrated in section 4. Application of the proposed model for supplier selection is shown by a numerical example taken from the literature in section 5. The robustness and discriminating power of the proposed model are also illustrated in this section. Finally, the concluding remarks are reported in section 6.
2.
Imprecise data envelopment analysis
The DEA model developed by Charnes et al. [21] is a mathematical programming model that considers several inputs and outputs to assess the efficiency of n decision-making units (DMUs) with m inputs and s outputs. The efficiency of k-th DMU can be calculated by solving the following model [22]:
mi ik i s
r rk r k
x
v
y
u
f
Max
1 1
n
j
x
v
y
u
t
s
mi ij i s
r rj r
,...,
2
,
1
1
.
.
1
1
m
i
s
r
v
u
r
,
i
,
1
,...,
,
1
,
2
,...,
(1)where
xij: the i-th input value for j-th DMU,
yrj: the r-th output value for the j-th DMU,
ur: the weight of the r-th output,
vi : the weight of the i-th input, and
: a very small positive value.The above fractional DEA model assumes that all outputs and inputs data are exact. However, there are many situations especially in the supplier selection problems where the exact data are not available. Zhu [23] discussed that some of the inputs and outputs may be imprecise data in the form of bounded data, ordinal data and ratio bounded data as follows:
Bounded data:
ij ij ij rj
rj
rj
y
y
and
x
x
x
y
BI
i
BO
r
for
,
(2)
where
rj
y
andx
ij denote the lower bounds,y
rj andij
x
denote the upper bounds, and BO and BI represent the sets of underlying bounded outputs and bounded inputs, respectively.Weak ordinal data:
DI
i
DO
r
k
j
for
x
x
y
y
rj
rk;
ij
ik
,
,
or, to simplify the presentation.
DO
r
y
y
y
y
r1
r2
rk
rn
(3)
DI
i
x
x
x
x
i1
i2
ik
in
(4) where DO and DI represent the sets of underling weak ordinal outputs and inputs, respectively.
Strong ordinal data:
SO
r
y
y
y
y
r1
r2
rk
rn
(5)
SI
i
x
x
x
x
i1
i2
ik
in
(6) where SO and SI represent the sets of underling strong ordinal outputs and inputs, respectively.
Ratio bounded data:
,
0
0
RO
r
j
j
U
y
y
L
rjrj rj
rj
(7)
RI
r
j
j
H
x
x
G
ijij ij
ij
0
0
(8)
where
L
rjandG
ij represent the lower bounds, andrj
U
andH
ij denote the upper bounds. RO and RI represent the sets of underlying ratio bounded outputs and inputs, respectively.Suppose
x
ij
i andy
rj
r represent any or all of Eq. (2-8). If we have some imprecise inputs and (or)converted to the following fractional programming i.e., model (10), by Zhu scale-transformation [23] and variable-alteration, which are formulated as follows:
j
i
x
v
X
j
r
y
u
Y
ij i ij rj r rj,
,
(9)
Using the fractional IDEA model (10) where some inputs and/or outputs are imprecise and others are exact, the
efficiency score of k-th DMU can be measured by
h
k as follows [23]:j
Y
i
X
D
Y
D
X
n
j
X
Y
t
s
X
Y
h
Max
rj ij r rj i ij m i ij s r rj m i ik s r rk k
0
,
,
0
~
,
~
,...,
2
,
1
,
1
.
.
1 1 1 1(10)
In the above model,
iand
r are also transformed intoD
~
iandD
~
r respectively as follow;1. bounded data: rj r rj
rj
r
y
Y
u
y
u
andij i ij ij
i
x
X
v
x
v
.2. ordinal data:
Y
rj
Y
rk andX
ij
X
ik
j
k
forsome r, i,
3. ratio bounded data: rj
rj rj rj
U
Y
Y
L
0 and
)
(
0 0j
j
H
X
X
G
ij ij ijij
.4. exact data:
Y
rj
u
ry
ˆ
rj andX
ij
v
ix
ˆ
ij, whererj
y
ˆ
andx
ˆ
ij represent exact data.
3.
The proposed multi objective imprecise
data envelopment analysis (MOIDEA)
The proposed MOIDEA model is established based on the computation of efficiency through the difference between inputs and outputs. Chen et al. [18] used the difference approach to introduce multi-objective DEA with exact data. The logic behind the use of this difference in situation which some inputs and outputs are imprecise, is interpreted as follows:
The proposed MOIDEA model is originated from model (10). To do this end, consider a DMUk and some values
m
i
s
r
Y
X
v
u
r,
i,
ik,
rk,
1
,...,
,
1
,
...,
* * *
*
satisfying the
constraints of problem (10). We have the following equality statements
:
0
1
1 * 1 * 1 * 1 * 1 * 1 *
s r rk m i ik s r rk m i ik m i ik s r rk kY
X
Y
X
X
Y
h
In other words, when the ratio of the outputs to the inputs is 1 (i.e., hk is efficient), the difference between the inputs
and outputs is zero and vice versa. If the difference between inputs and outputs becomes zero for a given DMU, it is efficient. Therefore, the difference between inputs and outputs can be used as a basis for the efficiency computation. Now, we show that the efficiency of DMU k can be investigated by minimizing the difference between outputs and inputs. Therefore, we propose to use the difference between outputs and inputs to construct a novel MOIDEA model.
By assuming
m
i
ik
k
n
X
1...,
,
1
,
0
, the constraints ofmodel (10) are equivalent to the following statements
.
n
j
X
Y
m i ij s rrj
0
,
1
,
2
,
...,
1 1
(11)
By referring to the constraints of the model (10), we conclude that:
1
0
1 1
m i ik s r rk kX
Y
h
Thus, the maximum value that the efficiency hk can
ideally reach is equal to 1. We introduce
s r rj m i ijk
X
Y
g
1 1
for each DMU. According to
formulation (11), we deduce:
s r rj m i ij kX
Y
g
1 1
0
.The smallest value that
g
k can ideally receive is equal to0. If
g
k
0
then
s r rj m i ijY
X
1 1which means
1
k
j
Y
i
X
D
Y
D
X
n
j
X
Y
t
s
Y
X
Max
rj ij r rj i ij m i ij s r rj s r rk m i ik
0
,
0
~
,
~
,...,
2
,
1
,
1
.
.
1 1 1 1 (12)The constraints of model (12) are equivalent to those of model (10). Moreover, if the optimal value of the objective function of problem (12) becomes zero, then DMU k is efficient. If DMU k is efficient in the sense of model (10), then we have:
1
1 * 1 *
m i ik s r rk kX
Y
h
where
X
ik*,
Y
rk*,
v
i*,
u
r* are the corresponding optimal solutions. Then, they are also optimal for problem (12), and the optimal value of its objective function is0
k
g
, that is, the DMU k is also efficient in the sense of model (10). If the DMU k is not efficient, an optimal solution of problem (10) is not necessarily optimal for problem (12). Conversely, an optimal solution of problem (12) is not necessarily optimal for problem (10). Thus, problems (10) and (12) are equivalent only in the case where DMU k is efficient.We proposes problem (13) which is equivalent to problem (12). The objective function of proposed model
(13) is to minimize the distance function between
g
k and 0.j
Y
i
X
D
Y
D
X
n
j
Y
X
t
s
g
d
Min
rj ij r rj i ij s r rj m i ij k
0
,
0
~
,
~
,...,
2
,
1
1
.
.
)
0
,
(
1 1 1 (13)which
g
k
d
1(
g
k,
0
)
|
g
k
0
|
is the usual distance in R. Problem (13) can be interpreted as follows. Whenthe optimal value of
d
1(
g
k,
0
)
be equal to 0, that is,g
k
0
, DMU k is efficient. When the optimal valued
1(
g
k,
0
)
0
, that is,g
k
0
, the DMU k is inefficient. According to the proposed model (13), the efficiency value of DMU k is calculated as:
m i ik s r rk kX
Y
h
1 * 1 * whereY
rk*
and
X
ik* are corresponding optimal values of model (13).According to model (13), the efficiency of special DMU k is measured by minimizing the distance from ideal point 0. Therefore, if we want a common set of weights that maximizes the efficiency of all DMUs, the proposed multi-objective DEA model is initially written as:
j
Y
i
X
D
Y
D
X
n
j
Y
X
t
s
g
d
Min
g
d
Min
g
d
Min
rj ij r rj i ij s r rj m i ij n
0
,
0
~
,
~
,...,
2
,
1
1
.
.
)
0
,
(
)
0
,
(
)
0
,
(
1 1 1 2 1 1 1
(14)The goal of the proposed multi objective problem (14) is to minimize the distance to the ideal value 0 for each of DMUs. Hence, n-vector (0, 0,…,0) is considered as a reference point. In order to obtain a solution, We propose to convert the above n objective functions into the following single objective function.
j
Y
i
X
D
Y
D
X
n
j
Y
X
t
s
g
g
g
d
Min
rj ij r rj i ij s r rj m i ij n
0
,
0
~
,
~
,...,
2
,
1
1
.
.
))
0
...,
,
0
,
0
(
),
...,
,
,
((
1 1 2 1 1 (15) where
n ki k ng
g
g
g
d
1 2 11
((
,
,
...,
),
(
0
,
0
,
...,
0
))
|
0
|
. Theobjective function of problem (15) is about minimizing the distance to the reference point (0, 0,…,0). Therefore, we can extend other distance functions as follows:
where q q n k k n
q
g
g
g
g
d
1
1 2
1
,
,
...,
),
(
0
,
0
,
...,
0
))
|
0
|
((
q
1
,
. The distance withq
is called chebychev metric [24]. This paper assumes that the central authority focuses more on the least efficient DMU, and then the most adequate distance is the Chebychev distance. According to this matter, proposed model (16) is converted to the following model:j
Y
i
X
D
Y
D
X
n
j
X
Y
t
s
g
Max
Min
g
Max
Min
rj ij r rj i ij m i ij s r rj k k n k n k
0
,
0
~
,
~
,...,
2
,
1
,
1
.
.
|
0
|
1 1 0 0 (17)Following Steuer [24], the above problem may produce a weak Pareto optimal solution, but not Pareto optimal. Therefore, we propose to apply the modified Tchebychev metric to get a Pareto optimal solution [24]. Finally, we reformulate the above problem as follows:
j
Y
i
X
D
Y
D
X
n
j
X
Y
t
s
z
g
z
g
Max
Min
rj ij r rj i ij m i ij s r rj n k k k n k
0
,
0
~
,
~
,...,
2
,
1
1
.
.
)
(
1 1 1 0
(18)where
andz
are sufficiently small scalars. Asg
k is non-negative, this article proposes to rewrite problem (18) to the following problem:j
Y
i
X
D
Y
D
X
n
j
X
Y
n
k
z
g
z
g
t
s
Min
rj ij r rj i ij m i ij s r rj n k k k
0
,
0
~
,
~
,...,
2
,
1
1
,...,
2
,
1
)
(
.
.
1 1 1
(19)where
,
1
,
2
,
...,
.
1 1
n
k
Y
X
g
s r rk m i ikk
Proposed model (19) may result in more than one efficient supplier, and thus, fails in determining the best DMU. In such situation, Karsak and Ahiska [17] introduced a discriminating parameter to discriminate efficient DMUs in the context of DEA models. By following their approach, we propose the following common weight MODEA model to overcome this difficulty:
j
Y
i
X
D
Y
D
X
n
j
X
Y
n
k
z
g
z
g
t
s
z
g
K
Min
rj ij r rj i ij m i ij s r rj n k k k EF l l
0
,
0
~
,
~
,...,
2
,
1
1
,...,
1
,
)
(
.
.
)
(
1 1 1
(20)where EF denotes the set of DMUs that are currently received efficiency score of 1 and
K
[
0
,
1
]
is a
discriminating parameter. Proposed model (20) finally converges to a single DMU which receives efficiency score of 1 by augmenting the value of K from zero to one with a predetermined step size like 0.01 or 0.1. The lesser gl value of efficient DMUs by applying model (20) resultsin the better rank for lth DMU.
4.
Solution procedure
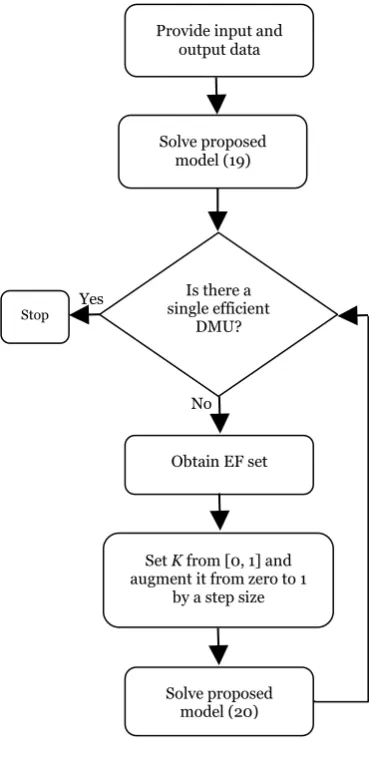
In order to solve the supplier selection problem, we first employ proposed model (19) to obtain the efficiency score of suppliers. Sometimes, model (19) may result in more than one efficient supplier and hence decision maker cannot have any discrimination among efficient suppliers. In this manner, we recommend to use proposed model (20) to discriminate all suppliers. To sum up, we can carry out the following steps, which are graphically depicted in Figure 1, to obtain the full ranking results for all suppliers. In this manner, we can select the best supplier.
Step1. Obtain the data for input and output variables and use formulations (2-8) for imprecise input-output variables.
Provide input and output data
Solve proposed model (19)
Is there a single efficient
DMU?
Obtain EF set
Set K from [0, 1] and augment it from zero to 1
by a step size
Solve proposed model (20) Stop Yes
No
Fig 1. The solution procedure
Step 3. Construct the EF set, which contains the efficient suppliers determined in step 2. On the other hand, the suppliers that are received efficiency score of 1 by solving model (19) form EF set.
Step 4. Formulate proposed model (20) based on the EF set introduced in step 3. Then, solve proposed model (20), by augmenting the discrimination parameter K
[0, 1] from zero to 1 by a predetermined step size like 0.01 or 0.001. Repeat step 4 until a single DMU remains efficient. It is worthy to mention that model (20) finally converges to a single best supplier with efficiency score of 1.Application of the proposed MOIDEA model as well as the solution methodology is illustrated in the next section
.
5.
Application of the proposed model for
supplier selection
Saen [14] proposed the following model for supplier selection in the presence of both ordinal and cardinal
data. Model (21) requires solving n LP model to obtain the efficiency score of each supplier.
j
Y
i
X
D
Y
D
X
X
n
j
X
Y
t
s
Y
Max
rj ij
r rj i ij m
i ik
m
i ij s
r rj s
r rk
0
,
0
~
,
~
1
,...,
2
,
1
1
.
.
1
1 1
1
(21)
Saen [14] employed model (21) to evaluate 18 suppliers whose the related data are presented in Table 1. The proposed multi-objective models are also applied on this data to evaluate and rank 18 suppliers. This data contains two inputs. The total cost of shipments (TC) is considered as the cardinal input. The other input which is considered as the qualitative input, is supplier reputation (SR). SR is an intangible factor that is not usually explicitly included in evaluation model for supplier. This qualitative variable is measured on an ordinal scale. Also number of bills received from supplier without errors (NB) is considered as the bounded output.
The results of applying model (21) are shown in columns 5 and 6 of Table 1, which were obtained by Saen [14]. Seven out of 18 suppliers are received efficiency score of 1, i.e., supplier numbers 4, 6, 8, 9, 11, 14 and 17. The remaining 11 suppliers are inefficient whose efficiency scores are less than 1. According to the results, model (21) cannot discriminate the efficient suppliers and therefore fails to rank them and select the best supplier. To overcome this deficiency, this paper proposes MOIDEA model via common weights which has more discriminating power compared to model (21) for supplier evaluation and selection.
The seventh column presents the efficiency scores by applying the proposed MOIDEA model. According to the results, three out of 18 suppliers receives efficiency score of 1, i.e., supplier numbers 4, 11 and 14 which are also considered as efficient suppliers by using model (21). The remaining suppliers, which receive efficiency score smaller than 1, are considered as inefficient suppliers. The number of efficient suppliers reduces from seven to three by applying the proposed model (19). This reduction implies the high discrimination power of the proposed MOIDEA model (19) compared with model (21). However, in this case model (19) could not discriminate all suppliers and hence it is unable to select the best supplier.
Table 1
Table 1. Data and results
Supplier No.
Inputs Output Saen (2007) MOIDEA
TC x1j SRa x2j NB y1j Efficiency Ranking Efficiency Ranking
1 253 5 [50, 65] 0.722 12 0.332 13
2 268 10 [60, 70] 0.7 13 0.338 12
3 259 3 [40, 50] 0.556 16 0.250 17
4 180 6 [100, 160] 1 1 1 1
5 257 4 [45, 55] 0.611 15 0.277 16
6 248 2 [85, 115] 1 1 0.600 7
7 272 8 [70, 95] 0.95 8 0.452 11
8 330 11 [100, 180] 1 1 0.706 6
9 327 9 [90, 120] 1 1 0.475 10
10 330 7 [50, 80] 0.8 10 0.314 15
11 321 16 [250, 300] 1 1 1 1
12 329 14 [100, 150] 0.75 11 0.590 8
13 281 15 [80, 120] 0.66 14 0.553 9
14 309 13 [200, 350] 1 1 1 1
15 291 12 [40, 55] 0.55 17 0.245 18
16 334 17 [75, 85] 0.34 18 0.329 14
17 249 1 [90, 180] 1 1 0.935 4
18 216 18 [90, 150] 0.892 9 0.899 5
a Ranking such that: 18=highest rank, …. , 1= lowest rank
17 , 2 16
, 2 18 ,
2
x
x
x
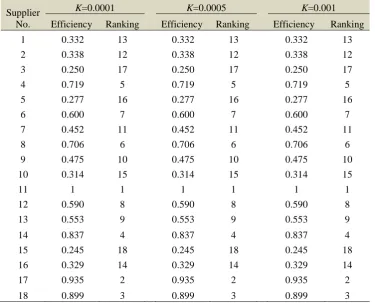
Table 2. Summary of results by applying model (20)
Supplier No.
K=0.0001 K=0.0005 K=0.001
Efficiency Ranking Efficiency Ranking Efficiency Ranking
1 0.332 13 0.332 13 0.332 13
2 0.338 12 0.338 12 0.338 12
3 0.250 17 0.250 17 0.250 17
4 0.719 5 0.719 5 0.719 5
5 0.277 16 0.277 16 0.277 16
6 0.600 7 0.600 7 0.600 7
7 0.452 11 0.452 11 0.452 11
8 0.706 6 0.706 6 0.706 6
9 0.475 10 0.475 10 0.475 10
10 0.314 15 0.314 15 0.314 15
11 1 1 1 1 1 1
12 0.590 8 0.590 8 0.590 8
13 0.553 9 0.553 9 0.553 9
14 0.837 4 0.837 4 0.837 4
15 0.245 18 0.245 18 0.245 18
16 0.329 14 0.329 14 0.329 14
17 0.935 2 0.935 2 0.935 2
To do this end, discriminating parameter K is set as 0.0001, 0.0005, and 0.001. In other words, discriminating parameter K is augmented from 0.0001 by a predetermined step size like 0.0004 or 0.0005. The efficiency and ranking results of suppliers are reported under different K values in Table 2. According to these results, model (20) discriminates all suppliers under all K values. The ranking of suppliers for different K values are also reported in Table 2. According to these results, supplier number 11 is identified as the best supplier under all K values. It is worthy to mention that in our case all suppliers are discriminated by setting K=0.0001.
However, in the case where the full ranking results are not obtained under a given K value, we must augment this parameter by an appropriate step size so that all suppliers are discriminated and the full ranking results are obtained. An appropriate value for discrimination parameter K is a minimum value for which model (20) converges to a single best supplier.
In the resolution of the problems (20) and (21),
is set to 10-3,
is set to 10−5, and z is set to 10−4.6. Concluding Remarks
Imprecise data envelopment analysis is a popular and applicable tool for supplier evaluation and selection in situation which there are both cardinal and imprecise data. Besides of its popularity, IDEA model has some drawbacks such as unrealistic inputs-outputs weights and the lack of discrimination among of all DUMs. To remove these deficiencies, this paper develops a multi-objective IDEA via common weights in the presence both of cardinal and imprecise data. The proposed MOIDEA is capable to discriminate all of suppliers and specifies one single best supplier. Applicability of the proposed models is illustrated by a numerical example taken from the literature for supplier evaluation and selection. Both robustness and discriminating of the proposed model are studied through this case study. In summary, the proposed common weight MOIDEA has the following merits: 1. The recent IDEA model, i.e., model (21), provides n
sets of weights for underlying performance criteria when evaluating each supplier. It was discussed earlier that such weighting values are unrealistic. Instead, the proposed method obtains a set of common weights for evaluating all suppliers which leads to efficiency scores calculated by similar weights which is very essential for fair comparison of suppliers.
2. The proposed model (19) has more discriminating power than the model (21) by reducing the number of efficient suppliers which receive efficiency score of 1. In the cases in which model (19) provides more than one efficient supplier, by assigning an appropriate value to the discriminating parameter K, model (20) ranks efficient suppliers.
3. The proposed method does not require solving n models as it is the case in model (21). That is, by a single formulation (19), the efficiency score of all
suppliers can be computed. In situation where there exist several efficient suppliers, proposed model (20) finally converges to a single efficient supplier by setting appropriate value for discriminating parameter. However, in the worst case of applying proposed method, the number of models required to be solved, were less than n in our numerical test.
References
[1] Dath, T.N.S., Rajendran, S., Narashiman, K. An empirical study on supply chain management in India: the perspective of original equipment manufacturers and suppliers. European Journal of Industrial Engineering, Volume 4, (2010), pp. 2-39. [2] Brun, A., Salama, K.F., Gerosa, M. Selecting
performance measurement systems: matching a supply chain's requirements, European Journal of Industrial Engineering, Volume 3, (2009), pp. 336 – 362.
[3] Ho, W., Xu, X., Dey, P.K. Multi-criteria decision making approaches for supplier evaluation and selection: A literature review. European Journal of Operational Research, Volume 202, (2010), pp. 16– 24.
[4] Karsak, E.E., Dursun, M. Taxonomy and review of non-deterministic analytical methods for supplier selection. International Journal of Computer Integrated Manufacturing, Volume 29 (2016), pp. 263-286.
[5] Azadi, M., S.M. Mirhedayatian, Saen, R.F., Hatamzad, M., Momeni. E. Green supplier selection: a novel fuzzy double frontier data envelopment analysis model to deal with undesirable outputs and dual-role factors. International Journal of Industrial and Systems Engineering, Volume 25, (2017), pp. 160-181.
[6] Hatami-Marbini, A., Agrell P.J., Tavana, M., Khoshnevis, P. A flexible cross-efficiency fuzzy data envelopment analysis model for sustainable sourcing. Journal of Cleaner Production, Volume 142, (2017), pp. 2761-2779.
[7] Fallahpour, A., Olugu, E.U., Musa, S.N., Khezrimotlagh, D., Wong, K.Y., An integrated model for green supplier selection under fuzzy environment: application of data envelopment analysis and genetic programming approach. Neural Computing and Applications, Volume 27, (2016), pp. 707-725.
[8] Hatefi, S.M., Jolai, F. A new model for classifying inputs and outputs and evaluating the performance of DMUs based on translog output distance function. Applied Mathematical Modelling, Volume 34, (2010), pp. 439-1449.
[10] Hatefi, S.M., Razmi, J. An Integrated Methodology for Supplier Selection and Order Allocation in the Presence of Imprecise Data. International Journal of Industrial and Systems Engineering, Volume 15, (2013), pp. 51-68.
[11] Hatefi, S.M., Torabi, S.A. Bagheri, P. Multi-criteria ABC inventory classification with mixed quantitative and qualitative criteria. International Journal of Production Research, Volume 52, (2014), pp. 776-786.
[12] Yousefi, S., Shabanpour, H. Fisher, R., Saen, R.F. Evaluating and ranking sustainable suppliers by robust dynamic data envelopment analysis. Measurement, Volume 83, (2016), pp. 72-85. [13] Wu, T., Shunk, D., Blackhurst, J., Appalla, R.
AIDEA: A methodology for supplier evaluation and selection in a supplier-based manufacturing environment. International Journal of Manufacturing Technology and Management, Volume 11, (2007), pp. 174–192.
[14] Saen, R.F. Suppliers selection in the presence of both cardinal and ordinal data. European Journal of Operational Research, Volume 183, (2007), pp. 741–747.
[15] Saen, R.F. Supplier selection by the pair of nondiscretionary factors-imprecise data envelopment analysis models, Journal of the Operational Research Society, Volume 60, (2009), pp. 1575-1582.
[16] Saen, R.F. A decision model for ranking suppliers in the presence of cardinal and ordinal data, weight restrictions, and nondiscretionary factors. Annals of Operations Research, Volume 172, (2009), pp. 177– 192.
[17] Karsak, E.E., Ahiska, S.S. A common-weight MCDM framework for decision problems with
multiple inputs and outputs. In: Gervasi O and Gavrilova M (eds). Lect Notes Comput Sci, Volume 4705, (2007), pp. 779–790.
[18] Chen, Y.W., Larban, M., Chang, Y.P. Multiobjective data envelopment analysis. Journal of the Operational Research Society, Volume 60, (2009), pp. 556 -1566.
[19] Hatefi, S.M., Torabi, S.A. A common weight MCDA-DEA approach to construct composite indicators. Ecological Economics, Volume 70, (2010), pp. 114-120.
[20] Torabi, S.A., Hatefi, S.M., Saleck Pay, B. ABC Inventory Classification in the Presence of both Quantitative and Qualitative Criteria, Computers & Industrial Engineering, Volume 63, (2012), pp. 530-537.
[21] Charnes, A., Cooper, W.W., Rhodes, E. Measuring efficiency of decision making units. European Journal of Operational Research, Volume 2, (1978), pp. 429–444.
[22] Charnes, A., Cooper, W.W., Lewin, A.Y., and Seiford, L.M. Data Envelopment Analysis: Theory, Methodology and Applications. Kluwer Academic Publisher: Boston, (1994).
[23] Zhu, J. Imprecise data envelopment analysis (IDEA): A review and improvement with an application. European Journal of Operational Research, Volume 144, (2003), pp. 513–529.
[24] Steuer, R.E. Multiple Criteria Optimization: Theory, Computation, and Application. Krieger Publishing: Malabar, Florida, (1986).