Prototype Phased-Array Patch Loop Antennae for Electron
Cyclotron Emission Diagnostics
∗
)
Masaharu FUKUYAMA, Hiroshi IDEI
1), Miu YUNOKI, Ryuichi ASHIDA, Daichi OGATA,
Ryuya IKEZOE
1)and Takumi ONCHI
1)Interdisciplinary Graduate School of Engineering Sciences, Kyushu University, Kasuga 816-8580, Japan
1)Research Institute for Applied Mechanics, Kyushu University, Kasuga 816-8580, Japan
(Received 9 January 2019/Accepted 9 April 2019)
A two-dimensional (2D) phased-array-antenna (PAA) for electron cyclotron emission is one of the diagnos-tics for finding the window area of mode conversion from electron cyclotron waves to electron Bernstein wave. Spatial resolution of the reconstructed emission field pattern is improved with a lot of the antenna elements. The study proposes a phased-array patch loop antenna (PAPA) as a promising system to increase the elements of PAA. A 2D image reconstruction of a 6 GHz radio frequency source emission shows that the source position is detected within millimeter range by applying the prototype PAPA. This result indicates that the 2D image reconstruction with multi-element PAPA is feasible.
c
2019 The Japan Society of Plasma Science and Nuclear Fusion Research
Keywords: electron cyclotron emission, phased array antenna, patch antenna, adaptive-array technique DOI: 10.1585/pfr.14.3402111
1. Introduction
A non-inductive method to heat plasma and start-up current solely by electromagnetic waves is required in the spherical tokamaks (STs) with limited space for the cen-tral solenoid Ohmic-heating coil. Even though the elec-tromagnetic wave faces its cut-offregarding high plasma density, an electrostatic wave so-called electron Bernstein wave (EBW) can be propagated in such over-dense plasma with no density limits. The obliquely injected ordinary-mode (O-ordinary-mode) wave from the magnetic low-field side (LFS) would be converted to extra-ordinary-mode (X-mode) wave at the O-mode cut-offlayer and then, it is con-verted to EBW at the upper hybrid resonance. The optimal incident angle for the O-X-mode conversion depends on the external magnetic field and the plasma density. The electrostatic EBW emission can be detected as the elec-tromagnetic wave at LFS by the inverse mode conversion from EBW to O-mode [1].
In Q-Shu University Experiment with steady-state Spherical Tokamak (QUEST), the EBW heating and cur-rent drive are performed with major and minor radii as 0.64 m and 0.36 m, respectively. When the O-mode cut-offlayer was positioned at a normalized plasma radiusρ= 0.78, the optimum parallel (to magnetic field) refractive in-dex was evaluated asN//opt=0.61 [2]. To search the mode conversion window, the phased-array waveguide antenna (PAWA) has been developed [3]. Then, the low-power ex-periment with 3×3 PAWA was conducted in QUEST ves-author’s e-mail: [email protected]
∗)This article is based on the presentation at the 27th International Toki
Conference (ITC27) & the 13th Asia Pacific Plasma Theory Conference (APPTC2018).
sel [4]. A thermal noise source (NS) mimicking incoher-ent emission was detected using the adaptive-array tech-nique, and the location of the NS was identified with a two-dimensional (2D) image reconstruction of the emis-sion. Although the way to increase the element of the phased-array antenna (PAA) effectively works to suppress the side lobe and precisely identify the NS location, the fabrication of multiple-PAWA requires complex processes with high cost. Since the patch loop antenna is suitable for mass production due to compact, simple, and lightweight features, the fabrication of multiple-element phased-array patch loop antenna (PAPA) is effective to increase the el-ement of the PAA [5]. This paper demonstrates a 2D im-age reconstruction using prototype PAPA as the proof-of-principle experiment for the multi-element PAPA.
The rest of this paper is organized as follows. In Sec-tion 2, a fabricated patch loop antenna benchmarked for assembling the PAPA is introduced. Section 3 presents test results of the prototype PAPA at low-power facilities, and its 2D emission image reconstruction for finding the loca-tion of radio frequency (RF) and emission source (ES) with PAPA. A brief conclusion is given in Section 4.
2. Patch Loop Antenna
The patch loop antenna in which the loop is square-shaped was designed for 6 GHz-wave detections by ap-plying a three-dimensional (3D) electromagnetic simula-tor“COMSOL Multiphysics”. The simulation results show that the patch loop antenna with a quarter-wavelength side has higher antenna gain than that of the eighth-wavelength side. However, the directivity of the
quarter-wavelength-c
2019 The Japan Society of Plasma
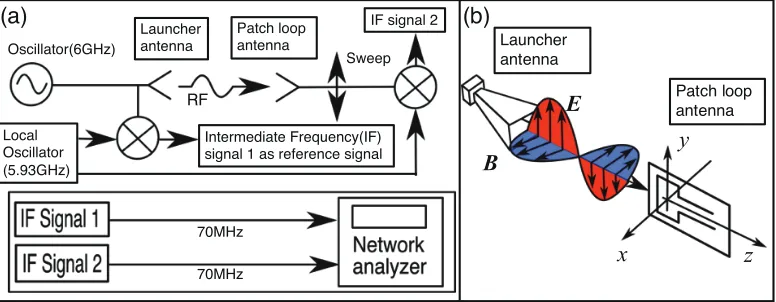
The property of a fabricated antenna was tested us-ing a low-power test system. Figures 2 (a) and (b) show a block diagram of the heterodyne system with a patch loop antenna, a launcher antenna, and a patch loop an-tenna. 6 GHz RF-wave was generated by applying a syn-thesizer. The RF-wave was launched from a quad-ridge an-tenna and its radiation field was received by the patch loop antenna on a 3D stage. The propagating-wave fields were measured as a 70 MHz intermediate frequency wave (IF-wave) with a 5.93 GHz local oscillator wave (LO-(IF-wave) at the heterodyne detection. As shown in Fig. 2 (a), the refer-ence, 70 MHz IF-wave, was detected before the launcher antenna. Using a two-channel network analyzer, the IF phase of the propagating wave was measured as the
dif-Fig. 1 A photo of the patch loop antenna fabricated by milling 1.6 mm thickness paper phenolic copper clad laminates (FR1). The side of the square loop is about quarter-wave.
Fig. 2 (a) Block diagram of the heterodyne system with a quad ridged launcher antenna and a patch loop antenna to observe if the patch antenna can properly detect propagating-wave field-phase. Two synthesizers are used to excite test RF-wave and local oscillator (LO) wave at heterodyne detection, with phase-locking using a 10 MHz clock reference signal. (b) Configuration of a launcher antenna and a patch loop antenna for the phase detection with the patch loop antenna. The position of the receiver loop antenna is shifted by movable 3D stage inx-,y- andz-directions for measuring radiated field-phase profiles or evolution.
(a)
(b)
(c)
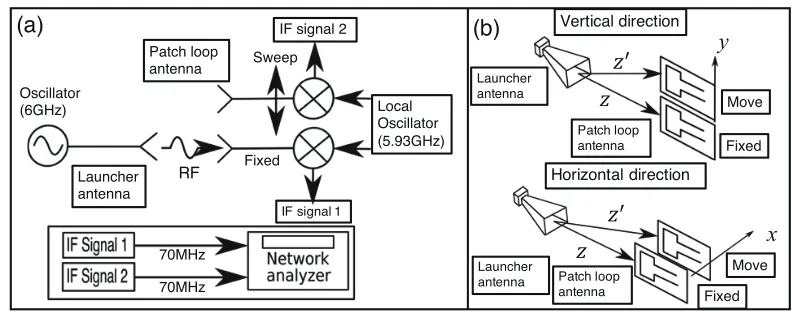
Fig. 4 (a) Block diagram of the heterodyne system with two path loop antennae for checking the interference effect between them. (b) Configuration for checking the interference between the two antennae in phase measurements. The loop antennae are arrayed vertically and horizontally to check the interference in their different directions. The one loop antenna is moved using the 3D stage for the other fixed loop antenna to change the distance between the antennae.
x =y= 0. The origin point was the center of the square loop. As shown in Fig. 3, the profiles and evolution of phase are in good agreement with the calculated results and the expected linear dependence, respectively. These results show that the fabricated patch antenna is present to correctly detect the emitted phase for the adaptive-array analysis.
2.2
Experiment with two patch loop
anten-nae
It is important to accurately measure the phase pro-file and evolution for identifying the ES location through the adaptive-array analysis. Phase measurements would be difficult because of interference when the distance between the two antennae is close. Two patch loop antennae were used to check the interference effect between the anten-nae. Figure 4 (a) shows a block diagram of the heterodyne system with two antennae for checking the interference ef-fect. The same 6 GHz RF-wave was utilized with the same 5.93 GHz LO-wave. As shown in Fig. 4 (b), these anten-nae were arrayed vertically and horizontally in their direc-tions to check the interference. One patch loop antenna was fixed and the position of the other antenna was shifted using the 3D stage. The phase difference (Δθ) between the antennae was measured using a network analyzer.
Δθwas evaluated as a linear dependence on the diff er-ential propagation distance (z−z) between the antennae;
Δθ=k(z−z), wherezdenotes the distance between the launcher and the swept antennae defined asx2+y2+z2.
Figure 5 demonstrates the measuredΔθon (z−z). As shown in Fig. 5 (a), the interference effect between the an-tennae was not detected in the verticaly-direction, since the measuredΔθwas linearly proportional to (z−z). However, as shown in Fig. 5 (b), the measuredΔθwas distorted from the calculated line when the (z−z) was smaller than 5 mm in the horizontalx-direction. When (z−z)=9.6 mm,i.e., the distance between the antennae is 60 mm, the
interfer-Fig. 5 Dependence of the phase difference (Δθ) on differential propagation distance (z −z) between two patch loop antennae, where z denotes the distance between the launcher and the swept antennae which can be defined by x2+y2+z2. The coordinates of (x,y,z) are shown in Fig. 4 (b). The marked distance with broken lines of (z−z)=9.6 mm corresponds to the two antennae dis-tance of 60 mm.
ence effect was not observed even in thex-direction as well as in they-direction, and there was no significant ghost or side lobes on 2D image reconstruction. The configuration with the antenna distance of 60 mm in both x- andy- di-rections has been adopted for the PAPA.
3. PAPA
Fig. 7 (b).
Figure 8 shows each phase evolution of the four-elements onzmeasured at x=y=0. Solid lines present the linear dependencies ofkz for the various antenna el-ements. The measured phase evolutions onzcorrespond to the linear dependencies. This result shows that the ef-fect of interference is relatively small enough. While phase offsets from the difference in length of RF circuits are not
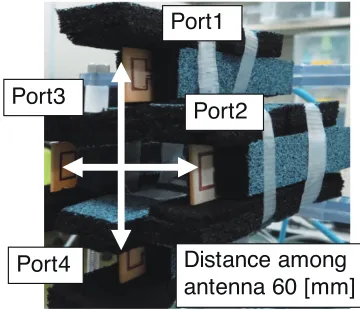
Fig. 6 Photo of fabricated four-element PAPA. The distances be-tween centers of the square loops in horizontal and ver-tical coordinates are 60 mm along the interference check between the antenna elements described in section 3.1.
Fig. 7 (a) Block diagram of the heterodyne system with four-element PAPA to observe whether the phase evolution is correctly measured along the propagation for the adaptive array analysis. (b) Configuration to measure the field-phase evolution along the propagation for each element of the PAPA.
=
(1)
ri =
z2ES+(x−xi)2+(y−yi)2, (2)
where θi denotes the phase differences between the i-th PAA port against port 1. θoffset
i denotes the phase offset
at each port. The coordinates (xi,yi,zi) and (xES,yES,zES)
are the port positions of the PAPA elements and the ES position, respectively.
Figure 9 (a) shows a block diagram of the heterodyne
Fig. 9 (a) Block diagram of the heterodyne system with the four-element PAPA to observe whether the emitted-field image from the launcher antenna is 2-dimensionally reconstructed and its emitted source position is properly detected with the adaptive array-analysis. (b) Photo of the launcher antenna and the four-element PAPA. The launcher antenna is located at (0.030 m,−0.030 m, 0.140 m). Here the coordinate origin is the center of the four-element PAPA.
Fig. 10 Field intensity pattern reconstructed through beam-forming analysis for ES radiation from (xES,yES) = (0.030 m,−0.030 m). The peak point of the reconstructed emission pattern is (0.034 m,−0.024 m).
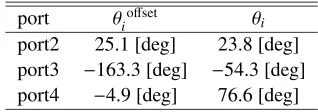
system on PAPA and the ES source position detection. A photo of the launcher antenna and the four-element PAPA is shown in Fig. 9 (b). Each port phase offsets stemming from the difference among the lengths of the RF circuit were evaluated from the symmetric positions on the four elements for the PAPA center. The launcher antenna was set at (x,y)=(0,0), which is the PAPA center. The coordi-nate system is defined as shown in Fig. 9 (b). Here, the nor-mal propagating distance from PAPA center to the launcher antenna wasz=0.140 m. The measured phases were de-scribed by the phase offsets of the antenna ports. The launcher antenna was re-located at (0.030 m, −0.030 m, 0.140 m), whileθiwere measured again. Table 1 summa-rizes the phase differences between the PAA ports against port 1.
Figure 10 shows the reconstructed emission pattern from equations 1 and 2 with the measured phase after the offset calibration. The cross (+) and closed rectangle () denote the ES point and PAPA positions, respectively.
Table 1 Phase differences between the PAA ports against port 1.
port θoffset
i θi
port2 25.1 [deg] 23.8 [deg] port3 −163.3 [deg] −54.3 [deg] port4 −4.9 [deg] 76.6 [deg]
Table 2 Phase differences between the PAA ports against port 1 regarding measurement and calculation.
port measurement (θi−θoffset
i ) calculation
port2 −1.3 [deg] 0.0 [deg]
port3 109.0 [deg] 86.5 [deg]
port4 81.5 [deg] 86.5 [deg]
The peak point of the emission pattern was (0.034 m, −0.024 m) against the ES point of (0.030 m,−0.030 m) in thexandyplanes. The phase differences between the PAA ports against port 1 could be calculated usingkz. Table 2 illustrates the list of the phase differences through the mea-surement and the calculation. The measured phases were in good agreement with the calculation except for the port 3. Since the patch antenna was fixed only with SMA ca-bling in the setting of PAPA, port 3 would be misaligned because of gravity while conducting the experiment. The proper fixtures for PAPA are required in our future works.
Consequently, the location of ES can be properly iden-tified through 2D image reconstruction with the prototype PAPA. The proof-of-principle of the prototype PAPA was successfully shown, proving that the 2D image reconstruc-tion with multi-element PAPA is feasible.