Research Article
An
E
ffi
cient
Technique
for
Network
Tra
ffi
c
Summarization
using
Multiview
Clustering
and
Statistical
Sampling
Mohiuddin
Ahmed
1,*,
Abdun
Naser
Mahmood
1and
Michael
J.
Maher
1 1SchoolofEngineeringandInformationTechnology,UNSWCanberra,AustraliaAbstract
Thereissignificantinterestinthedataminingandnetworkmanagementcommunitiestoefficientlyanalyse huge amounts of network traffic, given the amount of network traffic generated even in small networks. Summarizationisaprimarydataminingtaskforgeneratingaconciseyetinformativesummaryofthegiven dataand itis aresearch challenge tocreate summaryfromnetworktraffic data.Existingclustering based summarizationtechniqueslackthe abilitytocreate asuitable summaryforfurtherdataminingtaskssuch asanomalydetectionandrequirethesummarysizeasanexternalinput.Additionally,forcomplexandhigh dimensionalnetworktrafficdatasets,thereisoftennosingleclusteringsolutionthatexplainsthestructureof thegivendata.Inthispaper,weinvestigatetheuseofmultiviewclusteringtocreateameaningfulsummary usingoriginaldatainstancesfromnetworktrafficdatainanefficientmanner.Wedevelopamathematically soundapproachtoselectthesummarysizeusingasamplingtechnique.Wecompareourproposedapproach withregularclusteringbasedsummarizationincorporatingthesummarysizecalculationmethodandrandom approach.Wevalidateourproposedapproachusingthebenchmarknetworktrafficdatasetand state-of-the-artsummaryevaluationmetrics.
Keywords:ScalableDataMining,NetworkTrafficSummarization,MultiviewClustering.
Received on 15 March 2015, accepted on 24 March 2015, published on 02 July 2015
Copyright © 2015 M. Ahmed et al., licensed to ICST. This is an open access article distributed under the terms of the Creative Commons Attribution licence (http://creativecommons.org/licenses/by/3.0/), which permits unlimited use, distribution and reproduction in any medium so long as the original work is properly cited.
doi:10.4108/sis.2.5.e4
1.
Introduction
Summarizationisconsidereda keyknowledge discov-ery approachthat producesa concise, yetinformative version of the original dataset[1]. Clustering, which groupstogethersimilardatainstances,isoftenusedfor summarization[2–6]. Amongthelarge poolof cluster-ingalgorithms[7], k-means[8]clusteringhasbeenwidely usedsinceitiseasytoimplementandunderstand.The resultingclustercentroidsareconsideredthesummary of theoriginaldata.However,k-means introduces sev-eralproblemsintermsofsummarizingadataset.First, thek-means algorithmgeneratesa centroidcalculating themeanof thedatainstanceswithinacluster,which in general is not an actual member of the dataset. A summaryproducedusingthesecentroidsmightbe mis-leading. Another important problem for summariza-tionusingunsupervisedtechniquesonunlabelleddata is that the number of clusters is generally unknown. Importantly,traditionalclusteringtechniquesfocuson
∗Corresponding author. Email:
mohiud-producingonlyasinglesolution,eventhoughmultiple alternate clustering may exist. It is thus difficult for the user to validate whether the given solution is in factappropriate,particularlyifthedatasetislargeand highdimensional(suchasnetworktraffic),oriftheuser has limitedknowledge aboutthe clusteringalgorithm beingused.Inthiscase,itishighlydesirabletoprovide alternativeclusteringsolution,whichisabletoextract more information about the underlying pattern from differentdimensionsofthedataset.
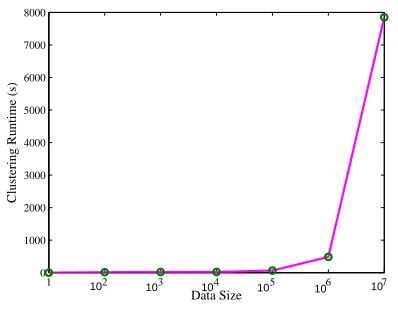
Figure 1 shows the run time complexity of basic
k-means[8] clustering algorithm on different sizes of data. It is clearly visible that, as data size increases the run time complexity also increases. As a result, knowledge discovery from large datasets becomes very inefficient. Consequently, summarization is a necessary step before performing data mining (such asanomalydetectionfromnetworktraffic),which can expedite the process of knowledge discovery. Existing summarization techniquesbased onclustering do not produce a summary that can be used for anomaly detection[9, 10] because of not using original data
1 2 3 4 5 6 7 0
1000 2000 3000 4000 5000 6000 7000 8000
Data Size
Clustering Runtime (s)
10 10 10 10 10 10
Figure 1. Run Time Complexity
instances. So, summarization using original data instances is important for further data mining and knowledge discovery process.
Rest of the paper contains the related works in Section 2, analysis of network traffic as complex data in Section 3. The theoretical background on multiview clustering and sampling techniques are discussed in Section 4. We discuss our proposed approach in Section 5 and experimental results in Section 6. Section 7 concludes the paper.
2.
Related Works
In this Section, we briefly review the existing clustering based summarization approaches. Although, there are different approaches of data summarization, the clustering based summarization approaches fall within the scope of this paper.
Ha-Thuc et al[3] proposed a quality-threshold data summarization method modifying the k-means
algorithm. The number of clusters is determined using the characteristics of dataset and a threshold. The algorithm partitions a dataset until the distortion or sum of squared error(2)(SSE) is less than a given threshold. It starts by finding the cluster centroids as
k-means but next steps are executed only if the SSE is above the given threshold and the existing cluster is split. A new cluster centroid is introduced which is closer to the larger cluster centroid. This process is repeated until all the clusters’ SSE exceeds the given threshold. They did not explain the method to choose the threshold and how the characteristics of datasets are analysed.
SSE = k
X
i=1
X
Ci
d(ci, x)2; x∈Ci and ci :centroid of Ci
Patrick et al[4] proposed a distributed clustering framework, where the dataset is partitioned between several sites and output is mixture of gaussian models. Each distributed dataset is summarized usingk-means
algorithm and sent to a central site for global clustering.
Prodip et al[5] proposed an approach for clustering large datasets by randomly dividing the original data into disjoint subsets. Thek-means algorithm is applied to summarize the dataset as well as to form ensemble using the centroids.
Wagstaff et al[2] presented a semi-supervised sum-marization approach for hyperspectral images. Hyper-spectral images produce very large image in which each pixel is recorded at hundreds or thousands of diff er-ent wavelengths. The ability to automatically generate summaries of these dataset enables important applica-tions such as quickly browsing through a large image repository. However, this technique uses pre-specified knowledge to seed the initial centre for clustering which is not directly applicable in different domains.
Figure 2. A common network architecture, adapted from Internet
3.
Network Tra
ffi
c as Complex Data
Network traffic can be considered as complex data where the straightforward data mining applications may not be effective. Data comes from more than one process. Each entry in the dataset is usually not only the outcome of a single characteristic; but also the combination different process. For example, in
2
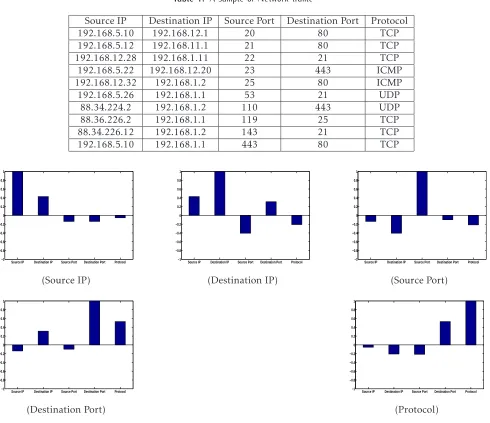
Table 1. A sample of Network traffic
Source IP Destination IP Source Port Destination Port Protocol
192.168.5.10 192.168.12.1 20 80 TCP
192.168.5.12 192.168.11.1 21 80 TCP
192.168.12.28 192.168.1.11 22 21 TCP
192.168.5.22 192.168.12.20 23 443 ICMP
192.168.12.32 192.168.1.2 25 80 ICMP
192.168.5.26 192.168.1.1 53 21 UDP
88.34.224.2 192.168.1.2 110 443 UDP
88.36.226.2 192.168.1.1 119 25 TCP
88.34.226.12 192.168.1.2 143 21 TCP
192.168.5.10 192.168.1.1 443 80 TCP
Source IP Destination IP Source Port Destination Port Protocol −1
−0.8 −0.6 −0.4 −0.2 0 0.2 0.4 0.6 0.8 1
(Source IP)
Source IP Destination IP Source Port Destination Port Protocol −1
−0.8 −0.6 −0.4 −0.2 0 0.2 0.4 0.6 0.8 1
(Destination IP)
Source IP Destination IP Source Port Destination Port Protocol −1
−0.8 −0.6 −0.4 −0.2 0 0.2 0.4 0.6 0.8 1
(Source Port)
Source IP Destination IP Source Port Destination Port Protocol −1
−0.8 −0.6 −0.4 −0.2 0 0.2 0.4 0.6 0.8 1
(Destination Port)
Source IP Destination IP Source Port Destination Port Protocol −1
−0.8 −0.6 −0.4 −0.2 0 0.2 0.4 0.6 0.8 1
(Protocol)
Figure 3. Correlation among the network traffic attributes
benchmark KDD Cup 99 dataset[11] has four different attribute types as follows:
• Basic:These features are corresponds to fields in
the network packet headers and session timeouts. These are useful for detecting attacks which target protocol and service vulnerabilities.
• Time: These are important for identifying high
volume fast rate DoS attacks based on the number of connections requests to the same destination host or service in a very short time frame.
• Host: These features store the number of
connections to the same host, port or service by a destination host in the last 100 connections. They are useful for identifying Probe attacks.
• Content:These are based on domain knowledge.
Important for detecting stealthy attacks (U2R, R2L) by observing the payload section of the packets.
The relationship among these attributes is not always significant. Also the network traffic as complex data has the following
Network computer devices that originate, route and terminate the data are called network nodes. Nodes can include hosts such as personal comput-ers, phones, servers as well as networking hard-ware. Two such devices are said to be networked together when one device is able to exchange information with the other device, whether or not they have a direct connection to each other. Computer networks support applications such as access to the World Wide Web, shared use of application and storage servers, printers, and fax machines, and use of email and instant messag-ing applications. Computer networks differ in the physical media used to transmit their signals, the communications protocols to organize network traffic, the network’s size, topology and organi-zational intent. So, the network traffic data is suppose to be complex data based on these facts.
• Data has multiple causes. The relationship among the attributes and between each attribute are subtle and some attributes are predictive only for some records. For example, in Table 1, we display a sample of network traffic instances and Figure 3 shows the correlation (1) among the different network attributes. In equation(1), x, y are the means of the variables X,Y. More over, network traffic dataset contains mixed attributes (such as numerical, categorical) and thus the relationship among the attributes are quite insignificant.
Correl(X, Y) =
P
(x−x)(y−y)
pP
(x−x)2 P
(y−y)2 (1)
4.
Theoretical Background
In this section, we provide a brief discussion on multiview clustering followed by sampling techniques and calculation of sample size.
4.1.
Multiview Clustering
Exploratory data analysis aims to identify and generate multiple views of the structure within a dataset. Conventional clustering techniques[7], however, are designed to only provide a single grouping or clustering of a dataset. Data clustering is challenging, because there is no universal definition of it. Labelled data is generally not available that may help in the understanding of the underlying structure of the data, moreover, there is no unique similarity measure for differentiating clusters. Consequently, it is evident that there is no single clustering solution that explains the structure of a given dataset, especially if it is large (such as network traffic) and represented in a high dimensional space. This challenge has given rise to the recently emerging area of multiview clustering
Figure 4. Two alternative clusterings of the same dataset, each with 3 clusters. Point shapes show cluster membership, adapted from[12].
analysis[13], where the goal is to explore different partitions, in order to describe different grouping aspects for a given dataset.
For example, consider the data given in Figure 4 and assume the number of clusters to be uncovered is 3. It is clear that both of the clustering solutions found in two Figures 4a and 4b are equally valid and logical, since they fit the data well and have the same clustering quality. It would be difficult to justify keeping only the first clustering, while omitting the second. We can also identify similar examples in real life applications. For example, in network traffic analysis, one can cluster traffic instances by their basic attributes; or content attributes, both clustering solutions are equally important and each could be used to provide a different interpretation of the data. In this paper, we study the application of multiview clustering on summarization of large and high dimensional data.
The multiview clustering problem can be formulated using the information theoretic concepts. For example, if we are given a dataset X with N points, such asX
= (x1, x2, ..., xN), the task is to find a set of alternative clustering solutions,C= (c1, c2...), where the clustering
quality in terms of an objective function will be high and simultaneously the clustering solutions will be highly dissimilar to one another i.e. mutual information
I(c1;c2)is close to zero andc1,c2.
4.2.
Sampling Methods
The rationale behind integrating sampling methods into summarization is based on the need to construct a summary from original data instances. Sampling is a popular choice for reduction of input data in data mining and machine learning techniques. It has been applied in various aspects of network management, such as traffic measurement and reporting, traffic char-acterization and intrusion detection[14]. The principal
4
advantages of sampling over the complete enumeration are the reduced cost and greater speed[18]. There are different kinds of sampling in practice. We briefly dis-cuss three major categories of sampling and choose the appropriate sampling for our proposed summarization algorithm.
• Simple Random Sampling:Given the dataset size
N and sample size n, simple random sampling chooses sample at random from the Nn
distinct possible samples, where no data instance is included more than once.
• Stratified Random Sampling:Here the dataset of
size N is divided into non-overlapping subsets. These subsets are called strata. The sampling scheme selects a random element from eachstrata
and produces a stratified sample. Basically, a simple random sampling is applied on eachstrata
to have a stratified random sample.
• Systematic Sampling: This method of sampling
is quite different from the other two. Here a data instance is sampled from the dataset, beginning from a specified starting point to the end, at equal intervals. To select a sample of n units, the first kunit is taken at random and every kth unit afterwards. If the first random unit number is 2 and the value of k=5, then for sample of size 3, the sample units will be of number 2,7,12 respectively. Here the kis calculated asN /n, and for fractions it is rounded up.
For the network traffic summarization purpose, systematic sampling is advantageous over the other two because it involves choosing the data instances to be sampled at equal intervals. However, it can suffer from periodicity of the data but we address the issue by using clustering. It is an efficient sampling scheme for our purposed technique because, we think of choosing the samples from the clusters produced from the original dataset. Since, the clustering process groups together the similar data instances, the systematic sampling scheme will encompass the total cluster and be able to represent the cluster well. Additionally, this technique results better when the sample size is known and we plan to calculate the sample size of the produced cluster using statistical formula.
Sample size determination is a very important issue because a large sample size is a wastage of time and resource; on the other hand a smaller sample may lead to faulty results[18]. Since, we are interested in identifying the summary size automatically without user input, calculation of sample size from the produced clusters is a necessary step. In this scenario, sample mean and the original dataset mean is different and this difference is considered as an error. The margin
of error E is the maximum difference between the sample mean and the actual dataset mean. According to statistical view point[19], this errorE, can be defined using the following equation(2).
E=zα/2∗
σ
√
n (2)
• zα/2is the critical value,αis the significance level.
A positivezvalue corresponds to the area ofα/2 in the right tail of standard normal distribution;
• σis the dataset standard deviation;
• nis the sample size;
• E is the margin of error, difference between the sample mean and original dataset’s mean.
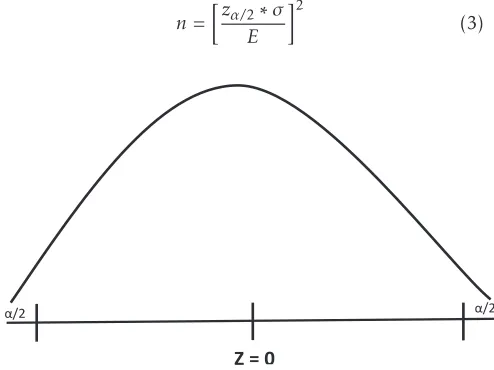
After rearranging the above formula, the sample size (summary size) can be calculated(3)
n=
zα/
2∗σ
E
2
(3)
Z = 0
α/2
α/2
Figure 5. Critical value of the Standard Normal Distribution
5.
Proposed Multiview Clustering based
Network Tra
ffi
c Summary
In this Section, we describe our proposed method for network traffic summarization. At first we present the regular clustering based technique for summarization incorporating the summary size calculation. Then we explain our algorithm based on multiview clustering.
ALGORITHM 1: RCNTS(Regular Clustering based Net-work Traffic Summarization)
Input :D, Dataset;
k, number of clusters
Output:S, The summary ofD
Begin
{C1, C2, ....Cn}←k-means(D,k) foreach clusterCi, i = 1:ndo
Calculate the summary size (3)
Si =Systematic SampleofCi
end
S=Sn
1 |Si|
End
a systematic sample (discussed in previous section 4.2) from the cluster. Finally, we merge all the systematic samples from all the clusters produced to create the final summary. This approach does not require any external input and overcomes the problems with the existing summarization techniques where the sample size and the representation of original data in the summary are the main constraints. However, for high dimensional and complex network traffic, regular clustering may not discover the underlying pattern effectively. Next, we present our proposed methodology based on multiview clustering.
ALGORITHM 2:Multiview Clustering of Network Traffic
Input :D, Dataset
Output:Cn, Clusters from Multiview Clustering
Begin
Classify the dataset according to different attribute types For Network Traffic,Di={DHost, DBasic, DT ime, DContent} fori = 1:4do
{c1, c2} ←k-means(Di,2) end
Cn=S21i|ci|
End
ALGORITHM 3: MCNTS(Multiview Clustering based
Network Traffic Summarization)
Input :D, Dataset
Output:S, The summary ofD
Begin
{C1, C2, ....Cn} ←Multiview Clustering(D) foreach clusterCi, i = 1:ndo
Calculate the summary size (3)
Si =Systematic SampleofCi end
S=Sn
1 |Si|
End
In theAlgorithm 2, the multiview clustering process for network traffic is given. As discussed in Section 3, the network traffic dataset considered in the scope of
this paper has four kinds of attributes. So, for multiview clustering, we separated each of the attribute category and applied partitional clustering on them. The essence of multiview here is the application of partitional clustering on different types of attributes of the same dataset. It is expected that clustering different attribute types will result in different clustering solution. Also, we chose the number of cluster as two based on the assumption made by Portnoy et al[17], ‘The majority of the network connections are normal traffic, only a small percentage of traffic are malicious’. As a result, from four different types of attributes in the dataset, eight different clusters are produced. These clusters are the result of multiview clustering as well as applying partitional clustering on different types of attributes such asBasic, Time, Host, Content.
Next, we present our proposed approach for network traffic summarization in Algorithm 3. Once the multiview clustering (Algorithm 2) is applied and the resulting clusters are ready, from each of the clusters, we calculate the sample/summary size using the statistical theories discussed in previous Section 4.2. Once the summary size of the cluster is calculated, we take representative sample from the cluster having original data instances using systematic sampling. The representative sample has the minimum difference between the cluster centroid and mean of the selected sample. Finally, we merge all the representative samples from all the clustering solutions produced to create the final summary. Our proposed approach overcomes the problems with the existing summarization techniques where the sample size and the representation of original data in the summary are the main constraints. Additionally, the summary produced by our approach can be used as an input to anomaly detection techniques.
6.
Experimental Analysis
For our experimental analysis, we used a variant of benchmark KDD cup 1999 dataset. NSL-KDD dataset[11] is a short form KDD cup 1999 which is derived from DARPA 1998 data from Licoln Laboratory at MIT. KDD 1999 is the most widely utilized dataset for the evaluation of the anomaly detection methods on network traffic. NSL-KDD is a dataset suggested to solve some of the inherent problems of the KDD 1999 dataset as mentioned in[16]. For sample/summary size calculation, we considered 95% significance level which corresponds toα = 0.05 andzα/2 = 0.475. In the
table of standard normal distribution, an area of 0.475 corresponds to azvalue of 1.96[20]. Thus, we usedzα/2
= 1.96 in our experimental analysis andE= 1.
6 EAI Endorsed Transactions on Scalable Information Systems
Table 2. A Summary of the dataset in Table 1
Source IP Destination IP Source Port Destination Port Protocol
192.168.12.32 192.168.1.1 53 443 TCP
6.1.
Summarization Metrics
To simplify the understanding of a good network traffic summary, here in this section we explain the existing summary evaluation metrics [15]. Additionally, we also discuss two of our proposed metrics for network traffic summary evaluation hinted beforehand. First we discuss the existing metrics as follows
• Conciseness:Conciseness expresses how compact
a summary is with respect to the original dataset. It is the ratio of input dataset size and the summarized dataset size. Then conciseness is represented in equation (4), where N is the number of data instances in input dataset and S
denotes the number of data instances in summary. For example, the conciseness of the summary (Table 2) of the dataset in Table 1 is 101 = 10.
Conciseness= N
S (4)
• Information Loss: A general metric used to
describe the amount of information lost from the original dataset as a result of the summarization. Loss is defined as the ratios of number of cells not present by cells present in the summary [15]. Equation (5) states the information loss, where Ti is the number of unique cells represented by summaryiandLi defines the number of cells not present in summary i. For example, information loss of summary in Table 2, whereLi = 25 andTi = 30. So, the information loss of summary in Table 2 will be 2730 = 0.90.
Information Loss= Li Ti
(5)
• Interestingness: It is a new summarization
metric proposed in [15] which focuses on the objective measures of interestingness with applicability to summarization, emphasizing diversity. Equation (6) defines the interestingness, whereni states how many of the data instances in the original dataset are covered by the summary
i, m is the number of individual summaries and N is the total number of data instances in original dataset. For example, the interestingness of summary in Table 2 is (10(10(1(1−−1))1)) = 0. Since, the original data has 10 data instances and the summary has one data instance, so the 1 tuple in
summary represents 10 data points of the original data in Table 1.
Interestingness=
Pm
i=1ni(ni−1)
N(N−1) (6)
• Intelligibility: This metric is used to measure
how meaningful a summary is, based on the attributes present in the summary. Intelligibility is defined and displayed in equation (7), where
m is the number of summary, ai is the number of attributes present in the original dataset that is covered by summary i and qi is the number of attributes present in the summary i. The intelligibility of summary in Table 2 is 1155 = 1.0. The term attribute here in case of Table 1 means the Source IP, Destination IP, Source Port, Destination Port, Protocol.
Intelligibility= 1 m
m
X
i=1
qi ai
(7)
Summary size is considered as a constraint in sum-marization algorithms. Summary size, which defines conciseness is an important metric and has influence on the other metrics. When the summary is empty it has maximum information loss and when conciseness is 1 meaning the summary contains the whole dataset has no information loss.
6.2.
Discussion on Experimental Results
Table 3. Multiview Clustering Results
Dataset Basic Host Time Content
Cluster-1 32.47% 55.57% 24.76% 39.48%
Cluster-2 67.53% 44.43% 75.24% 60.52%
Table 4. Regular Clustering Results
Dataset Number of Instances
Cluster-1 35.06%
Basic Time Host Content 0
10 20 30 40 50 60 70 80 90 100
% of Data
Cluster−1 Cluster−2
(Normal Data Distribution)
Basic Time Host Content
0 10 20 30 40 50 60 70 80 90 100
% of Data
Cluster−1 Cluster−2
(Anomalous Data Distribution)
Figure 6. Data distribution of multiview clustering
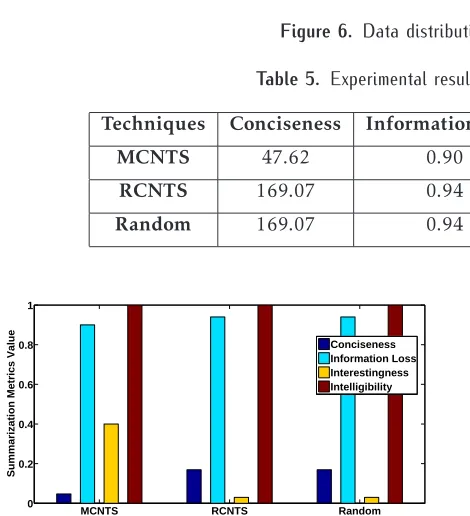
Table 5. Experimental results of theMCNTSalgorithm
Techniques Conciseness Information Loss Interestingness Intelligibility
MCNTS 47.62 0.90 0.04 1.0
RCNTS 169.07 0.94 0.003 1.0
Random 169.07 0.94 0.003 1.0
MCNTS RCNTS Random 0
0.2 0.4 0.6 0.8 1
Summarization Metrics Value
Conciseness Information Loss Interestingness Intelligibility
Figure 7. Comparison among the summarization techniques
Table 3 displays the clustering solutions over different views (on different attribute types). It is clearly visible that the multiview clustering (k-meanson different attribute types of the given dataset) produces different clustering results. Figure 6 displays the data distribution of multiview clustering solutions. For each of the attribute type of network traffic, the clustering solution reflects a different data assignment. For example, the basic attributes clustering shows that, cluster 1 contains almost no normal traffic instances, whereas the content attributes clustering yields 70% normal traffic instances in cluster 1. This scenario is also visible in case of the anomalous traffic instances, each of the attribute types yield different clustering solutions. Table 4 contains the clustering solution of regulark-means algorithm, which means clustering on the dataset considering all the attributes types together
and that is why the Table 3 and Table 4 is different.
In Table 5, we show the comparison with two other approaches. Regular clustering based approach performs basick-meansand creates two clusters because underlying data has normal and attack data instances. Once the clustering is done, the summary size is calculated according to the methodology discussed in Section 4.2. We applied the sampling technique on regular clustering to compare with our proposed approach. Another approach is based on random scenario, which chooses summary data instances randomly to see whether our proposed technique is actually better than the existing ones. It is clearly stated in Table 5, that our approach has less information loss than the other approaches. The proposed method did not outperform others in terms of conciseness because of the merging of summaries from four different clustering solutions, whereas, the other approaches consider only one clustering solution. Since, all the attributes are present in the summary, intelligibility is equal in all case and interestingness also suggests that our approach is better. The regular clustering approach and random approach results are similar, because both the approaches were clustered in same way. Although, there should be a difference in information loss, however due to the same size of summary and the instances picked might resulted in the similar information loss. Figure 7 showcases the evaluation among the summarization techniques based on the metrics discussed earlier (scaled 0 to 1).
8 EAI Endorsed Transactions on Scalable Information Systems
7.
Conclusion
In this paper, we addressed two major drawbacks of the existing clustering based summarization techniques. Summary size estimation and representing original data instances in the summary without losing any attribute are the key focus of this paper. Additionally, instead of using regular clustering algorithm for summarization, we use multiview clustering which is theoretically sound and more informative in nature for summarization. Our proposed algorithm uses sampling method pick original data instances to be added in the summary and statistical measure is used to calculate the sample size. Experimental analysis used the state-of-the-art evaluation metrics for summarization. In future, we will focus on real-time network traffic summarization.
References
[1] V. Chandola and V. Kumar, “Summarization- compressing data into an informative representation,”Knowl. Inf. Syst., vol. 12, no. 3, pp. 355–378, Aug. 2007.
[2] L. Wagstaff, P. Shu, D. Mazzoni, and R. Castano, “Semi-supervised data summarization: using spectral libraries to improve hyperspectral clustering,” in The Interplanetary Network Progress Report, vol. 42, 2005.
[3] V. Ha-Thuc, D.-C. Nguyen, and P. Srinivasan, “A quality-threshold data summarization algorithm.” inRIVF. IEEE, 2008, pp. 240–246.
[4] P. Wendel, M. Ghanem, and Y. Guo, “Scalable clustering on the data grid,” in 5th IEEE International Symposium Cluster Computing and the Grid (CCGrid), 2005.
[5] P. More and L. Hall, “Scalable clustering: a distributed approach,” inFuzzy Systems, 2004. Proceedings. 2004 IEEE International Conference on, vol. 1, 2004, pp. 143–148 vol.1. [6] M. Ahmed and A. Mahmood, “Clustering based semantic data summarization technique: A new approach,” in
Industrial Electronics and Applications (ICIEA), 2014 IEEE 9th Conference on, June 2014, pp. 1780–1785.
[7] A. K. Jain, M. N. Murty, and P. J. Flynn, “Data clustering: A review,”ACM Comput. Surv., vol. 31, no. 3, pp. 264–323, Sep. 1999.
[8] J. B. MacQueen, “Some methods for classification and analysis of multivariate observations,” in Proc. of the fifth Berkeley Symposium on Mathematical Statistics and Probability, L. M. L. Cam and J. Neyman, Eds., vol. 1. University of California Press, 1967, pp. 281–297.
[9] M. Ahmed, A. N. Mahmood, and M. R. Islam, “A survey of anomaly detection techniques in financial domain,”Future Generation Computer Systems, 2015.
[10] M. Ahmed, A. Mahmood, J. Hu, “Outlier detection",in The State of the Art in Intrusion Prevention and Detection, CRC Press, USA, pp. 3–23, Jan. 2014.
[11] “NSL-KDD Datasett,” accessed: 2014-06-10. [Online]. Available:http://nsl.cs.unb.ca/NSL-KDD/
[12] X. H. Dang and J. Bailey, “Generation of alternative clusterings using the cami approach,” inSDM’10, 2010, pp. 118–129.
[13] X. Dang and J. Bailey, “A framework to uncover multiple alternative clusterings,”Machine Learning, pp. 1–24, 2013. [14] A. Mahmood, C. Leckie, R. Islam, and Z. Tari, “Hierarchical summarization techniques for network traffic,” inIndustrial Electronics and Applications (ICIEA),
2011 6th IEEE Conference on, 2011, pp. 2474–2479. [15] D. Hoplaros, Z. Tari, and I. Khalil, “Data summarization
for network traffic monitoring,” Journal of Network and
Computer Applications, vol. 37, no. 0, pp. 194 – 205, 2014. [16] Testing intrusion detection systems: A critique of
the 1998 and 1999 darpa intrusion detection system evaluations as performed by lincoln laboratory, ACM Trans. Inf. Syst. Secur. 3 (4) (2000) 262–294.
[17] L. Portnoy, E. Eskin, S. Stolfo, Intrusion detection with unlabeled data using clustering, in: In Proceedings of ACM CSS Workshop on Data Mining Applied to Security (DMSA-2001, (DMSA-2001, pp. 5–8.
[18] W. Cochran, “Sampling Techniques.” John Wiley and Sons, Inc.
[19] M. Walpole, “Fundamentals of Probability and Statis-tics.” Prentice Hall.
![Figure 4. Two alternative clusterings of the same dataset, eachwith 3 clusters. Point shapes show cluster membership, adaptedfrom[12].](https://thumb-us.123doks.com/thumbv2/123dok_us/8428312.1696815/4.595.310.549.95.220/figure-alternative-clusterings-dataset-eachwith-clusters-membership-adaptedfrom.webp)