75
Volume LIX 11 Number 2, 2011
TIME SERIES CLUSTERING IN LARGE DATA SETS
J. Fejfar, J. Šťastný
Received: December 17, 2010
Abstract
FEJFAR, J., ŠŤASTNÝ, J.: Time series clustering in large data sets. Acta univ. agric. et silvic. Mendel. Brun., 2011, LIX, No. 2, pp. 75–80
The clustering of time series is a widely researched area. There are many methods for dealing with this task. We are actually using theSelf-organizing map (SOM) with the unsupervised learning algorithm for clustering of time series.
A er the fi rst experiment (Fejfar, Weinlichová, Šťastný, 2009) it seems that the whole concept of the clustering algorithm is correct but that we have to perform time series clustering on much larger data-set to obtain more accurate results and to fi nd the correlationbetween confi gured parameters and re-sults more precisely. The second requirement arose in a need for a well-defi ned evaluation of rere-sults. It seems useful to use sound recordings as instances of time series again. There are many recordings to use in digital libraries, many interesting features and patterns can be found in this area. We are search-ing for recordsearch-ings with the similar development of information density in this experiment. It can be used for musical form investigation, cover songs detection and many others applications.
The objective of the presented paper is to compare clustering results made with diff erent parameters of feature vectors and the SOM itself. We are describing time series in a simplistic way evaluating stan-dard deviations for separated parts of recordings. The resulting feature vectors are clustered with the SOM in batch training mode with diff erent topologies varying from few neurons to large maps. There are other algorithms discussed, usable for fi nding similarities between time series and fi nally conclusions for further research are presented. We also present anoverview of therelated actual lit-erature and projects.
time series, self-organizing map, clustering
Many objects that we are observing change them-selves in time. When we measure properties of these objects we obtain time series – values caught sequentially in time (Wei, Keogh, 2006). This is the reason why time series information retrieving isso important. We are investigating time series in many disciplines including economy, medicine, natural science, engineering, music etc.
Basically, we are investigating two types of tasks on time series: prediction and classifi cation / cluster-ing. There are many problems asneed for querying large databases of time series, subjectivity of simi-larity of time series, data handling problems: sample rates, data formats, missing values. We have plenty of methods for dealing with these problems. In the classifi cation and prediction area we are focusing on the promising concept using artifi cial neural
net-works (ANN). This area is not yet described in all its parts and consequences. Our results in the predic-tion of economical time series using ANN are pre-sented in the paper (Štencl, Šťastný, 2009).
using semi-supervised time series (electrocardio-grams, handwritten documents, manufacturing, and video datasets) classifi cation (Wei, Keogh, 2006).
We are using a simplistic signal processing method dividing the signal into n parts calculating a standard deviation for each part, which results into the n-dimensional feature vector for each record-ing. These feature vectors can be seen as a time se-ries. From the musical point of view they represent information density of amusical piece evolving in the time. This can be used as a musical form descrip-tor as shows the paper (Fejfar, Weinlichová, Šťastný, 2010). A related work searching information dynam-ics is in the paper (Abdallah, 2007).
A erwards we perform these feature vectors nor-malization in the way they vary from −1 to 1. These normalized feature vectors are clustered with the Self-organizing map (Kohonen, 2001).
The resulting clusters are evaluated with the av-erage Euclidian distance of the observations from the mean of the cluster. At fi rst the average vector is counted for each neuron as a mean of the cluster
RESULTS AND DISCUSSION
There are three parameters that have to be set in this experiment: the number of dimensions in a fea-ture vector, thenumber of neurons in theSOM and the number of learning process iterations. We inves-tigate the infl uenceof these parameters on cluster-ing results.
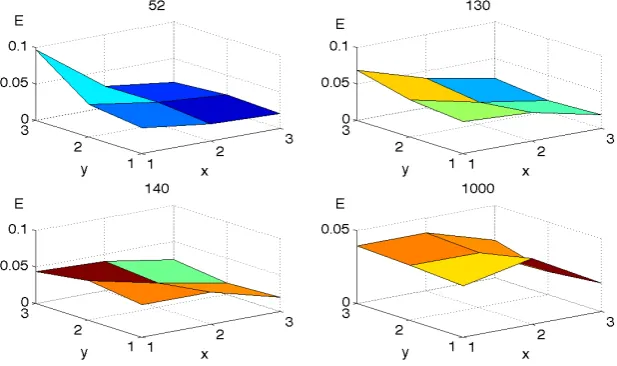
The fi rst decision in our experiment was to set the number of dimensions in a feature vector and the number of neurons in the SOM. We tried 2 diff er-ent possibilities for each parameter: a small feature vector having 3 dimensions and a larger one with 10 dimensions. For the SOM we experimented with 9 neurons and for the larger one with 100 neurons. Our results can be seen in following fi gures.
Fig. 1. shows 3 x 3 topology of the SOM clustering 3 dimensional feature vectors. The number of itera-tions is varying from 52 to 1000. It is interesting that the evolution of the error level is not continuous but rather it is changing signifi cantly around some val-ues of iterations. From 1 to 51 iterations algorithm performs an initial phase, few neurons represent
2: Network error, 10 x 10, 3D feature vector
3: Network error, 3 x 3, 10D feature vector
5: Network error, 10 x 10, 10D feature vector, 3000 iterations, normalization
6: Observation 1 and 2 of neuron 61 (the smallest error)
most all observations. Error level decreases rapidly around the 52nd iteration and between 130th and 140th iteration. We thing, that these breaks repsents local extremes overcoming. A er that it re-mains at the same level.
Fig. 2. shows the same experiment with a 3 dimen-sional vector but with 10 x 10 topology. It can be seen that error level is approximately on the same level, but clustering is smoother. Another fact is that unused neurons appear there – the white fi elds. Those neurons classifi ed nothing or only one obser-vation (recording), so our error value determination has no meaning there.
Fig. 3. shows a10 dimensional vector with 3 x 3 topology and fi nally Fig. 4. shows a 10 dimensional feature vector with 10 x 10 neurons topology.
For our purpose the most interesting option is 10 x 10 neurons with the 10 dimensional feature vector with 2000 of learning iterations. There we can ob-serve several natural clusters, which grew out from the data independently on number of neurons. This is diff erent from the previous 3 x 3 topology (forced 9 classes) and also diff erent from the popular clus-tering algorithm k-means where we have to set the number of classes.
We can examine the resulting map deeply. In Fig. 5. we can see anetwork error when clustering normalized feature vectors. Fig. 6. shows the fi rst two observations classifi ed by the best neuron num-ber 61.
Fig. 7. shows the fi rst two observations of neuron 96 which is situated in a detached group of neurons. A diff erent type of time series appears here.
SUMMARY
This paper describes our experiment in the unsupervised clustering of a large time series database. It contains 1024 clips of audio recordings. Time series (feature vectors) are produced from these clips using asimplistic signal processing method. The infl uence of a time series dimensionality together with thenumber of neurons in the SOM is discussed. A network error based on the average Euclid-ian distance of observations from the mean of the cluster is evaluated and visualized for 4 confi gura-tions combining two types of the feature vector and two types of the SOM. It is shown that for cluster-ing is the most interestcluster-ing option a 10 dimensional feature vector clustered with a large SOM. There is performed normalization of feature vectors and results of clustering a er 3000 learning iterations in batch mode are presented. We are presenting two examples classifi ed by the best neuron with the smallest error and other two examples classifi ed by neuron adherent to a detached group of neurons. As we can see in the Fig. 6 and 7 the development of the standard deviation descriptor is similar for each pair of recordings. And also recordings in detached clusters are diff erent as we expected. This shows the usability of this algorithm for musical recordings clustering. Our research in time series clustering will continue in using supervised learning (LVQ) and semi-supervised learning in an eff ort to control the map layout.
This paper is supported by IGA project 64/2010.
REFERENCES
ABDALLAH, S. A., PLUMBLEY, M. D., 2007: Informa-tion Dynamics. Technical Report C4DM-TR07-01, Centre for Digital Music, Queen Mary University of London.
FEJFAR, J., WEINLICHOVÁ, J., ŠŤASTNÝ, J., 2010: Musical Form Retrieval. In: MENDEL 2010, 16th In-ternational Conference on So Computing. Brno: Brno University of Technology. ISSN 1803-3814. KOHONEN, T., 2001: Self-Organizing Maps. Secaucus,
NJ, USA: Springer-Verlag New York, Inc. ISBN 3540679219.
LAW, E., VON AHN, L., 2009: Input-agreement: A New Mechanism for Data Collection using Human
Computation Games. Proc. of CHI, Boston, Massa-chusetts, USA. ACM press 978-1-60558-247-4, pp. 1197-1206.
ŠTENCL, M., ŠŤASTNÝ, J., 2009: Advanced approach to numerical forecasting using artifi cial neural networks. Acta Universitatis agriculturae et silviculturae Mendelianae Brunensis, sv. 6, č. 2, pp. 297–304, ISSN 1211-8516.
WEI, L., KEOGH, E. J., 2006: Semi-supervised time series classifi cation. In: Proceedings of the Twel h ACM SIGKDD International Conference on Knowledge Discovery and Data Mining, Philadelphia, PA, USA. ISBN 1-59593-339-5.
Address