A PHYSIOLOGICAL ANALYSIS OF THE
CAUSES OF MOTTLING IN TWO
VARIETIES OF WHEAT*
BY R. D. ASANA AND R. K. SAHAYDivision of Botany, Indian Agricultural Research Institute, New Delhi-12
ONE of the desirable qualities of the wheat grain is its translucent (vitreous) appearance. A partially vitreous sample of grains may contain some grains which are opaque (starchy), the latter fraction being generally described as 'mottled'. The mottled fraction has low grain and test weight, with poor quality of gluten, low absorption of water by flour and is therefore not suitable for making 'chapati ', in which form wheat is mainly consumed in the Indo-Pakistan sub-continent (Aziz and Bhatti, 1962). Flinty or vitreous grains generally fetch about 20% higher price than mottled grains.
Varietal and environmental factors are known to influence mottling. Varietal differences in mottling have been shown to exist under condi-tions such as excess of soil moisture, infection with disease and nutri-tional unbalance (cf Aamodt and Torrie, 1935; Sallans and Simmonds, 1954; Lipsett, 1963). Application of nitrogen may reduce mottling by (i) increasing protein content of the grain (cf Graham, 1948; Bisset and Andrew, 1953) and (ii) improving quality of protein. Kaihara (1953) found that nitrogen increased gliadin and glutenin, but not leucosin and globulin in wheat grain, and improved the quality of
gluten.
According to Fisher and Jones (1933), mottling depends on the strength of gluten strands in the developing grain to withstand shrinkage and strain set up throughout the endosperm during dehydration which occurs during maturity. If the gluten strands withstand the strain until the grain has its normal moisture content, the kernel remains vitreous; otherwise minute cracks appear which give mottled appear-ance. A gluten may be too weak either because the strands are too few (due to insufficient quantity) or because they lack strength (due to poor quality).
A large body of data on the relation of nitrogen content of the ripe grain to degree of mottling is available in the literature. No attempt has been made, so far as the writers are aware, to examine the relation, if any, of mottling to the rate of accumulation of nitrogen
and dry matter in the developing grian of different varieties. It was believed that such a study might through some light on the causes of varietal differences in mottling. Two varieties of wheat (Triticum aestivum), NP 823 and NP 824, were chosen for this study as the grains of the latter are known occasionally to show a relatively greater degree of mottling. The results of a study of the effects of variation in nitro-gen and water supply during the post-anthesis period on the accumulation of dry matter and nitrogen in the grain, and on gluten content and mottling are reported in this paper.
ExPERIMENTAL PROCEDURE
The experiments were carried out during two wheat seasons, 1962-63 and 1963-64, in pot culture, in the open under natural condi-tions of light and temperature. Each glazed plot, used in the experi-ment, was 45 em. high and 22 em. in diameter. The soil for the pots was sandy-loam in texture and was collected from a fallow land. ln the 1962-63 season, about 0·5 kg. of well-rotted F.Y.M. was also added tG each pot. Twelve seeds were sown in each pot, but only six uni-form seedlings were retained after three weeks.
The time of sowing and the amounts of fertilizers given are indi-cated in Table I.
TABLE I
Time of sowing and doses of fertilizers applied per pot
Date of sowing .. ]
::ita~e at which fertilizers were
I
gtvenA week after germination .. :
I
Experiment I 1962-63
I 2-ll-1062
Nil
At commencement of tillering
1
, 2 gm. each d AS, SP, Ps :
At boot leaf stage . • ., I
I
,
Exqeriment II 1963-64
7-ll-1963
1 gm. each of calcium ammo-nium nitrate (CAN), super phosphate ( SP) and pot~.s
sium sulphate (PS)
"
--~---The other procedural details are given below experiment-wise.
88 R. D. ASANA AND R. K. SAHAY
Treatment Mode of Quantity of
urea applied symbol Water regime nitrogen
application per pot
WN0 Sufficient water supply (W)
WN1 " Foliar 2·2 gm. (1% urea solu-tion)
WN,
"
Soil 2·2gm.DNo Intermittent drought
(D)
DN, " Foliar 2 · 2 gm. (1% urea solu-tion)
DN,
"
Soil 2·2gm.Spray and soil applications were made twice, 7 and 14 days after an thesis respectively. Restricted watering (D) was given a week after anthesis occurred in 50% of the main shoots, the pots being watered when the leaves showed incipient wilting in the afternoon.
Of the 20 pots under each treatment, 10 were reserved for final grain yield and the other 10 were utilized for sampling on two occasions as indicated below. The main shoots alone were sampled.
Sample I: 14 days after anthesis (26-2-1963). Sample 1I: 28 days after anthesis (12-3-1963). Sample Ill: At maturity (early April, 1963).
Experiment Il.-There were 60 pots for each variety, 12 being allotted to each of the following 5 treatments:
Sl. Treatment Amount of ammonium sulphate
No. symbol applied per pot
1 No None after an thesis.
2 Ao Nl 1·72 gm. at 50% anthesis (in main shoots). 3 AoN2 5·16 gm. at 50% anthesis (in main shoots). 4 A1sN1 1·72gm. 15 days after an thesis (in main
shoots). ~
5 A1sN2 5 ·16 gm. 15 days after an thesis (in main shoots).
---·----.,
Of the 12 pots under each treatment, 6 were kept for final yield and the other 6 were utilized for the first two samples (3 each). For the third sample, one shoot each from the three yield pots was utilized for sampling. Dates of sampling were as
follows:-Sample I: On the 21st day from the mean date of anthesis (4th and 5th March for NP 824 and NP 823
respectively).
Sample II: When the ear just started yellowing, 29 to 33 days after anthesis, according to appropriate stage in the various treatments.
Sample III: When the ear just turned yellow, 33 to 37 days after an thesis, ·according to appropriate stage in the various treatment combinations.
Sample IV: At maturity.
The plant samples were harvested in the morning. The main shoots were cut off at the ground level and then separated into leaves, stem and ear. At anthesis four leaves including the flag leaf were retained on the shoot, as the lower leaves were more or less yellow at the time. The sampled material was dried in an oven at 80° C.
Estimate of mottling of grains.-A sample of grains was examined
on a glass plate supported over a mercury vapour lamp. Counts were made of mottled grains which showed dark patches inside them. The counts were made replicate-wise. As the mottled fraction of a grain sample was expressed on percentage basis, the data were converted to sin2& values with the help of conversion table of Bliss (1938) before
testing the significance of treatment effects by analysis of variance. For the statistical analysis of the other data of Experiment II, the treat-ments were divided into two groups, N0 and N. The variation due to varieties within N0 , due to interaction between N0 and the other N treatments, and due to individual factors and their interactions within nitrogen treatments were partitioned. Errors from the two groups were pooled and a joint estimate of the error variance was obtained.
Determination of gluten content.- Crude gluten of the powdered
grains was estimated by the kneading method (A.O.A.C.). EXPERIMENTAL RESULTS
The effect of nitrogen and water on mottling.-It may be noted
90 R. D. ASANA AND R. K. SAHAY
this effect increased with increase in nitrogen supply. (3) Application of nitrogen on the 15th day from anthesis was slightly more effective in decreasing mottling than that at anthesis, at an intermediate level of nitrogen supply. (4) The incidence of mottling was relatively higher in NP 824 than in NP 823 at lower levels of nitrogen supply.
Increase in dry weight of grains.-The data in Table III indicate
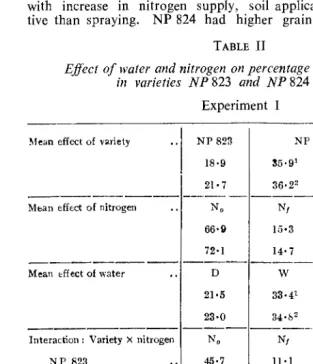
that grain weight per ear, as well as 1,000 grain weight, increased with increase in nitrogen supply, soil application being more effec-tive than spraying. NP 824 had higher grain weight per ear than
TABLE II
Effect of water and nitrogen on percentage of mottled grains in varieties NP 823 and NP 824
!If ean effect of variety
Mean effect of nitrogen
Experiment I
NP 823 18·9 21•7
NP 824 L,S.D. at 5% P
N,
66·9 15·3 o1 4·6
I
- - - _72·1 _ _ 14·7_[_0_
2
----~--Mean tffect of water D W ·
Interaction: Variety X nitrogen NP 823
NP 824 NP 823 NP 824
21•5 23•0
45·7 88·1 5'7·0
87·2
N,
0
I 02
i \) 8·0 14·6
4·4 3·1
Inte~;-w;;;~;.-x
nitrogen. ---;.-----N,-~·--;.-
-D 58•7 5·5 ot
w '75·1 25·2 0 5•9
D 65·0 4·1 02
w 79·3 25•2 0 5•6
]
Grains from tillers.
; I
"
TABLE II-(Contd.)
Experiment II (Main shoots)
I
91
M ' ~ n effect of variety • • 1 NP 823 NP 824 L.S.D. at 5% P
!
No 47•2 80·0
N1+N" .. , 7•5 26•6 5·8
· 1
-Mean dfect of nitrogen .. 1 N
0 N 1
+
N 2 ,I
17·0
N1 N2 f
I 33·5 0·5 i 5·8
________
,______
,___ _
Effect of time of application of nitrogen ••
1
Ao A15 i
---1-20·, _ _
13·5_, _ _~--l nteraction: '
Nitrogen X time of application ..
1
. A0 A15 I
N1 . . 40·3 26·8
N2
··1
0·8 0·3 8·1~~---~----~---.---Variety X nitrogen ..
1
N1 N2 ~
NP 823 .··.1 15·0 0·1
NP 124 52·1 1•0 8•1
I
! TABLE III
Effect of nitrogen and water on dry weight of grain in gm.
Sample
I
No. NoI
Nt N,
I 0·60 0·57 0·451
l l 1·93 1·93 2•ll
III 2·31 2•59 2·73
I ll·8 ll·O 10•!
II 38·0 36·6 40·5
III 46·3 49•4 51•9
2
Experiment I Mean effects of treatments
Grain weight/ear
L.S.D.'
w
I
D
I
L.S.D.l
5% p 5% p
N.S. 0·571 8·5i N.S. 0•09 1·97 2·02 N.S. 0•08 2•60 2·49 0•07
1,000 grain weight
l'<.S. ll·l 110·9 N.S.
I
2·2 38·8 38·1 N.S. 1·4 50·0 48·5 1·1
NP
I
8~4 8!3 NP
I
at L.S.D. 5%0·58 0·56 N.S. 2·07 1·93 0•07
2·63 2·46 6•07
10·0 12·1 N.S. 35·5 41·4 1•8
92 iC D. ASANA AND R. K. SAHA Y
NP 823, but the varietal position was reversed in respect of 1,000 grain weight. Water stress slightly depressed both grain weight per ear and 100 grain weight. It may be notEd that application of nitrogen slightly increased grain-setting and that NP 824 had a larger grain number than NP 823. The data of Experiment JI showed similar effects of nitrogen and varic:ty on grain development and have, therefore, not been presented.
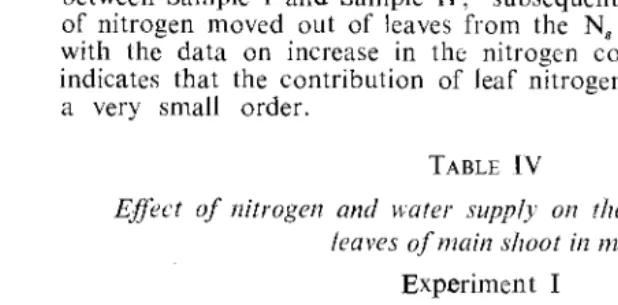
Nitrogen content of leaves on main shoot.-The nitrogen content of leaves from treatment N1 was not determined (except in one case)
because of chances of contamination from leaf-spray (Table IV). The nitrogen content was considerably higher in the N, trectment. Jt seems that the transfer of nitrogen from the N0 treatment was much faster
between Sample 1 and Sample l1; subsequently a substantial amount of nitrogen moved out of leaves from the N, treatment. Comparison with the data on increase in the nitrogen content of grains (Fig. I) indicates that the contribution of leaf nitrogen to grain nitrogen is of a very small order.
TABLE IV
Effect of nitrogen and water supply on the nitrogen content of ieaves of main shoot in mg.
Experiment I
Sample
I
NoI N,
I
L.S.D.w
I
D
I
'0;~·1
NP ' " NP 823 L.S.D.
No, 5o/oP at5%P
I I
I
7-91
II
I
..
IH 9·5 l•l 6·6 l•l 7·7 6·9 N.S.I I
6·0 1 5•7 N.S.
II
..
2·0 9·2 0·8 5·1 0·8 5•5III
..
1·8 2·6 0·1 I 2·3 2·1 0·1 2·3 2·2 N.S.I I
I i
There was an insignificant difference between the leaf nitrogen contents of the two varieties.
was consistently and significantly noticeable in Experiment II. It would seem that a larger amount of nitrogen moved into the ear of NP 824 than in NP 823 at all levels of nitrogen supply except N0 (cf Fig. 1),
and as the former variety had a larger grain number, the amount of nitrogen distributed per grain was smaller. The nitrogen content as percentage of dry weight of grain was also smaller in NP 824, in spite of its smaller size and weight.
NP 82?>
NP 824
2.·0
f\o
N2.
1•&
Ats
~2I • 6'
z
z
~ 1•4
~
Ats Nt
0
Ao N1
1•2
~
No
1•0
60
Ao N2
50 - At5
Nz
z
40 AI'S
N
1C7)
f\o
Nt
E
30
20
10
21 30 36 45 2.1 30 36 45
DAYS AFTER ANTt·tESIS
/FIG. 1. Drift in% N content of grains (top) and N content of grains/ear (bottom) with time (Experiment II).
94 R. D. ASANA AND R. K. SAHAY
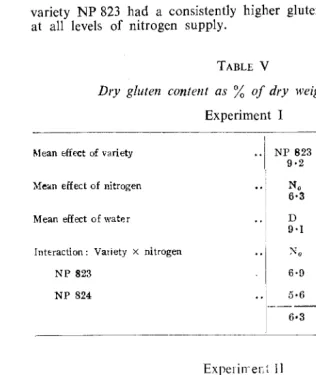
variety NP 823 had a consistently higher gluten content than NP 824 at all levels of nitrogen supply.
TABLE V
Dry gluten content as
%
of dry weight of grainsExperiment I
··I
NP 823 NP 824 I at5% P L.S.D.9·2 8·4 . O·ll
Mean effect of variety
No ~ Nt N,
6·3 8·0 12·3 0•14
Mean effect of nitrogen
Mean effect of wat~r D V..'
9 ·I 8·6 O·ll
Inttraction: Variety x nitrogen
NP 823
··I
. I 6·[) 8·o 12-8N,
. . li 5·6 I 7·9 ll·8 0·19
·6:;i;.o1;:; ..
-NP 824
ExpeiiiTer.i II
L.S.D.
Mean effect of variety NP 823 NP i24 at 5% P
(N1 + N2 ) levels 9•60 8·25 0·40
No 6·88 5·99 O·SO
MEan effect of nitrogen N1 N,
7·55 10•30 0·40
No N1+N~
6•43 8·~2 0·45
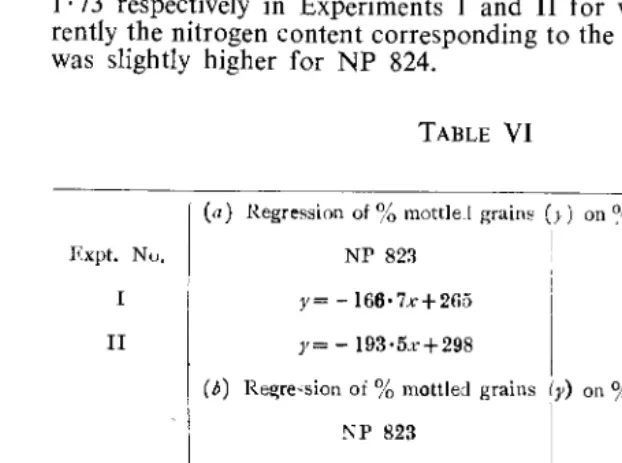
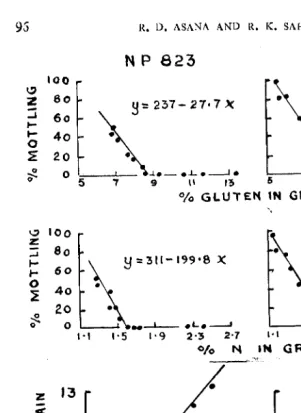
Quantitative relations between nitrogen content, gluten content and mottling of grains.-lt was considered worthwhile to estimate the effect of nitrogen supply on gluten content and incidence of mottling by regres-sion analysis. The regresregres-sion equations are presented in Table VI. The following points may be
95
The
%
N contents corresponding to 0%
mottling were 1 ·59 and 1 ·54 respectively in Experiments I and II for variety NP 823, and 1· 70 and1 · 73 respectively in Experiments I and II for variety NP 824. Appa-rently the nitrogen content corresponding to the same degree of mottling was slightly higher for NP 824.
TABLE VI
(a) Regression of% mottleJ grain~ (;) on% N content (x)
Fxpt. Nu,
NPS~
! NPSUI
II
y= -166•7x+265
I
y= -174•7xt298
y= -193·5x+298 J' = -146·3x+253
(b)
I
II
(;)
R-;~~~~:~~;~
''"'""
ly)
oo%gl~~~;,:~~)::
Regression of% gluten content (y) on% N cont~nt of grains (x)
NP 823 NP 824
I y= 5·!l9x-l•Ol y= 5•75x-1•26
II y= 5·77x-0•43 y= 5•57x-0•66
--~----(b) Regression of mottling on gluten content: The regression coefficients were highly significant, but the difference due to variety was not significant. The content of gluten corresponding to the same degree of mottling was similar for both varieties.
(c) Regression of gluten content on nitrogen content: The regres-sion coefficients were highly significant, but the difference due to variety was not significant. The nitrogen content corresponding to a unit content of gluten was, however, higher for variety NP 824.
DISCUSSION
9S
100
so
6o
40
20
0
~ IOO
z:
5
R. [), ASANA AND R, K. SAHAY
N P 823
~:::237-27•7)(
~•o-oLo~o
., 9 ,, ·~ 5 7% GLUTEN IN GRAIN
'•
9
. _ . J . _ • • _ J
II ll
_. So
~ 60 ~ =311-1<)9•8 X 0
40
~
20
~
o 0 _---~.---- eLe ~ ~....-_ ...
_,_._
.
....~..___,
1•1 1·5 1•9 2·3 2·7
1·1 1·5 1·9 2·3 2-7
O/o N IN GRAIN
z 13
<
•
«
I t ~ z
-z 9
uJ
,_
•
:::J 7
..A
(j
~ 5
0
•
1•1 1•3 1•9 2·3 '2-7 1•1 1·5 •. , 2·3 2·7
0 / 0 N IN GRAIN
FIG. 2. Relation between nitrogen content, gluten content and mottling of grain. Pooled data of two experiments.
The equations expressing regression of mottling on
%
N content of grains were:y= 3ll-199·8x for NP823, and y
=
279- 163·5x for NP 824.NP 823
NP 824
0
1· 55
1·70
%mottling
100
1·05
1·09
Thus for the same intensity of mottling, the percentage nitrogen con-tent of the grain was always less in NP 823 than in NP 824.
At the lowest level of nitrogen supply, the percentage nitrogen content of the grains was 1·14 for NP 824 and 1 · 28 for NP 823 (see
Fig. 2). Evidently the grain of NP 823 absorbed a relatively larger amount of nitrogen, per unit dry weight, than that of NP 824. It was also pointed out earlier that the amount of nitrogen moving into the ear of NP 824 was larger only at the higher levels of nitrogen supply (cf Fig. 1). It would seem that a developing grain of NP 824 did not absorb as much nitrogen as that of NP 823.
The regression equations relating % gluten content to
%
nitrogen content of the grain were:y = -0·79
+
5·90x for NP 823, andy = -0·88
+
5·6lx for NP 824.The regression coefficient for each variety was highly significant but the difference between the regression coefficients for the two varieties was not significant. Extrapolation of the regression line to 1% gluten content indicated that the corresponding nitrogen level would be 0·30% for NP 823 and 0·33% for NP 824, thus indicating requirement of a little higher nitrogen level for gluten formation in the latter variety.
The regression equations relating mottling to % gluten content were:
y = -27·7x
+
238 for NP 823 and y = -29·7x+
256 for NP 824.98 R. D. ASANA AND R. K. SAHAY
In conclusion, the reasons for the greater incidence of mottling in NP 824 at low level of nitrogen supply appear to be: (i) the grains of NP 824 absorb a slightly smaller quantity of nitrogen per unit dry weight at low levels of nirogen supply and (ii) a slightly higher level of nitrogen is required for gluten formation in the grain of NP 824. The observation of NcMeal and Davis (1954) also indicates a varietal difference in the uptake of nitrogen by grains. They found higher protein content in the grains from middle spikelets than in those from top spikelets in seven varieties of wheat, whereas such a difference did not occur in two other varieties. While differences in nitrogen ·and gluten contents may adequately account for the difference in mottling in our two varieties, at low level of nitrogen supply, the quality of gluten, which was not estimated, might also have been involved.
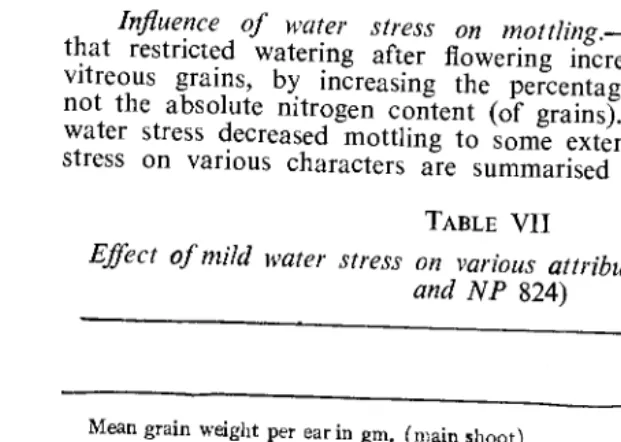
Influence of water stress on mott!ing.-Lipsett (1963) reported
that restricted watering after flowering increased the proportion of vitreous grains, by increasing the percentage nitrogen content and not the absolute nitrogen content (of grains). It was seen that mild water stress decreased mottling to some extent. The effects of water stress on various characters are summarised in Table VII.
TABLE VII
Effect of mild water stress on various attributes (mean of NP 823 and NP 824)
w
D I L.S.D.1 at I!% P
Mean grain weight per ear in gm, (main shoot) 2•60
2·49
1
0•07 1,000 grain weight in gm.
50•00 48·5
I 1·1 Mean grain number per ear
53•3 51·6 N.S. % Nitroge11 content of grains
1·63 1·78 0•12
Absolute nitrogen content of grains per ear in mg. 43·2
44·6 N.S. % gluten content of grains
8·11 9·1 O·ll
% mottling of grains
33•4 21·5 4·4
Grain yield per pot in gm.
60·3 57·3 2·3
Mean ear number per pot
31·8 31•0 N.S.
99 indicated that mild water stress did not impede movement of nitrogen into the ear. Petinov and Pavlov (1955) also concluded that the flow of nitrogen into the grain was less subject to unfavourable moisture conditions than the flow of carbohydrates. It is, therefore, inferred that the higher
%
N content of grains in D was due to relatively less accumulation of dry matter in the grain and the lower degree of mottling was due to the corresponding increase in gluten content.A mild water stress during the post-anthesis period may therefore help reduce mottling, but in view of its adverse effect on yield it cannot obviously be as effective as nitrogen.
Effect of nitrogen on grain yield and other characters.-The effects
of application of nitrogen at anthesis, or a few days later, on grain yield, ear characters, etc., are summarised in Table VIII.
TABLE VIII
Effect of nitrogen on grain yield, ear characters, etc., of the final harvest sample (The values corresponding to N1 and N, treatments of Experiment I and N1
+
N2 treatmentsof Experiment II are pooled)
Grain wieght of main shoot in gm.
1000 grain weight in gm. Grain number per ear
Re~idual dry weight (grain weight minur protein content) in gm.
% N content of grains
N content of grains/ear in mg. Grain yield per pot in gm. Ear number/pot
% mottling of grains
-I
Expt. I Ex pt. II--~--
---~---I
No Nt+N, N1 N1 + N22·31 2·66 2•361 2·65 46·3 50·6 47·4 1 50·2
50·2 53·5 50·4
1152·9
2·14 2·37 2•)9 I 2•401·27 1•91 1·241 1·66
I
29•6 51·0 2g·2 I I <l4•2
51·7 62·2 51·7 59•6 30·5 31·8 30·5 32·6 66·9 7•6 63·6 117·0
Addition of nitrogen reduced mottling and increased grain yield per ear by increasing grain number and 1,000 grain weight, and yield per pot, by influencing ear number.
100 R. D. ASANA AND R. K. SAHA Y
largely dae to carbohydrates, it would appear that nitrogen prolonged photosynthetic activity by delaying senescence. In fact, the shoots in the nitrogen treatments looked more green and yellowed more slowly. The contribution from the reserves in the stem was not increased by nitrogen as indicated by similar decrease in stem weights of treatments with and without nitrogen.
It appears that availability of nitrogen in the soil after ear emer-gence is an important factor contributing to yield as well as quality of grain (cf. Jones, 1928; Watson, 1939; Sallans and Simmonds, 1954:
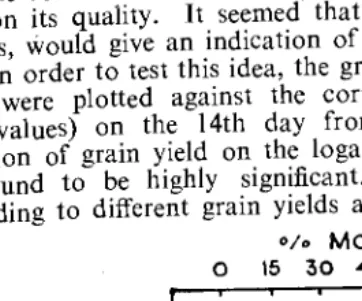
Reeves, 1954; Sadaphal and Das, 1956). Data in Table IV showed that application of nitrogen after anthesis increased the leaf-nitrogen content appreciably, but the contribution of leaf-nitrogen to grain nitrogen was very small indeed. Apparently the nitrogen tah·n up from the soil was utilized in grain development and had an important effect on its quality. It seemed that leaf-nitrogen content, soon after anthesis, would give an indication of the availability of nitrogen in the soil. In order to test this idea, the grain yields from the different treat-ments were plotted against the corresponding leaf-nitrogen contents (log
10 values) on the 14th day from anthesis (Fig. 3). The linear regression of grain yield on the logarithms of the leaf-nitrogen values was found to be highly significant. The data on
%
mottling cor-responding to different grain yields are also plotted in Fig. 3. lt willo;o MOTTliNG 0 15 30 45 60 75 90 "':'
E
~
~70
•
1-0
0...
'
:36o
•
uJ
>=
z
<
cr so
\!) 0
0·\ 0·2 0·3 0·4
LOG 10 o;o N IN LEAVES
FIG. 3. Regression of yield on nitrogen content (log10) of leaves on the 14th
day from anthesis. y=49·0+47·9x; 0-0=yieldof NP823;e-e=yield of NP 824; !:,.-!:,.=mottling% in NP 823; • - • =mottling% in NP 824.
ACKNOWLEDGEMENTS
Our thanks are due to Dr. M. S. Swaminathan, Head of the Division of Botany, for facilities for work and continuous encourage-ment. Our thanks are also due to Shri Daljit Singh, Assistant Sta-tistician, for advice on statistical matters, and to Shri P. N. Sharma, Research Assistant, for practical assistance in experimental work and in the preparation of figures.
SUMMARY
The causes of the differential tendency to mottling of grains of wheat varieties, NP 823 and NP 824, were investigated by experiments in pot-culture, in which nitrogen contents of the grain ranging from 1·15 to 2·40% of dry weight were obtained by varying the supply of nitrogen to the soil (or as spray) and imposing water stress after anthesis. At lower levels of nitrogen supply, the intensity of mottling was rela-tively greater in NP 824 than in NP 823, whereas at higher levels of nitrogen supply mottling did not appear in either variety. Data on the nitrogen contents of the developing grains, at consecutive stages after anthesis, showed that at higher levels of nitrogen supply the amount of nitrogen moving into the ear was larger in NP 824 than in NP 823, whereas at the lowest level of soil nitrogen, there was no such difference between the two varieties. Due to larger grain number per ear, and smaller grain size, in NP 824 than in NP 823, the amount of nitrogen per grain, and per its unit dry weight, was always lower in the former variety, without any compensation being made by the size factor. 1t is surmised that the developing grain of NP 824 had less capacity for accumulation of nitrogen particularly at a low level of nitrogen supply.
The gluten content of the grain increased with increase in its nitrogen content at the same rate in the two varieties, but the basal level of nitrogen for formation of gluten appeared to be higher for NP 824. With increase in gluten content, the intensity of mottling decreased at the same rate in the two varieties. The relatively greater tendency to mottling in NP 824, at low level of nitrogen supply, was therefore, due to lower absorption of nitrogen by its grain and higher basal level of nitrogen required for formation of gluten.
With water stress mottling decreased in the two varieties due to increase in
%
N content resulting from lower accumulation of dry matter in the grain.102 R. D. ASANA AND R. K. SAHAY
REFERENCES
AAMODT, 0. S. AND ToRRIE, J. N. (1935). Studies on the inheritance of and the relation between kernel texture and protein content in several spring wheat crosses. Canad. J. Res., 13C, 202-19.
Aziz, M. A. AND BHATTI, H. M. (1962). Quality considerations in wheat for ""'Chapaties' (Unleavened pan cakes). Agric. Pak., 13, 157-64.
BISSETT, W. J. AND ANDREWS, C. S. (1953). The effect of nitrogen on yield, nitrogen content and baking quality of wheat grown on the Darling Downs, Queensland.
J. Austral. Inst. Agric. Sci., 19, 40-44.
Buss, C. I. (1938). The transformation of percentages for use in the analysis of variance. Ohio J. Sci., 38, 9-12.
FISHER, E. A. AND JoNES, C. R. (1933). The wheats of commerce. Tech. Ed. Ser. No. 10.
GRAHAM, S. C. (1948). The loss of soil fertility in New South Wales as reflected by wheat quality. J. Austral. Inst. Agric. Sci., 14, 194-95.
JONES, E. G. (1928). The nitrate factor in wheat production. Unpublished Master's Thesis, Univ. Nebr. Quoted in Nebr. Agric. Exp. Sta. Res. Bull. 172 (1953).
KAIHARA, H. (1953). Studies on the quality of wheat. 2. Variation in four kinds of soluble protein of wheat grains by some treatments of nitrogenous fertilizers. Proc. Crop. Sci. Soc. Japan, 21, 256-57; Field Crop Abst., 7, item 19, 1954.
LIPSETT, J. (1963). Factors affecting the occurrence of mottling in wheat. Austral. J. Agric. Res., 14, 303-14.
McNEAL, F. H. AND DAVIS, D. J. (1954). Effect of nitrogen fertilization on yield, culm number and protein content of certain spring wheat varieties. Agro. J.,
46, 375-78.
PETINOV, N. S. AND PAVLOV, A. N. (1955). Increase of protein content of spring wheat grain (grown under irrigation) by means with spraying with nitrogenous supplements. Fiziol. Rast. (English Trans.), 2, 113-22.
REEVES, J. T. (1954). Some effects of spraying wheat with urea. J. Austral. Inst. Agric. Sci., 20, 41-45.
SADAPHAL, M. N. AND DAs, N. B. (1956). Effect of spraying urea on wheat. Sci. and Cult., 22, 38-40.
SALLANS, B. J. AND SIMMONDS, P. M. (1954). The influence of variety and pre-disposing factors on the occurrence of yellow berry (Starchiness) in wheat.
Canad. J. Agric. Sci., 34, 393-405.