www.clim-past.net/8/1169/2012/ doi:10.5194/cp-8-1169-2012
© Author(s) 2012. CC Attribution 3.0 License.
Climate
of the Past
Changes in the strength and width of the Hadley Circulation
since 1871
J. Liu1, M. Song1, Y. Hu2, and X. Ren3
1State Key Laboratory of Numerical Modeling for Atmospheric Sciences and Geophysical Fluid Dynamics,
Institute of Atmospheric Physics, Chinese Academy of Sciences, Beijing, China
2Department of Atmospheric and Oceanic Sciences, School of Physics, Peking University, Beijing, China 3Institute of Atmospheric Physics, Chinese Academy of Sciences, Beijing, China
Correspondence to: J. Liu ([email protected])
Received: 29 December 2011 – Published in Clim. Past Discuss.: 9 March 2012 Revised: 4 June 2012 – Accepted: 13 June 2012 – Published: 19 July 2012
Abstract. Recent studies demonstrate that the Hadley Circu-lation has intensified and expanded for the past three decades, which has important implications for subtropical societies and may lead to profound changes in global climate. How-ever, the robustness of this intensification and expansion that should be considered when interpreting long-term changes of the Hadley Circulation is still a matter of debate. It also remains largely unknown how the Hadley Circulation has evolved over longer periods. Here, we present long-term vari-ability of the Hadley Circulation using the 20th Century Re-analysis. It shows a slight strengthening and widening of the Hadley Circulation since the late 1970s, which is not in-consistent with recent assessments. However, over centennial timescales (1871–2008), the Hadley Circulation shows a ten-dency towards a more intense and narrower state. More im-portantly, the width of the Hadley Circulation might have not yet completed a life-cycle since 1871. The strength and width of the Hadley Circulation during the late 19th to early 20th century show strong natural variability, exceeding variability that coincides with global warming in recent decades. These findings raise the question of whether the recent change in the Hadley Circulation is primarily attributed to greenhouse warming or to a long-period oscillation of the Hadley Circu-lation – substantially longer than that observed in previous studies.
1 Introduction
The Hadley Circulation (ascent near the equator and subsi-dence in the subtropics) is a fundamental regulator of the Earth’s energy budget, i.e. redistribution of energy from trop-ics to higher latitudes. The Hadley Circulation determines the precipitation pattern in the tropics and subtropics, i.e. the prevalence of rain in the moist inner tropical regions and the dry conditions in the subtropical regions (e.g. Diaz and Bradley, 2004).
by 9 % by the late 21st century (Tanaka et al., 2005). Be-cause the signal is not consistent across the reanalyses, ra-diosonde observations, and model simulations, there are still questions about the robustness of the strengthening in recent decades that should be considered when interpreting long-term changes in the strength of the Hadley Circulation.
Satellite-borne Microwave Sounding Unit data showed an enhanced mid-latitude tropospheric warming for 1979–2005, which indicated a poleward shift of subtropical jet streams (Fu et al., 2006). Because the subtropical jet streams mark the poleward boundary of the Hadley Circulation, such change suggests a widening of the Hadley Circulation in recent decades. Various commonly used reanalyses and outgoing long-wave radiation (OLR) data showed a total Hadley Cir-culation widening of∼2–4.5◦in latitude since 1979 (Hu and Fu, 2007). The total column ozone measured by the Total Ozone Mapping Spectrometer revealed that the relative area of the tropical ozone regime extended poleward in the North-ern Hemisphere by∼2.7◦ in latitude for 1979–2003 (Hud-son et al., 2003). Radio(Hud-sonde measurements exhibit that the frequency of occurrence of high tropopause days in the sub-tropics has systematically increased, indicating a widening of the tropical belt of∼5–8◦in latitude for 1979–2005 (Seidel and Randel, 2007). The IPCC AR4 climate model simula-tions also showed Hadley Circulation widening in response to increased greenhouse gases (Lu et al., 2007; Johanson and Fu, 2009). However, the widening appears to be nearly an or-der of magnitude smaller in the IPCC AR4 simulations than those in the observations (Johanson and Fu, 2009). This sug-gests that further studies are necessary to confirm long-term changes in the meridional extent of the Hadley Circulation.
To date, it is unclear what observational and model bi-ases cause the above discrepancies in the strength and width of the Hadley Circulation in response to climate change, e.g. reanalyses and models show fundamentally different thermodynamic structures in the tropical troposphere (Mi-tas and Clement, 2006), and radiosonde observations and their assimilation in reanalyses might be one of the prob-lems (Santer et al., 2005; Shewood, 2007). The modern re-analyses now available extend from no earlier than 1948 to the present (e.g. the National Center for Environmental Pre-diction/National Center for Atmospheric Research reanaly-sis – NCEP/NCAR – starts from 1948; Kistler et al., 2001), leaving many important climate events uncovered. It remains largely unknown how the strength and width of the Hadley Circulation have evolved over longer periods, and how fu-ture climate change may affect the Hadley Circulation. Here, we analyze long-term variation of the Hadley Circulation us-ing the 20th Century Reanalysis Version 2 (20CR2), which provides the first estimates of global tropospheric variability from 1871 to 2008 (Compo et al., 2011). Preliminary valida-tions suggest that the 20CR2 depicts more realistic vertical structures of temperature trends in the tropics and subtrop-ics, and probably suffers less from spurious trends than any previous reanalyses (see discussions of the key differences
between the 20CR2 and previous reanalyses, and evaluations of the 20CR2 in Sect. 2).
2 Data and method
In this study, our results and conclusions are based on the 20th Century Reanalysis Version 2. Previous reanalyses similated the available observations using a 3D-Var data as-similation technique with the same weight given to the first guess throughout the reanalysis period. However, significant variations in data density (and accuracy) for the past half century have resulted in significant inhomogeneities from the suboptimal assimilation of observations from very dif-ferent observational networks, causing problems including incorrect tropical variability, understated storm track vari-ability, and spurious long-term trends. Sparse observations during the early 20th century and especially the 19th cen-tury further compromise the ability of 3D-Var systems to produce reliable reanalyses for these earlier periods (Bengts-son et al., 2004; Whitaker et al., 2004). Recent studies have demonstrated the feasibility of generating reliable reanaly-ses for these earlier periods using only surface observations, e.g. surface pressure has been measured consistently since the late 1800s and standard corrections are known for earlier observations. Surface pressure, through geostrophy, provides a reasonable approximation to the barotropic part of the flow, which accounts for a substantial part of the total flow. The surface pressure tendency, which is related to the vertically integrated mass flux divergence, provides further informa-tion about the tropospheric circulainforma-tion that can be captured by a data assimilation system and more advanced data as-similation methods (e.g. the Ensemble Kalman Filter or 4D-Var). Motivated by these considerations, the 20CR2 utilizes an Ensemble Filter data assimilation system, a new version of the NCEP atmospheric–land model, newly compiled surface pressure observations, and the radiative effects of historical time-varying CO2 concentrations, volcanic aerosol and
so-lar variations to generate a reanalysis spanning 1871 to 2008 (Compo et al., 2011).
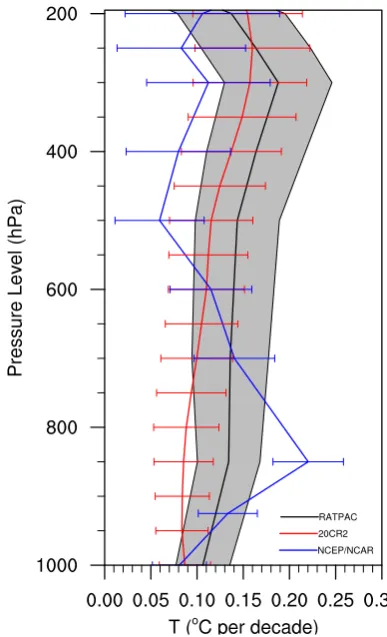
radiosonde atmospheric temperature products for assessing climate (RATPAC, Free et al., 2005), which is less influ-enced by the temporal inhomogeneities due to historical changes in instruments and measurement practices. Linear trends and their uncertainties were calculated as a function of height. The same procedure was applied to the 20CR2 and NCEP/NCAR temperature anomaly fields. As shown in Fig. 1, the observations display a warming trend extending from surface to the upper troposphere, and the upper tropo-sphere is warming faster than the surface. At all levels, tem-perature trends in the 20CR2 are considerably closer to the observations than that of the NCEP/NCAR. The improved accuracy in the 20CR2 compared to the NCEP/NCAR is most pronounced in the lower and upper troposphere. There are quantitative differences between the trends in the 20CR2 and observations. However, the magnitudes of the trends in the 20CR2 and in the observations are not significantly dif-ferent when their uncertainties are taken into account as com-pared to those of the NCEP/NCAR.
A conventional way to depict the Hadley Circulation is to calculate the mass stream function (MSF, Oort and Yienger, 1996), which is defined by 9=2π agcosϕ
p
R
0 ¯
vdp, where 9
is MSF,v¯ is the zonally-averaged north/south (meridional) velocity,a is the Earth’s radius, g is gravity,ϕ is latitude, and p is pressure level. The MSF at a given latitude and pressure level is equal to the rate at which mass is being transported meridionally between that pressure level and the top of the atmosphere. Note that the Hadley Circulation is a zonal-mean quantity, which is also known as the mean merid-ional circulation.
3 Result and discussion
To describe temporal variation of the strength of the north-ern (southnorth-ern) Hadley Circulation, we use the maximum (minimum) value of the zonal-mean mass stream function (as described in the methods summary) occurring within the latitudinal zone of 0–30◦N (0–30◦S). As shown in Fig. 2a, a substantial multi-decadal variability is evident in the strength of the northern Hadley Circulation, e.g. a pro-nounced strengthening from the 1870s to the mid-1920s, fol-lowed by a weakening to the late 1960s, and then no dis-cernible trend (or a slight strengthening) to the present. Over-laid on such multi-decadal variability, there is an upward trend (0.61×10¹⁰kg s−1,>99 % significance) indicating a
strengthening of the northern Hadley Circulation since 1871. The strengthening of the northern Hadley Circulation is per-sistent for all the seasons, with the most pronounced trend in spring (Fig. 3a). The strength of the southern Hadley Cir-culation also shows an increasing trend (0.91×10¹⁰kg s−1,
>99 % significance) since 1871 (Fig. 2b), although an anomalous decrease is found during the 1910s and 1920s.
Fig. 1. Comparison of the vertical structures of the annual-mean
temperature trends (◦C per decade) in the 20CR2, NCEP/NCAR and observations (RATPAC) for 1958–2010. Also shown are the 95 % confidence intervals (grey band for observations and error bars for the 20CR2 and NCEP/NCAR).
The strengthening of the southern Hadley Circulation occurs in all the seasons except summer (Fig. 3b).
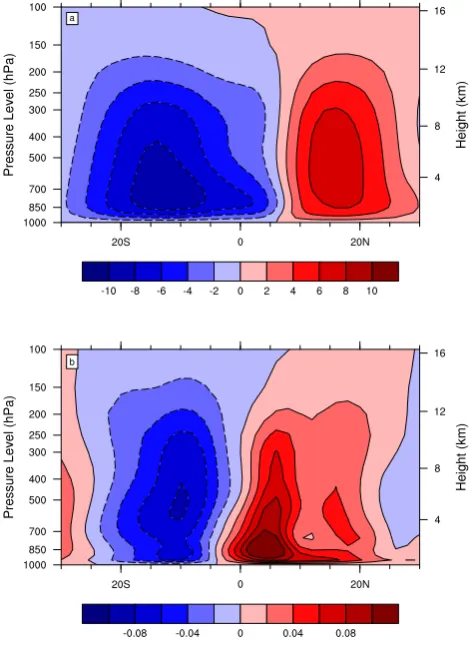
The vertical and latitudinal structure of the trend in the strength of the Hadley Circulation shows that the intensifi-cation of the northern and southern Hadley Circulation ex-tends from surface to the upper troposphere (Fig. 4b). The maximum intensification of the northern Hadley Circula-tion is more toward the lower level (∼850-hPa) and equa-tor (∼4◦N) as compared to that of the southern counterpart (∼500-hPa and 10◦S). Compared with the climatological maximum values of the northern and southern Hadley Cir-culation (Fig. 4a), the strength of the northern and southern Hadley Circulation has increased by∼26.9 % and 12 %, re-spectively, since 1871.
Fig. 2. Time series of the annual-mean (grey line) and 10-yr running
mean (black line) strength, edge and width of the Hadley Circula-tion for 1871–2008: (a) the strength of northern component, (b) the strength of the southern component, (c) the poleward-edge of the northern and southern components, and (d) the width and (e) time series of the annual-mean GHCN surface temperature and 20CR2 surface air temperature for 1871–2008.
Fig. 3. Annual and seasonal trends of (a) the strength of the northern
and southern Hadley Circulation (×1010kg s−1per decade), and
(b) the poleward-edge and width of the Hadley Circulation (latitude
per decade) for 1871–2008.
seasonally dependent – equatorward in winter and spring and poleward in summer and autumn (Fig. 3b). The south-ern edge of the southsouth-ern Hadley Circulation shows a signif-icant equatorward-moving tendency since 1871 (1◦ in lat-itude, >99 % significance), although a poleward shift is found starting from the late 1970s (Fig. 2c). The equator-ward shift of the southern edge of the southern Hadley Cir-culation occurs in all the seasons (Fig. 3b). We note that the northern and southern edges of the Hadley Circulation tend to diverge starting from the late 1970s, which is consistent with the identified expansion of the Hadley Circulation in the aforementioned studies.
Fig. 4. (a) Climatology (×1010kg s−1) and (b) trend (×1010 kg s−1per decade) of the mass stream function of the Hadley Cir-culation for 1871–2008.
of the width of the Hadley Circulation. The spectral analy-sis indicates that the width of the Hadley Circulation exhibits a clear secular peak indicative of centennial-scale variabil-ity that is distinct from the null hypothesis of a red-noise stochastic process, (>99 % significance, Fig. 5). Overall, the Hadley Circulation shows a tendency toward a narrower state during 1871–2008 (−1.44◦in latitude,>99 % significance). Despite a large number of observational and modeling studies, it remains unclear how the strength and width of the Hadley Circulation are related (Schneider et al., 2010). As shown in Table 1, significant out-of-phase relationships are found between the strength, and the width and northern edge of the Hadley Circulation, even with the trends removed. By contrast, no strength–width relationship exists for the south-ern counterpart, although significant correlation is found be-tween the strength and the southern edge of the southern Hadley Circulation. This indicates that the northern Hadley Circulation might dominate the southern counterpart in mod-ulating the meridional extent of the Hadley Circulation.
It is instructive to analyze the relationship between the covariability of the strength and width of the Hadley Cir-culation and surface temperature. The Global Historical
Table 1. Correlations between the strength, width and edge of the
Hadley Circulation, and regressions of the strength and width of the Hadley Circulation on the averaged 20CR2 surface air temperature in the tropics and subtropics (TSSAT).
Correlation Regression
(1010kg s−1per◦C)
Width Edge (N) Edge (S) TSSAT
Strength (N) −0.59 −0.59 −0.17 −0.66 (−0.88) Strength (S) −0.06 0.19 −0.46 1.67 (1.28)
Width 1 0.88 0.48 −0.25 (2.09)
Note:>99 % significance is in bold type.
Fig. 5. Spectrum and red-noise confidence intervals for the time
series of the annual mean width of the Hadley Circulation.
Climatology Network (GHCN) data (http://www1.ncdc. noaa.gov/pub/data/cmb/ghcnm/ghcnm-v3.pdf) shows that the global-mean surface temperature has warmed by 0.06◦C for 1880–2008 (Fig. 2e). Compared to the observations, the global-mean near surface air temperature of the 20CR2 shows comparable warming trend (0.06◦C for 1880–2008), and coherent variation (the correlation between the 20CR2 and GHCN is 0.94,>99 % significance).
It has been suggested that the Hadley Circulation would weaken in association with global warming (Diaz and Bradley, 2004; Lu et al., 2007; Vecchi and Soden, 2007), which is based on the relationship between the meridional surface temperature gradient and the strength of the Hadley Circulation (Diaz and Bradley, 2004). The IPCC AR4 model projected a decrease of convective overturning in the trop-ics as climate warms (Vecchi and Soden, 2007), but some studies demonstrate that the Hadley Circulation has strength-ened in recent decades, particularly in winter. Here, our anal-ysis shows the Hadley Circulation has strengthened in accor-dance with the increase of the global-mean surface temper-ature since 1871, but the northern Hadley Circulation shows substantial multi-decadal fluctuations.
extent of the Hadley Circulation is determined by the lati-tude of baroclinic instability. Under global warming condi-tions, the subtropical static stability increases due to an estab-lished consequence of moist thermodynamics which pushes the baroclinic instability zone poleward, and consequently causes the outer boundary of the Hadley Cell to extend pole-ward (Lu et al., 2007). Here, our analysis shows that the Hadley Circulation has shrunk by 1.44◦in latitude in accor-dance with surface warming during 1871–2008.
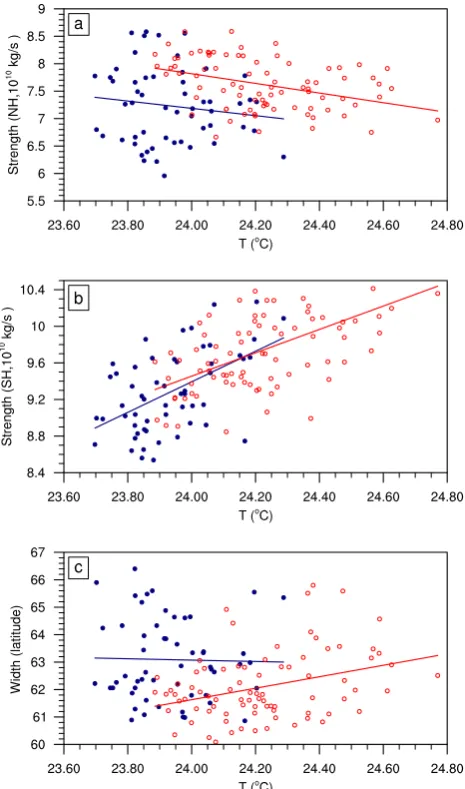
The sustained increase in the width of the Hadley Circu-lation for the past few decades that has occurred simultane-ously with a significant positive trend in the global-mean sur-face temperature has led to the speculation that the changes in both fields are the result of greenhouse warming. Mean-while, examination of the strength and width of the Hadley Circulation shows substantial changes during the late 19th to early 20th century, which features low atmospheric concen-tration of greenhouse gases. We further divide the entire pe-riod (1871–2008) into (1) a cold pepe-riod (1871–1925), which features a slight decrease or no increase in the global-mean surface air temperature, and (2) a warm period (1926–2008), which is characterized by a quite persistent rise in the global-mean surface air temperature (Fig. 2e). As shown in Fig. 6, the strength of the northern Hadley Circulation decreases with the increasing surface air temperature, although such dependence during the cold period is not statistically signif-icant (Table 1). The opposite is the case for the strength of the southern counterpart, which increases with the increas-ing surface air temperature. This suggests that the northern and southern components of the Hadley Circulation have op-posite strength–temperature relationships. The width of the Hadley Circulation does show an expansion with the increas-ing surface air temperature durincreas-ing the warm period, but no dependence on surface temperature is found during the cold period. The width of the Hadley Circulation changes non-monotonically with surface temperature, showing different sensitivity to cold and warm conditions.
4 Conclusions
We conclude that the 20CR2 does indicate a slight strength-ening and widstrength-ening of the Hadley Circulation for the past three decades, corroborated by the results of recent analy-ses. However, over longer periods (1871–2008), the Hadley Circulation has become stronger and narrower. Moreover, we speculate that the width of the Hadley Circulation might have not finished a full life-cycle since the 1870s, which indicates the observed expansion in recent decades might be a reflection of a long-period oscillation. The position of the Intertropical Convergence Zone (ITCZ) is effectively a tracer of the horizontal scale of the Hadley cell (Hu et al., 2007). Growing paleoclimatic proxy evidence indi-cates centennial-scale oscillatory behavior of the position of the ITCZ for the past several millennia, i.e. the planktic foraminifera Globigerinoides sacculifer in Gulf of Mexico
Fig. 6. Scatter plots of the strength and width of the Hadley
Cir-culation versus the averaged 20CR2 surface air temperature in the tropics and subtropics (30◦S–30◦N) during the cold (1871–1925, blue) and warm (1926–2008, red) periods: (a) the strength of the northern component, (b) the strength of the southern component, and (c) the width.
sediments show the distinct century-scale cyclicity of ITCZ (Poore et al., 2004). Although the identified secular variabil-ity of the width of the Hadley Circulation is not inconsis-tent with the paleoproxy evidence, the interpretation of such variability must be treated with caution because the science is not yet at a stage where sound judgments on this matter can be offered. The long-term changes of the Hadley Circu-lation might be resolved by a network of proxy observations that describe tropical–subtropical divergence gradients and variations.
the strength and width of the Hadley Circulation and surface temperature is not supported. These findings are intriguing and raise the question of whether the recent changes in the Hadley Circulation are primarily due to greenhouse warming or long-term change of the Hadley Circulation (e.g. variabil-ity of the Hadley Circulation at centennial timescales). Attri-butions of those changes require a deeper understanding of how the strength and width of the Hadley Circulation is con-trolled under various dynamical regimes, even in the present climate state.
Acknowledgements. This research is supported by 973 program
(2011CB309704) and NSFC (41176169).
Edited by: D. Wheeler
References
Bengtsson, L., Hodges, K., and Hagemann, S.: Sensitivity of the ERA-40 reanalysis to the observing system: Determination of the global atmospheric circulation from reduced observations, Tel-lus A, 56, 456–471, 2004.
Br¨onnimann, S., Compo, G. P., Spadin, R., Allan, R., and Adam, W.: Early ship-based upper-air data and comparison with the Twenti-eth Century Reanalysis, Clim. Past, 7, 265–276, doi:10.5194/cp-7-265-2011, 2011.
Chen, J., Carlson, B., and Del Genio, A.: Evidence for strengthen-ing of the tropical general circulation in the 1990s, Science, 295, 838–841, 2002.
Compo, G., Whitaker, J., Sardeshmukh, P., Matsui, N., Allan, R., Yin, X., Gleason, B., Vose, R., Rutledge, G., Bessemoulin, P., Bronnimann, S., Brunet, M., Crouthamel, R., Grant, A., Grois-man, P., Jones, P., Kruk, M., Kruger, A., Marshall, G., Maugeri, M., Mok, H., Nordli, Ø., Ross, T., Trigo, R., Wang, X., Woodruff, S., and Worle, S.: The Twentieth Century Reanalysis Project, Q. J. Roy. Meteorol. Soc., 137, 1–28, 2011.
Diaz, H. and Bradley, R. (Eds.): The Hadley Circulation, Present, Past and Future, Kluwer Academic, Dordrecht, 511 pp., 2004. Free, M., Seidel, D., Angell, J., Lanzante, J., Durre, I., and
Peterson, T.: Radiosonde Atmospheric Temperature Products for Assessing Climate (RATPAC): A new dataset of large-area anomaly time series, J. Geophys. Res., 110, D22101, doi:10.1029/2005JD006169, 2005.
Fu, Q., Johanson, C., Wallace, J., and Reichler, T.: Enhanced mid-latitude tropospheric warming in satellite measurements, Sci-ence, 312, 1179, doi:10.1126/science.1125566, 2006.
Hansen, J., Ruedy, R., Sato, M., and Lo, K.: Global sur-face temperature change, Rev. Geophys., 48, RG4004, doi:10.1029/2010RG000345, 2010.
Hu, Y. and Fu, Q.: Observed poleward expansion of the Hadley circulation since 1979, Atmos. Chem. Phys., 7, 5229–5236, doi:10.5194/acp-7-5229-2007, 2007.
Hu, Y., Li, D., and Liu, J.: Abrupt seasonal variation of the ITCZ and the Hadley circulation, Geophys. Res. Lett., 34, L18814, doi:10.1029/2007GL030950, 2007.
Hudson, R., Frolov, A., Andrade, M., and Follette, M.: The total ozone field separated into meteorological regimes, Part I: Defin-ing the regimes, J. Atmos. Sci., 60, 1669–1677, 2003.
Johanson, C. and Fu, Q.: Hadley cell widening: Model simulations versus observations, J. Climate, 22, 2713–2725, 2009.
Jones, P., New, M., Parker, D., Martin, S., and Rigor, I.: Surface air temperature and its variations over the last 150 years, Rev. Geophys., 37, 173–199, 1999.
Kistler, R., Kalnay, E., Collins, W., Saha, S., White, G., Woollen, J., Chelliah, M., Ebisuzaki, W., Kanamitsu, M., Kousky, V., van den Dool, H., Jenne, R., and Fiorino, M.: The NCEP-NCAR 50-Year Reanalysis: Monthly Means CD-ROM and Documentation, B. Am. Meteorol. Soc., 82, 247–268, 2001.
Lu, J., Vecchi, G., and Reichler, T.: Expansion of the Hadley cell under global warming, Geophys. Res. Lett., 34, L06805, doi:10.1029/2006GL028443, 2007.
Mitas, C. and Clement, A.: Has the Hadley cell been strength-ening in recent decades?, Geophys. Res. Lett., 32, L03809, doi:10.1029/2004GL021765, 2005.
Mitas, C. and Clement, A.: Recent behavior of the Hadley cell and tropical thermodynamics in climate models and reanalyses, Geo-phys. Res. Lett., 33, L03809, doi:10.1029/2005GL024406, 2006. Oort, A. and Yienger, J.: Observed interannual variability in the Hadley circulation and its connection to ENSO, J. Climate, 9, 2751–2767, 1996.
Poore, R., Quinn, T., and Verardo, S.: Century-scale move-ment of the Atlantic Intertropical Convergence Zone linked to solar variability, Geophys. Res. Lett., 31, L12214, doi:10.1029/2004GL019940, 2004.
Santer, B., Wigley, T., Mears, C., Wentz, F., Klein, S., Seidel, D., Taylor, K., Thorne, P., Wehner, M., Gleckler, P., Boyle, J., Collins, W., Dixon, K., Doutriaux, C., Free, M., Fu, Q., Hansen, J., Jones, G., Ruedy, R., Karl, T., Lanzante, J., Meehl, G., Ra-maswamy, V., Russell, G., and Schmidt, G.: Amplification of surface temperature trends and variability in the tropical atmo-sphere, Science, 309, 1551–1556, 2005.
Schneider, T., O’Gorman, P., and Levine, X.: Water vapor and the dynamics of climate changes, Rev. Geophys., 48, RG3001, doi:10.1029/2009RG000302, 2010.
Seidel, D. and Randel, W.: Recent widening of the tropical belt: Evidence from tropopause observations, J. Geophys. Res., 112, D20113, doi:10.1029/2007JD008861, 2007.
Sherwood, S.: Simultaneous detection of climate change and ob-serving biases in a network with incomplete sampling, J. Cli-mate, 20, 4047–4062, 2007.
Song, H. and Zhang, M.: Changes of the boreal winter hadley circu-lation in the NCEP-NCAR and ECMWF reanalyses: a compara-tive study, J. Climate, 20, 5191–5200, 2007.
Tanaka, H., Ishizaki, N., and Nohara, D.: Intercomparison of the in-tensities and trends of Hadley, Walker and monsoon circulations in the global warming projections, SOLA, 1, 77–80, 2005. Vecchi, G. and Soden, B.: Global Warming and the Weakening of
the Tropical Circulation, J. Climate, 20, 4316–4340, 2007. Whitaker, J., Compo, G., Wei, X., and Hamill, T.: Reanalysis
with-out radiosondes using ensemble data assimilation, Mon. Weather Rev., 132, 1190–1200, 2004.