ABSTRACT
ALLEN, RONALD MAURICE. Performance Measurement of Textile and Apparel Supply Chains in Developing Countries. (Under the direction of William Oxenham and George Hodge).
This research examined performance measurement of textile and apparel supply chains in developing countries. The research utilized a two-phase, mixed methods research design. The first phase consisted of field research on the Sri Lankan textile and apparel industry. The second phase collected quantitative data using online surveys and qualitative data using phone interviews.
Results indicate that developed and developing countries differ with respect to performance measurement of textile and apparel supply chains. Companies in developed countries are more likely to have a performance measurement system, whereas companies in developing countries are more likely to not have such a system. In addition, results indicate differences between smaller and larger companies.
Performance Measurement of Textile and Apparel Supply Chains in Developing Countries
by
Ronald Maurice Allen
A dissertation submitted to the Graduate Faculty of North Carolina State University
In partial fulfillment of the Requirements for the degree of
Doctor of Philosophy
Textile Technology Management
Raleigh, North Carolina 2008
APPROVED BY:
__________________________________ William Oxenham, PhD
Committee Co-Chair
__________________________________
__________________________________ George Hodge, PhD
Committee Co-Chair
BIOGRAPHY
ACKNOWLEDGEMENTS
Many people facilitated this journey, and to those I am truly grateful. To my advisors, Dr. William Oxenham and Dr. George Hodge, thank you for the guidance, encouragement, and opportunities that you both have provided. To Dr. Kristin Thoney and Dr. Erin Parrish, many thanks for supporting me throughout my college career. I also want to thank Dr. Marguerite Moore for aiding with statistical analysis of data.
My eternal gratitude goes to my friends – Without all of you, I would not have made it through this journey. Special thanks to Jessica Brooks, Jennifer Jenkins, Brian Beach, Conor Boing, Josie Georges, Dr. Shanna Bruer Hess, Michelle Hogan, Nick Whaley, and Shelby Gull Laird. Thanks for the support, laughter, dinner, and drinks. To my fellow doctoral students, Kate Dutton, Beth Newcomb, and Genevieve Garland, thanks for the lunches, coffee breaks, and encouragement – I’m excited to work with you all as our careers progress.
Many thanks go to those who assisted with field research in Sri Lanka. I am very grateful to the staff of the Clothing Industry Training Institute and MAS Holdings. Special thanks to Dr. Christy Cagle, whose support while abroad was invaluable.
TABLE OF CONTENTS
List of Tables ... ix
List of Figures ... xii
1 Introduction ...1
1.1 Objectives of the Research ...2
1.2 Purpose of the Research ...3
1.3 Significance of Study ...3
2 Review of Literature ...5
2.1 Supply Chain Management ...5
2.2 Performance Measurement ...8
2.2.1 Balanced Scorecard ...13
2.2.1.1 Components of the Balanced Scorecard ... 14
2.2.2 Component Perspective ...16
2.2.3 Planning Level Perspective ...20
2.2.4 Supply Chain Sector Perspective ...24
2.2.5 Combination Perspectives ...26
2.2.5.1 Gunasekaran et al., 2001 ... 27
2.2.5.2 Gunasekaran et al., 2004 ... 28
2.2.5.3 Bullinger et al., 2002 ... 29
2.2.5.4 Bhagwat and Sharma, 2007 ... 30
2.2.6 Exhaustive Perspectives ...32
2.3 Textile and Apparel Applications ...38
2.4 Conclusion ...44
3.3.1.1 Phase I (Field Research – Sri Lanka): Sample Selection ... 48
3.3.1.2 Phase I (Field Research – Sri Lanka): Data Collection ... 49
3.3.2 Phase II (Survey and Interview) ...49
3.3.2.1 Phase II (Survey): Sample Selection... 50
3.3.2.2 Phase II (Survey): Data Collection ... 51
3.3.2.3 Phase II (Survey): Research Questions ... 52
3.3.2.3.1 Additional Analyses ... 56
3.3.2.4 Phase II (Survey): Data Analysis ... 56
3.3.2.5 Phase II (Interview): Sample Selection ... 57
3.3.2.6 Phase II (Interview): Data Collection ... 57
3.3.2.7 Phase II (Interview): Data Analysis ... 58
3.3.3 Institutional Review Board ...58
4 Results and Discussion ...59
4.1 Phase I Results (Field Research – Sri Lanka) ...59
4.1.1 Phase I (Field Research – Sri Lanka) Results: Respondent Summary Statistics .59 4.1.2 Phase I (Field Research – Sri Lanka) Results: Sri Lankan Textile and Apparel Industry ...60
4.1.2.1 Reasons for Sourcing from Sri Lanka ... 61
4.1.2.2 Small and Medium Companies (SME’s) ... 62
4.1.2.3 Large Companies ... 64
4.1.2.4 Upstream Manufacturing ... 64
4.1.2.4.2 Fabric ... 64
4.1.2.4.3 Yarn... 65
4.1.2.4.4 Dyeing/Finishing... 65
4.1.2.5 Product Improvement Program ... 65
4.1.2.6 Joint Apparel Association Forum (JAAF) ... 66
4.1.2.7 Design and Product Development ... 67
4.1.2.8 Advantages of Sri Lanka ... 68
4.1.2.10 Needs... 72
4.1.3 Phase I (Field Research – Sri Lanka) Results: Company Profiles ...75
4.1.3.1 Company SL1 ... 75
4.1.3.2 Company SL2 ... 75
4.1.3.3 Company SL3 ... 77
4.1.3.4 Company SL4 ... 80
4.1.3.5 Company SL5 ... 82
4.1.3.6 Company SL6 ... 83
4.1.3.7 Company SL7 ... 85
4.1.3.8 Company SL8 ... 87
4.1.3.9 Company SL9 ... 87
4.2 Phase II (Survey) Results ...89
4.2.1 Phase II (Survey) Results: Summary Statistics ...89
4.2.2 Phase II (Survey) Results: Chi-square Tests of Survey Data ...109
4.2.2.1 RQ1: How does the presence of a performance measurement system differ? ... 109
4.2.2.2 RQ2: How does the basis of a performance measurement system differ? ... 115
4.2.2.3 RQ3: How do the components of a performance measurement system differ? ... 116
4.2.2.4 RQ4: How do supplier performance metrics differ? ... 118
4.2.2.5 RQ5: How do customer performance metrics differ? ... 122
4.2.2.6 RQ6: How do internal performance metrics differ? ... 122
4.2.2.7 RQ7: How do supply chain performance metrics differ? ... 129
4.3 Phase II (Interview) Results ...140
4.3.1 Phase II (Interview) Results: Respondent Summary Statistics ...140
4.3.2 Phase II (Interview) Results: Company Summary Statistics ...142
4.3.3 Phase II (Interview) Results: Supply Chain Management ...147
4.3.3.1 Phase II (Interview) Results: Performance Measurement and Improvement 156 5 Summary and Conclusions ...168
5.1 Summary of Results ...168
5.1.1 RO1: Identify the measures used by textile and apparel companies to gauge the performance of their supply chains in developing and developed countries. ....168
5.1.1.1 Differences by Country Type ... 168
5.1.1.2 Differences by Company Size ... 169
5.1.1.3 Performance Metrics: Supplier, Internal, and Supply Chain ... 171
5.1.2 RO2: Develop a practical definition of supply chain management in developing and developed countries. ...172
5.1.3 RO3: Evaluate the efforts of companies in developing countries to improve performance. ...173
5.1.4 RO4: Construct a model of performance measurement specific to textiles and apparel. ...174
5.1.4.1 Company Types ... 175
5.1.4.1.1 Developing Companies ... 175
5.1.4.1.2 Developed Companies ... 175
5.1.4.2 Existence of a Performance Measurement System ... 176
5.1.4.3 Specific Performance Metrics ... 177
5.2 Conclusions ...179
5.3 Limitations of the Research ...181
5.4 Recommendations for Future Studies ...181
6 References ...183
Appendix A: Survey Cover Letter ...186
Appendix C: Survey Questionnaire ...191
Appendix D: Thank You Page ...203
Appendix E: Interview Information Page ...205
Appendix F: Second Thank You Page ...207
Appendix G: Informed Consent Forms for Interviews ...209
Appendix H: Interview Questionnaire ...212
LIST OF TABLES
Table 2.1: Performance measurement systems requirements analysis ... 10
Table 2.2: Categories of performance measurement in logistics and SC systems ... 12
Table 2.3: Goals of performance measure types ... 18
Table 2.4: Examples performance measures ... 19
Table 2.5: A framework for performance metrics for supply chain evaluation ... 22
Table 2.6: A list of key SCM performance metrics ... 23
Table 2.7: SCOR performance metrics ... 26
Table 2.8: Supply chain performance metrics framework ... 29
Table 2.9: Supply chain performance indicators ... 30
Table 2.10: Balanced scorecard for supply chain evaluation ... 31
Table 2.11: Taxonomy of supply chain performance measures ... 33
Table 2.12: Supply chain performance metrics and relation to categories and factors ... 37
Table 3.1: Listserv descriptors ... 51
Table 3.2: Dependent and independent variables for study ... 52
Table 4.1: Job titles of interview respondents (Phase I Field Research – Sri Lanka) ... 60
Table 4.2: Job areas of respondents (Question 1) ... 90
Table 4.3: Location of companies’ headquarters (Question 3) ... 92
Table 4.4: Summary of product categories (Question 4) ... 95
Table 4.5: Summary of company types (Question 5) ... 96
Table 4.6: Summary of products produced (Question 7) ... 97
Table 4.7: Summary of manufacturing regions (Question 8) ... 98
Table 4.8: Summary of products sourced (Question 9) ... 99
Table 4.9: Summary of sourcing regions (Question 10) ... 100
Table 4.10: Relation of 2007 sales to 2007 sales alt (Determined from Question 11) ... 101
Table 4.12: Chi-square values, degrees of freedom, and p-values for RQ1 – How does the presence of a performance measurement system differ? ... 110 Table 4.13: Presence of a performance measurement system by manufacturing region (RQ1f)
... 113 Table 4.14: Presence of a performance measurement system by end market (RQ1i) ... 115 Table 4.15: Chi-square values, degrees of freedom, and p-values for RQ2 – How does the
basis of a performance measurement system differ? ... 116 Table 4.16: Chi-square values, degrees of freedom, and p-values for RQ3 – How do the
components of a performance measurement system differ? ... 117 Table 4.17: Components of a performance measurement system by country type (RQ3b) . 117 Table 4.18: Chi-square values, degrees of freedom, and p-values for RQ4 – How do supplier performance metrics differ? ... 118 Table 4.19: Top and bottom supplier performance metrics by country type (RQ4b) ... 121 Table 4.20: Chi-square values, degrees of freedom, and p-values for RQ5 – How do customer performance metrics differ? ... 122 Table 4.21: Chi-square values, degrees of freedom, and p-values for RQ6 – How do internal performance metrics differ? ... 123 Table 4.22: Top and bottom internal performance metrics by country type (RQ6b) ... 125 Table 4.23: Top and bottom internal performance metrics by manufacturing region (RQ6f)
... 128 Table 4.24: Chi-square values, degrees of freedom, and p-values for RQ7 – How do supply
Table 4.29: Chi-square values, degrees of freedom, and p-values for RQ11 – How do
strategies for improved competitiveness differ? ... 136
Table 4.30: Chi-square values, degrees of freedom, and p-values for RQalt – Additional analyses ... 138
Table 4.31: Sales by number of employees (RQalt1) ... 139
Table 4.32: Job titles of interview respondents ... 140
Table 4.33: Experience levels for respondents ... 141
Table 4.34: Products produced, grouped by country and supply chain sector ... 143
Table 4.35: Size in terms of sales and number of employees by country and supply chain sector ... 145
Table 4.36: Owned manufacturing locations by country and supply chain sector ... 146
Table 4.37: Supply chain sectors for companies ... 147
Table 4.38: Customers by country ... 149
Table 4.39: Suppliers by supply chain sector ... 150
Table 4.40: Supply chain configurations by supply chain sector ... 152
Table 4.41: Definition of supply chain management by supply chain sector ... 155
Table 4.42: Value addition ... 157
Table 4.43: Performance measurement of suppliers ... 159
Table 4.44: Performance measurement of customers ... 161
Table 4.45: Internal performance measurement ... 162
Table 4.46: Internal performance improvement efforts ... 164
Table 4.47: Efforts to evaluate complete supply chain ... 166
LIST OF FIGURES
Figure 1.1: Visual depiction of the research question ... 2
Figure 2.1: Typical supply chain ... 5
Figure 2.2: Theoretical framework for supply chain management research ... 7
Figure 2.3: Triple P-model ... 11
Figure 2.4: Balanced scorecard ... 13
Figure 2.5: The supply chain measurement system ... 17
Figure 2.6: Levels of collaboration ... 21
Figure 2.7: Interrelation of five key management processes of the SCOR model ... 24
Figure 2.8: SCOR release timeline ... 25
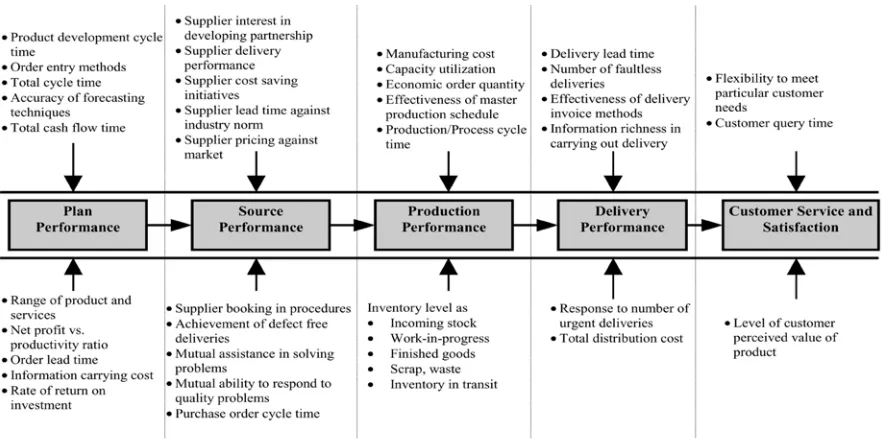
Figure 2.9: Measures and metrics for basic sections of a supply chain ... 27
Figure 2.10: Most important factors in choosing a sourcing region/partner ... 40
Figure 2.11: Performance measure frequency – secondary data ... 41
Figure 2.12: Performance measure frequency – primary data (Nowell, 2005) ... 42
Figure 2.13: Balanced scorecard for Nike European Operations ... 43
Figure 2.14: Relation of performance measurement research over time ... 45
Figure 3.1: Concurrent triangulation strategy. ... 48
Figure 4.1: Value addition activities at Company SL6 ... 84
Figure 4.2: Value addition activities at Company SL7 ... 86
Figure 4.3: Employment lengths for respondents (Question 2) ... 91
Figure 4.4: Country types (Determined from Question 3) ... 93
Figure 4.5: Company regions (Determined from Question 3) ... 94
Figure 4.6: 2007 sales of companies (Question 11) ... 101
Figure 4.12: Relative percentages of supplier, customer, internal, and supply chain
performance metrics ... 107
Figure 4.13: Presence of a performance measurement system by country type (RQ1b) ... 111
Figure 4.14: Presence of a performance measurement system by region (RQ1c) ... 112
Figure 4.15: Presence of a performance measurement system by number of employees (RQ1h) ... 114
Figure 4.16: Supplier performance metrics by country type (RQ4b) ... 120
Figure 4.17: Internal performance metrics by country type (RQ6b) ... 124
Figure 4.18: Internal performance metrics by manufacturing region (RQ6f) ... 127
Figure 4.19: Supply chain performance metrics by country type (RQ7b) ... 131
Figure 4.20: Strategies for improved competitiveness by country type (RQ11b) ... 137
1
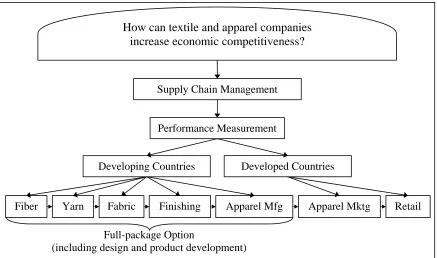
INTRODUCTIONTrade agreements and the phase out of quotas due to the WTO have caused a dramatic increase in global sourcing over the past decade. Textile and apparel products are being produced in developing countries, sometimes thousands of miles away from the point of consumption – developed countries. During this same period, the concept of supply chain management has gained wide acceptance. Companies are cooperatively working to increase competitiveness, and gauging the performance of supply chains has become increasingly more important. In order for a supply chain to succeed, companies should measure the performance of the chain and identify areas of improvement for increased competitiveness.
Figure 1.1: Visual depiction of the research question
1.1 Objectives of the Research
The objectives of this research were to:
RO1: Identify the measures used by textile and apparel companies to gauge the performance of their supply chains in:
RO1A: Developing countries; RO1B: Developed countries.
RO2: Develop a practical definition of supply chain management in developing and developed countries.
RO3: Evaluate the efforts of companies in developing countries to improve performance. How can textile and apparel companies
increase economic competitiveness?
Supply Chain Management
Performance Measurement
Developing Countries Developed Countries
Fiber Yarn Fabric Finishing Apparel Mfg Apparel Mktg Retail
Full-package Option
1.2 Purpose of the Research
This research investigated performance measurement for supply chains in developing and developed countries. It identified specific measures that textile and apparel companies use to gauge the performance of their supply chains. The research developed a practical definition of supply chain management in developing countries. In addition, downstream companies in developed countries were interviewed to discover metrics used to measure supply chain performance. Also, this research evaluated performance improvement efforts of textile and apparel manufacturers in developing countries.
1.3 Significance of Study
This research was significant for several reasons. First, it examined performance measurement specific to textiles and apparel for companies in developed and developing countries. Secondly, the sample for the research was global in nature, and contained respondents from Asia, Latin America, the United States, and Europe.
2
REVIEW OF LITERATURE2.1 Supply Chain Management
According to Beamon (1999), “a supply chain is an integrated process wherein raw materials are manufactured into final products, then delivered to customers (via distribution, retail, or both).” The supply chain includes all activities in the flow and conversion of goods from raw material to final consumer (Handfield & Nichols, 1999). A typical supply chain is shown in Figure 2.1.
Figure 2.1: Typical supply chain
Source: Midha, V.K., Mathur, G. & Sharma, C. (2007). Supply chain management in the textile industry. Textile Asia, September 2007, 65-66.
Some supply chain models omit the customer, arguing that the customer does not add value. However, customers do add value by providing feedback to the supply chain about quality,
Flow of Products and Services
Flow of Demand and Design Information
The concept of supply chain management is defined as “the systemic, strategic coordination or the traditional business functions within a particular company or across businesses within the supply chain, for the purposes of improving the long-term performance of the individual companies and the supply chain as a whole” (Mentzer et al., 2001; Mentzer, Myers, & Stank, 2007). It includes all activities from concept to consumer. According to Handfield and Nichols (1999), supply chain management – the integration of all the activities in producing a product – is used to create a competitive advantage by strengthening relationships among supply chain members.
A theoretical framework for research in supply chain management is shown in Figure 2.2 (Chen & Paulraj, 2004). Chen and Paulraj (2004) reviewed more than 400 articles dealing with supply chain management in terms of purchasing and supply, logistics and transportation, marketing, organizational behavior, network, strategic management, management information system, and operations management. From the literature, the theoretical framework was developed.
Figure 2.2: Theoretical framework for supply chain management research
Source: Adapted from Chen, I.J. & Paulraj, A. (2004). Understanding supply chain management: Critical research and a theoretical framework. International Journal of Production Research, 42(1), 131-163.
2.2 Performance Measurement
As noted in Beamon (1999), cost was the basis of performance measures in many supply chain models from the mid-1980’s to the mid-1990’s. According to a KSA report (1996; 1998), performance measurement in SMEs was focused on benchmarks of financial measures (As cited in Cooper, Rayson, Botchway, & McCafferty, 2005). Though cost is an important measure in determining performance, it should not be the sole performance measure. For example, a company could be operating at minimum cost; however, material utilization, productivity, lead time, or customer satisfaction could be lacking.
Performance measurement systems involve the methods used to gauge the performance of a supply chain. Beamon (1996 as cited in Beamon, 1999) states characteristics of performance measurement systems: inclusiveness (all relevant information is measured), universality (differing conditions can be compared), measurability (data can be measured), and consistency (measures are consistent with organizational goals). These characteristics can be used as a starting point for analyzing performance measurement systems. Research in performance measurement systems involves identifying performance measures, grouping these measures, and developing frameworks for performance measurement systems.
Table 2.1: Performance measurement systems requirements analysis
Source: Alfaro, J., Ortiz, A., & Poler, R. (2007). Performance measurement systems for business processes. Production Planning & Control, 18(8), 641-654.
PMS requirement BSC PRISM IDPMS DPMSM PMS IE-GIP
Reflects stakeholders requirements ** *** * * ***
Reflects external/competitive position * * * ** *
Reflects competitive criteria *** *** ** *** ***
Differentiates between control and improvement measures * * ** *** **
Facilitates strategy development * ** ** * ***
Deploys strategic objectives *** ** ** ** ***
Objective deployed to business processes and activities ** *** * *** ***
Focuses of critical areas of the business * *** *** ** ***
Facilitates resource bargaining * *** *** ** ***
Facilitates performance planning *** *** *** *** ***
Focuses of leading measures as well as lagging measures *** *** *** *** **
Accommodates both quantitative and qualitative measures *** *** *** *** ***
Measures organizational capability and learning where
appropriate *** *** ** ** ***
Uses measures at correct levels * ** * *** ***
Promotes understanding of the relationships between measures * * * ** ***
Facilitates simple reporting-demonstrating trends *** ** ** ** ***
*** High fulfillment of the requirements; ** medium; * low
BSC, balanced scorecard (Kaplan et al., 1996); PRISM, The performance prism (Neely et al., 2001); IDPMS, integrated dynamic performance measurement systems (Ghalayini et al., 1997); DPMSM, dynamic performance measurement system model (Bititci et al., 1999); PMS IE-GIP, performance measurement system IE-GIP (Alfaro et al., 2003).
Figure 2.3: Triple P-model
Source: Tangen, S. (2002). Understanding the concept of productivity. Proceedings of the Asia Pacific Industrial Engineering and Management Systems Conference (APIEMS 2002), Taipei.
discussion of various perspectives of performance measurement systems (balanced scorecard, component, planning level, and supply chain process), efforts to combine these perspectives, and efforts to classify vast amounts of performance measures. Lastly, performance measurement specific to textile and apparel supply chains is discussed.
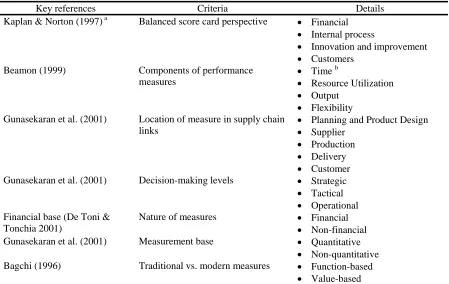
Table 2.2: Categories of performance measurement in logistics and SC systems
Source: Adapted from Gunasekaran, A. & Kobu, B. (2007). Performance measures and metrics in logistics and supply chain management: A review of recent literature (1995-2004) for research and applications.
International Journal of Production Research, 45(12), 2819-2840.
Key references Criteria Details
Kaplan & Norton (1997) a Balanced score card perspective • Financial • Internal process
• Innovation and improvement • Customers
Beamon (1999) Components of performance measures
• Time b
• Resource Utilization • Output
• Flexibility Gunasekaran et al. (2001) Location of measure in supply chain
links
• Planning and Product Design • Supplier
• Production • Delivery • Customer Gunasekaran et al. (2001) Decision-making levels • Strategic
• Tactical • Operational Financial base (De Toni &
Tonchia 2001)
Nature of measures • Financial • Non-financial Gunasekaran et al. (2001) Measurement base • Quantitative
• Non-quantitative Bagchi (1996) Traditional vs. modern measures • Function-based
• Value-based
2.2.1 Balanced Scorecard
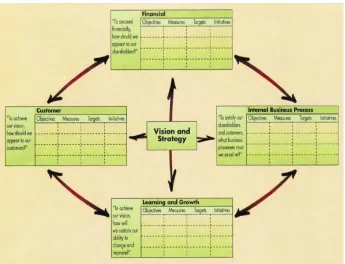
Since the initial publication of the balanced scorecard (Kaplan & Norton, 1992), the researchers released an updated version of the scorecard in 1996 (Figure 2.4). The scorecard (Kaplan & Norton, 1996) was updated to relate long-term strategy with short-term actions. In this way, the view of financial performance is balanced with performance in other areas (e.g., customers, innovation and learning), and performance is linked to strategy. Kaplan and Norton (1996) claim that balanced scorecards can be used to communicate strategic vision across an organization.
One important feature of the BSC is the combining of several company goals such as improving customer relations, shortening lead times, and improving quality. Another feature is that the BSC aids in avoiding suboptimization; that is, the BSC can be used to see the effect of improvement in one area on the performance of another area. Kaplan and Norton (1996) claim that the BSC focuses on strategy and vision, not control, and is therefore suited to dynamic business environments. The BSC provides goals for employees to improve performance; however, it is up to the individual to determine actions to meet the goals.
2.2.1.1Components of the Balanced Scorecard
Quality measures focus on customer-accepted defect levels. It is critical to consider the requirements of a customer in terms of quality. If a company delivers a quality level that is far above what their customers expect, then resources are being misused. Performance and service measures are used in conjunction to create value for the consumer. Cost has to be carefully considered, and companies should fully understand their customers. Price of products is only one component of cost; others include cost of returns, reworks, and lost time from quality/delivery issues.
The expectations of customers should be used to determine what companies should do internally to satisfy customers. Measures for the internal business perspective should therefore be developed from business processes that affect customer satisfaction, such as cycle time, quality, employee skills, and productivity (Kaplan & Norton, 1992). In addition, companies should identify and measure core competencies. Overall measures should be deconstructed to measures that can be applied at the factory and individual level in order to meet corporate objectives.
process defects, missed deliveries, and scrap by a factor of ten over four years (Kaplan & Norton, 1992).
Typical financial performance measures concern profitability, growth, and shareholder value (Kaplan & Norton, 1992). In the balanced scorecard approach, financial measures are used as a check for corporate strategy. For example, quality improvement efforts may not necessarily result in increased sales and market share, and strategic goals may need to be refined in order to focus on improvement in other areas in order to realize financial gains.
2.2.2 Component Perspective
F R
O
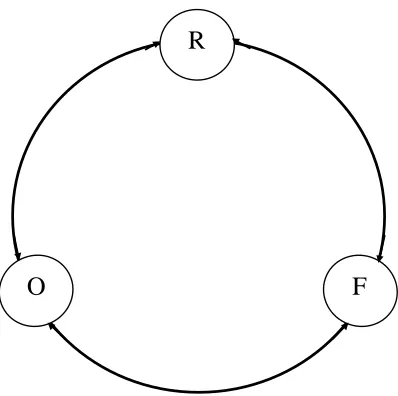
Figure 2.5: The supply chain measurement system
Source: Beamon, B.M. (1999). Measuring supply chain performance. International Journal of Operations and Production Management, 19(3), 275-292.
Table 2.3: Goals of performance measure types
Source: Beamon, B.M. (1999). Measuring supply chain performance. International Journal of Operations and Production Management, 19(3), 275-292.
Performance
measure type Goal Purpose
Resources High level of efficiency Efficient resource management is critical to profitability
Output High level of customer service Without acceptable output, customers will turn to other supply chains Flexibility Ability to respond to a
changing environment
In an uncertain environment, supply chains must be able to respond to change
Table 2.4: Examples performance measures
Source: Adapted from Beamon, B.M. (1999). Measuring supply chain performance. International Journal of Operations and Production Management, 19(3), 275-292.
Resources Output Flexibility
Total cost Sales Volume flexibility
Distribution costs Profits Delivery flexibility
Manufacturing cost Fill rate
• Target fill rate achievement
• Average item fill rate
Mix flexibility
Inventory
• Inventory investment
• Inventory obsolescence
• Work in-process
• Finished goods
On-time deliveries
• Product lateness
• Average lateness of orders
• Average earliness of orders
• Percent on-time deliveries
New product flexibility
Return on investment Backorder/stockout
• Stockout probability
• Number of backorders
• Number of stockouts
• Average backorder level Customer response time Manufacturing lead time
Shipping errors
Customer complaints
meeting target fill rates or in terms of an average fill rate, based on the number of items. On-time deliveries measure item, order, or product delivery performance. Product lateness is the delivery date minus the due date, average lateness/earliness is determined by dividing total lateness/earliness divided by total number of orders, and percent on-time deliveries shows the percentage of orders delivered on or before the due date. The backorder/stockout metrics concern the probability that an item is out of stock, the number of backorders due to a stockout, the number of stockouts, and the number of backorders divided by the total number of items. Customer response time is the amount of time between ordering and delivery. Manufacturing lead time is simply the amount of time required to product a product. Shipping errors are concerned with the number of incorrect shipments. Customer complaints simply measure the number of complaints. Flexibility measures concern the ability to adapt to changes in output level (volume flexibility), planned delivery dates (delivery flexibility), and variety of products produced (mix flexibility). Also, new product flexibility measures “the ability to introduce and produce new products” and modify existing products (Beamon, 1999, p. 285).
2.2.3 Planning Level Perspective
at the managerial level could result in better planning and increased forecast accuracy. At the strategic level, collaboration could result in capital investment to improve the supply chain.
Figure 2.6: Levels of collaboration
Source: Angerhofer, B.J. & Angelides, M.C. (2006). A model and a performance measurement system for collaborative supply chains. Decision Support Systems, 42(1), 283-301.
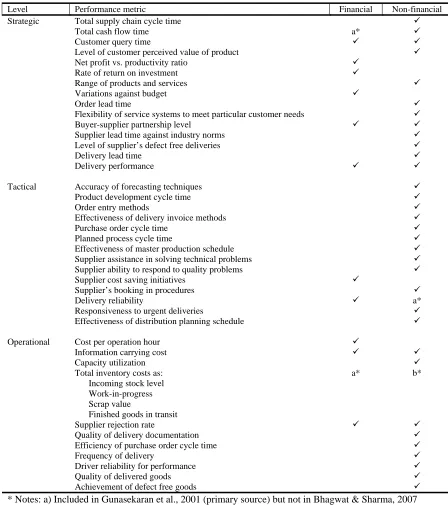
Table 2.5: A framework for performance metrics for supply chain evaluation
Source: Gunasekaran, A., Patel, C., & Tirtiroglu, E. (2001). Performance measures and metrics in a supply chain environment. International Journal of Operations & Production Management, 21(1/2), 71-87, cited in Bhagwat, R. & Sharma, M.K. (2007). Performance measurement of supply chain management: A balanced scorecard approach. Computers & Industrial Engineering, 53(1), 43-62.
Level Performance metric Financial Non-financial
Strategic Total supply chain cycle time 9
Total cash flow time a* 9
Customer query time 9 9
Level of customer perceived value of product 9
Net profit vs. productivity ratio 9
Rate of return on investment 9
Range of products and services 9
Variations against budget 9
Order lead time 9
Flexibility of service systems to meet particular customer needs 9
Buyer-supplier partnership level 9 9
Supplier lead time against industry norms 9
Level of supplier’s defect free deliveries 9
Delivery lead time 9
Delivery performance 9 9
Tactical Accuracy of forecasting techniques 9
Product development cycle time 9
Order entry methods 9
Effectiveness of delivery invoice methods 9
Purchase order cycle time 9
Planned process cycle time 9
Effectiveness of master production schedule 9
Supplier assistance in solving technical problems 9
Supplier ability to respond to quality problems 9
Supplier cost saving initiatives 9
Supplier’s booking in procedures 9
Delivery reliability 9 a*
Responsiveness to urgent deliveries 9
Effectiveness of distribution planning schedule 9
Operational Cost per operation hour 9
Information carrying cost 9 9
Capacity utilization 9
Total inventory costs as: Incoming stock level Work-in-progress Scrap value
Finished goods in transit
a* b*
Supplier rejection rate 9 9
Quality of delivery documentation 9
Efficiency of purchase order cycle time 9
Frequency of delivery 9
Driver reliability for performance 9
Quality of delivered goods 9
Achievement of defect free goods 9
Gunasekaran et al. (2001) also reviewed literature in the area of performance measurement systems and identified measures that were used as bases of research. These key measures, shown in Table 2.6, have been divided by planning level (strategic, operational, and tactical) and identified as financial or non-financial.
Table 2.6: A list of key SCM performance metrics
Source: Gunasekaran, A., Patel, C., & Tirtiroglu, E. (2001). Performance measures and metrics in a supply chain environment. International Journal of Operations & Production Management, 21(1/2), 71-87, cited in Bhagwat, R. & Sharma, M.K. (2007). Performance measurement of supply chain management: A balanced scorecard approach. Computers & Industrial Engineering, 53(1), 43-62.
Level Performance metric Financial
Non-financial
References
Strategic Total cash flow time 9 Stewart (1995)
Rate of return on investment 9 Christopher (1992); Dobler & Burt (1996)
Flexibility to meet particular customer needs
9 Bower & Hout (1988); Christopher (1992)
Delivery lead time 9 Rushton & Oxley (1991); Christopher
(1992)
Total cycle time 9 Christopher (1992); Stewart (1995)
Buyer-supplier partnership level 9 9 Toni et al. (1994)
Customer query time 9 Mason-Jones & Towill (1997)
Tactical Extent of cooperation to improve quality
9 Graham et al. (1994) Total transportation costs 9 Rushton & Oxley (1991)
Truthfulness of demand
predictability/forecasting methods
9 Fisher (1997); Harrington (1996) Product development cycle time 9 Bower & Hout (1988)
Operational Manufacturing cost 9 Wild (1995)
Capacity utilization 9 Stewart (1995)
Information carrying cost 9 Levy (1997); Lee & Billington (1992) Inventory carrying cost 9 Stewart (1995); Dobler & Burt (1996);
2.2.4 Supply Chain Sector Perspective
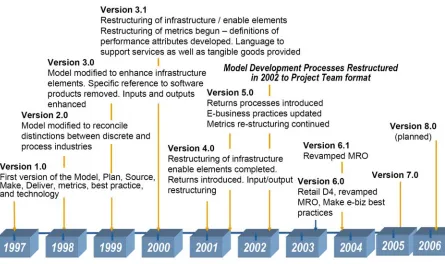
The Supply-Chain Operations Reference-model (SCOR), developed by the Supply-Chain Council, is a process reference model that serves as a diagnostic tool for supply chain management. In 1997, the Supply-Chain Council released the first version of the SCOR model. It included Plan, Make, Source, and Deliver as the stages of the supply chain in addition to metrics, best practices, and technology (Phelps, 2006). Version 4 was the first to include the Return stage of the supply chain. Currently, the SCOR model stretches from a company’s supplier’s supplier to a company’s customer’s customer, thereby encompassing all steps from concept of products to their final consumption (Figure 2.7).
The SCOR model has been through several revisions. Phelps (2006) provides a timeline of revisions to the model, shown as Figure 2.7. The latest release of the SCOR model, version 8.0, was in 2006. The SCOR model provides a framework for business processes, metrics, best practices, and technology. The SCOR model covers four levels: top level (process types), configuration level (process categories), process element level (decompose processes), and implementation level (decompose process elements).
Figure 2.8: SCOR release timeline
Performance metrics for the SCOR model, called Level 1 Metrics, are top level measures (Table 2.7). They can cross multiple SCOR top level processes (Plan, Source, Make, Deliver, and Return), though they “do not necessarily relate” to a top level process (Supply-Chain Council, 2006). The metrics as either customer-facing or internal-facing. Customer-facing metrics relate to reliability, responsiveness, or flexibility. Internal-facing metrics relate to either cost or assets. This system of cross-classification allows for visibility of the type of attribute and the metric that it affects.
Table 2.7: SCOR performance metrics
Source: Supply-Chain Council (2006). Supply-chain operations reference-model. Retrieved from http://www.supply-chain.org
2.2.5 Combination Perspectives
simply by combining various measurement systems and are therefore rearrangements of secondary data, a few researchers have validated their models through primary data.
2.2.5.1Gunasekaran et al., 2001
2.2.5.2Gunasekaran et al., 2004
Expanding on the work of Gunasekaran et al. (2001), Gunasekaran, Patel, and McGaughey (2004) surveyed 150 companies in various industries to assess the framework for performance metrics. Of these 150 companies, 21 surveys were returned – a 12% response rate. By validating secondary data with primary data, the resulting measurement system is strengthened.
Gunasekaran et al. (2004) adapted the framework of Gunasekaran et al. (2001), grouping metrics by planning area (tactical, strategic, and operational) and supply chain function (plan, source, make/assemble, and deliver). It has been adapted to show the importance level of each metric (Table 2.8). These importance levels are shown and discussed by planning level and supply chain sector in Gunasekaran et al. (2004).
Table 2.8: Supply chain performance metrics framework
Source: Adapted from Gunasekaran, Patel, & McGaughey, R.E. (2004). A framework for supply chain performance measurement. International Journal of Production Economics, 87(3), 333-347.
Supply chain activity/ process
Strategic Tactical Operational
Plan Level of customer perceived
value of product, Variances
against budget, Order lead time, Information processing cost, Net profit vs. productivity ratio, Total cycle time, Total cash flow time,Product development cycle time
Customer query time, Product
development cycle time, Accuracy of forecasting techniques, Planning process cycle time, Order entry methods, Human resource productivity
Order entry methods, Human resource productivity
Source Supplier delivery performance,
supplier leadtime against industry norm, supplier pricing against market, Efficiency or purchase order cycle time, Efficiency of cash flow method, Supplier booking in procedures
Efficiency of purchase order cycle time, Supplier pricing against market
Make/ Assemble
Range of product and services Percentage of defects, Cost per operation hour, Capacity
utilization, Utilization of
economic order quantity
Percentage of defects, Cost
per operation hour, Human
resource productivity index
Deliver Flexibility of service system to meet customer needs, Effectiveness of enterprise distribution planning schedule
Flexibility of service system to meet customer needs,
Effectiveness of enterprise distribution planning schedule, Effectiveness of delivery invoice methods, Percentage of finished goods in transit, Delivery reliability performance
Quality of delivered goods, On time delivery of goods, Effectiveness of delivery invoice methods, Number of faultless delivery notes invoiced, Percentage of urgent deliveries, Information richness in carrying out delivery, Delivery reliability performance Note: Adapted to show importance level of metrics: (Highly important, Moderately important, Less important)
2.2.5.3Bullinger et al., 2002
Table 2.9: Supply chain performance indicators
Source: Bullinger, H.-J., Kühner, M., & Van Hoof, A. (2002). Analysing supply chain performance using a balanced measurement method. International Journal of Production Research, 40(15), 3533-3543.
Financial Perspective Customer Perspective Organisational Perspective Innovation Perspective Supply Chain Perspective
• Total Supply Chain Costs
• Total Supply Chain Inventories • Total Supply Chain
Revenues
• Point of consumption product availability • Point of consumption
product quality
• Supply Chain Relationship quality • Productivity Loss • Perfect order
fulfillment
• Market share • New product
time-to-market • New product
time-to-first-make
Process- Perspective
• Return on investment • Return on capital
employed • Cash-to-cash cycle • Revenues
• Customer satisfaction • Customer loyalty • Customer complaints
• Forecast accuracy • Planning process
cycle
• Schedule changes
• Percent sales from new product • Percent employees
in cross-functional teams
Function Perspective
• Material acquisition cost
• Inventory costs • Work in progress • Costs per unit
produced • Freight costs • Picking costs • Transportation costs • Cash Flow
• In-time delivery • Order fill rate • Order cycle time • Invoice accuracy • Number of Back
Orders
• Percent resolution on first customer call • Order track and trace
Performance
• Incoming material quality
• Inventory count accuracy • Out of stocks • Line item fill • Inventory turns • EDI transactions
• Number of employee suggestions
2.2.5.4Bhagwat and Sharma, 2007
Table 2.10: Balanced scorecard for supply chain evaluation
Source: Adapted from Bhagwat, R. & Sharma, M.K. (2007). Performance measurement of supply chain management: A balanced scorecard approach. Computers & Industrial Engineering, 53(1), 43-62.
Financial Perspective Innovation and Learning Perspective
Net profit vs. productivity ratio Rate of return on investment Variations against budget Buyer-supplier partnership level Delivery performance
Supplier cost saving initiatives Delivery reliability
Cost per operation hour Information carrying cost Supplier rejection rate
Supplier assistance in solving technical problems Supplier ability to respond to quality problems Supplier cost saving initiatives
Supplier’s booking in procedure Capacity utilization
Order entry methods
Accuracy of forecasting techniques Product development cycle time
Flexibility of service systems to meet particular customer needs
Buyer-supplier partnership level Range of products and services
Level of customer perceived value of product
Customer Perspective Internal Business Perspective
Customer query time
Level of customer perceived value of product Range of products and services
Order lead time
Flexibility of service systems to meet particular customer needs
Buyer-supplier partnership level Delivery lead time
Delivery performance
Effectiveness of delivery invoice methods Delivery reliability
Responsiveness to urgent deliveries
Effectiveness of distribution planning schedule Information carrying cost
Quality of delivery documentation Driver reliability for performance Quality of delivered goods
Achievement of defect free deliveries
Total supply chain cycle time Total cash flow time
Flexibility of service systems to meet particular customer needs
Supplier lead time against industry norms Level of supplier’s defect free deliveries Accuracy of forecasting techniques Product development cycle time Purchase order cycle time Planned process cycle time
Effectiveness of master production schedule Capacity utilization
Total inventory cost as: Incoming stock level Work-in-process Scrap value
Finished goods in transit Supplier rejection rate
In order to build a firm-specific balanced scorecard for supply chain evaluation, Bhagwat and Sharma (2007) recommend a seven stage process:
1. Create awareness for the concept of balanced SCM scorecard in the organization;
2. Collect and analyze data on the following items:
a. Corporate strategy, business strategy, and SCM strategy;
b. Specific objectives and goals related to corporate strategy, business strategy, and SCM strategy;
c. Traditional metrics already in use for SCM evaluation;
d. Potential metrics related to four perspectives of balanced scorecard;
3. Clearly define the company specific objectives and goals of the SCM function for each of the four perspectives;
4. Develop a preliminary balanced SCM scorecard based on the defined objectives and goals of the enterprise;
5. Receive comments and feedback on the balanced SCM scorecard from the management, and revise it accordingly;
6. Achieve a consensus on the balanced SCM scorecard that will be used by the organization; and
7. Communicate both the balanced SCM scorecard and its underlying rationale to all stakeholders. (p. 55)
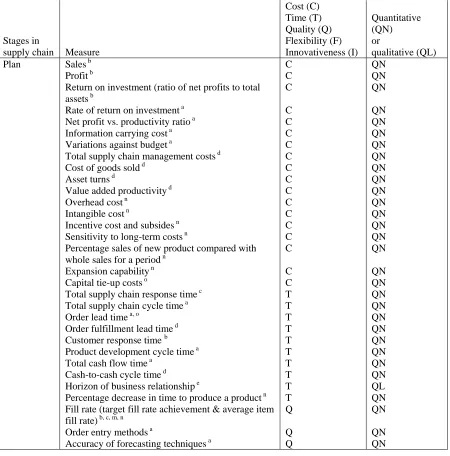
2.2.6 Exhaustive Perspectives
A disadvantage of this type of classification system is that is can be overwhelming, leading to difficulty in understanding or implementation.
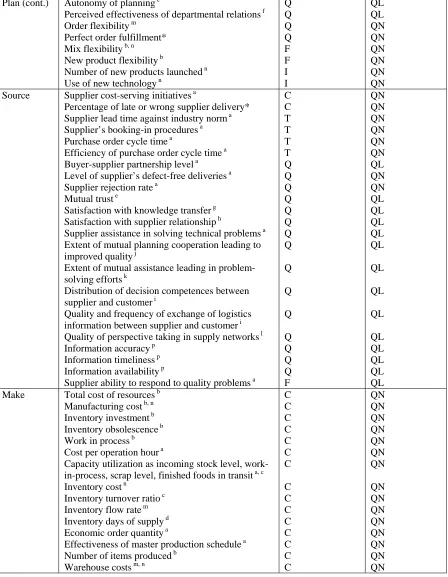
Table 2.11: Taxonomy of supply chain performance measures
Source: Shepard, C. & Günter, H. (2006). Measuring supply chain performance: Current research and future directions. International Journal of Productivity and Performance Management, 55(3/4), 242-258.
Stages in
supply chain Measure
Cost (C) Time (T) Quality (Q) Flexibility (F) Innovativeness (I) Quantitative (QN) or qualitative (QL) Plan Sales b
Profit b
Return on investment (ratio of net profits to total assets b
Rate of return on investment a Net profit vs. productivity ratio a Information carrying cost a Variations against budget a
Total supply chain management costs d Cost of goods sold d
Asset turns d
Value added productivity d Overhead cost n
Intangible cost n
Incentive cost and subsides n Sensitivity to long-term costs n
Percentage sales of new product compared with whole sales for a period n
Expansion capability n Capital tie-up costs o
Total supply chain response time c Total supply chain cycle time a Order lead time a, o
Order fulfillment lead time d Customer response time b Product development cycle time a Total cash flow time a
Table 2.11 continued
Plan (cont.) Autonomy of planning e
Perceived effectiveness of departmental relations f Order flexibility m
Perfect order fulfillment* Mix flexibility b, n
New product flexibility b
Number of new products launched n Use of new technology n
Q Q Q Q F F I I QL QL QN QN QN QN QN QN Source Supplier cost-serving initiativesa
Percentage of late or wrong supplier delivery* Supplier lead time against industry norm a Supplier’s booking-in procedures a Purchase order cycle time a
Efficiency of purchase order cycle time a Buyer-supplier partnership level a Level of supplier’s defect-free deliveries a Supplier rejection rate a
Mutual trust e
Satisfaction with knowledge transfer g Satisfaction with supplier relationship h
Supplier assistance in solving technical problems a Extent of mutual planning cooperation leading to improved quality j
Extent of mutual assistance leading in problem-solving efforts k
Distribution of decision competences between supplier and customer i
Quality and frequency of exchange of logistics information between supplier and customer i Quality of perspective taking in supply networks l Information accuracy p
Information timeliness p Information availability p
Supplier ability to respond to quality problems a
C C T T T T Q Q Q Q Q Q Q Q Q Q Q Q Q Q Q F QN QN QN QN QN QN QL QN QN QL QL QL QL QL QL QL QL QL QL QL QL QL Make Total cost of resources b
Manufacturing cost b, n Inventory investment b Inventory obsolescence b Work in process b Cost per operation hour a
Capacity utilization as incoming stock level, work-in-process, scrap level, finished foods in transit a, c Inventory cost n
Inventory turnover ratio c Inventory flow rate m Inventory days of supply d Economic order quantity a
Effectiveness of master production schedule a Number of items produced b
Table 2.11 continued Make
(cont.)
Stock capacity m Inventory utilization m Stockout probability b, n Number of backorders b Number of stockouts b Average backorder level b
Percentage of excess/lack of resource within a period n
Storage costs per unit of volume o Disposal costs o
Planned process cycle time a Manufacturing lead time b
Time required to produce a particular item or set of items b
Time required to produce new product mix n Inventory accuracy m
Inventory range o
Percentage of wrong products manufactured n
Production flexibility d Capacity flexibility c Volume flexibility b, n
Number of tasks worker can perform n
C C C C C C C C C T T T T Q F Q F F F F QN QN QN QN QN QN QN QN QN QN QN QN QN QN QN QN QN QN QN QN Deliver Total logistics costs o
Distribution costs b, n Delivery costs m Transport costs m
Transport costs per unit of volume o Personnel costs per unit of volume moved o Transport productivity m
Shipping errors b Delivery efficiency o
Percentage accuracy of delivery n Delivery lead time a
Frequency of delivery a Product lateness b
Average lateness of orders b Average earliness of orders b Percent of on-time deliveries b, n Delivery performance a, d Delivery reliability a, c, d, m Number of on-time deliveries b
Table 2.11 continued Deliver
(cont.)
Responsiveness to urgent deliveriesa, m Transport flexibility m
F F QN QN Return (customer satisfaction)
Warranty/returns processing costsd Customer query time a
Customer satisfaction (or dissatisfaction) b, n Level of customer perceived value of product a Customer complaints b
Rate of complaint c Product quality b, m
Flexibility of service systems to meet particular customer needs a
C T Q Q Q Q Q F QN QN QL QL QN QN QL QL
Notes:a = Gunasekaran et al. (2001); b = Beamon (1999); c = Schonsleben (2004); d = SCOR level I metrics;
e
= Hieber (2002); f = Ellinger; g = Sperka (1997); h = Artz (1999); i = Windischer & Grote (2003); j = Graham et al. (1994); k = Maloni & Benton (1997); l = Parker & Axtell (2001); m = Chan & Qi (2003); n = Chan (2003); o = VDI guidelines (association of engineers); p = Van der Vorst & Beulens (2001); Note by Allen (2008): * = no source provided
Table 2.12: Supply chain performance metrics and relation to categories and factors
2.3 Textile and Apparel Applications
Though there has been much research in terms of performance measures for supply chains, textile and apparel specific research in the area is lacking. There have been a limited number of studies related to textiles and apparel (Lohman et al., 2004; McMullen, 1996; Nowell, 2005; Sauls, 2007).
A study performed by McMullen (1996) examined supply chain management processes in the Asia Pacific region. A survey methodology was used, and included respondents from a variety of industries performing various supply chain functions (manufacture, service, resource, and retail). The sample included two apparel firms. Results indicate that 85% of those companies surveyed used financial performance measures, among them budget to actual, savings, return on investment (ROI), return on equity (ROE), and other measures (McMullen, 1996). In addition to financial performance measures, companies were utilizing customer service performance measures such as on-time deliveries, customer complaints, back orders, stock-outs, inventory accuracy, ship errors, total order cycle time, and fill rates. Ten percent of those surveyed had no customer service performance measures in place (McMullen, 1996).
specified by the researcher (McMullen, 1996). When looking at warehouse performance, twelve percent of respondents had no measures in place. The performance measures utilized by the remaining 88% included inventory accuracy, in-time shipments, shipping errors, customer complaints, back orders, warehouse cycle time, number of kilos/units shipped, number of dollars shipped, or other measures (McMullen, 1996).
Figure 2.10: Most important factors in choosing a sourcing region/partner Source: Sauls, J. (2007). Excellence in sourcing. Apparel Magazine, 48(12), Suppl., 2-9.
Figure 2.11: Performance measure frequency – secondary data
Source: Nowell, C.H. (2005). Market competitiveness in the global textile supply chain: Examination of supply chain configurations (Master’s thesis, North Carolina State University, 2005). Retrieved from
http://www.lib.ncsu.edu/theses/available/etd-04182005-105951/unrestricted/etd.pdf
Figure 2.12: Performance measure frequency – primary data (Nowell, 2005)
Source: Nowell, C.H. (2005). Market competitiveness in the global textile supply chain: Examination of supply chain configurations (Master’s thesis, North Carolina State University, 2005). Retrieved from
http://www.lib.ncsu.edu/theses/available/etd-04182005-105951/unrestricted/etd.pdf
A study conducted by Lohman, Fortuin, and Wouters (2004) focused on performance measurement at Nike’s European operations center in Belgium. This center serves Europe, the Middle East, and Africa. It is important to note that the study did not cover the entirety of the Nike supply chain; rather, only the European market was investigated and only in terms of operations (transportation, warehousing, and customer service). The researchers developed a scorecard, based on the work of Kaplan and Norton (1992, 1996), for performance measurement, and also developed a list of performance measures for each category of the balanced scorecard.
sustainability section (relating to environmental stewardship) and people (relating to organizational health and employee satisfaction). This scorecard was developed by Lohman et al. (2004) while working at Nike Europe’s operations center, and the scorecard format has evolved since the research ended. This highlights the fact “that the format is a fluid element for the development and implementation of [performance measurement systems]” (Lohman et al., 2004, p. 281). That is, performance measurement systems should evolve as business dynamics and requirements shift.
Mission & Strategy
People Sustainability
Process
Improvement Product Flow
Financial Customer
How are we building our organization? How do we appear to our customers?
Are we creating shareholder value?
Are we flowing our product effectively? Are we on track in improving
our processes? Are we safeguarding the
environment? Mission & Strategy People Sustainability Process
Improvement Product Flow
Financial Customer
How are we building our organization? How do we appear to our customers?
Are we creating shareholder value?
Are we flowing our product effectively? Are we on track in improving
our processes? Are we safeguarding the
environment?
Figure 2.13: Balanced scorecard for Nike European Operations
2.4 Conclusion
There have been many efforts in the recent past to determine metrics to gauge the performance of supply chains. It is interesting to note that most of the performance measurement systems published in the literature are based on a limited number of studies. Figure 2.14 was developed to illustrate how studies on performance measures relate over time. The four main streams of research (Beamon, 1999; Gunasekaran et al., 2001; Kaplan & Norton, 1992; Kaplan & Norton, 1996; Supply-Chain Council, 1997-2006) have each been assigned a different color for ease of reading. From this, one can see how each of these four performance measurement systems has been used as the basis for the other studies.
Gunasekaran et al 2001
Gunasekaran et al 2004a
Bhagwat & Sharma 2007a
Gunasekaran & Kobu 2007
Kaplan & Norton 1992a
Lohman et al 2004a,b
2000
1995
2005
Supply Chain Council v. 1.0 – v. 8.0
1997- 2006a
Kaplan & Norton 1996a, 1996a
Bullinger et al 2002
Angerhofer& Angelides 2006 Chan
2003
Shepherd & Günter 2006
Beamon
1999
Nowell 2005a,b
Gunasekaran et al 2001
Gunasekaran et al 2004a
Bhagwat & Sharma 2007a
Gunasekaran & Kobu 2007
Kaplan & Norton 1992a
Lohman et al 2004a,b
2000
1995
2005
Supply Chain Council v. 1.0 – v. 8.0
1997- 2006a
Kaplan & Norton 1996a, 1996a
Bullinger et al 2002
Angerhofer& Angelides 2006 Chan
2003
Shepherd & Günter 2006
Beamon
1999
3
METHODOLOGY3.1 Purpose of the Research
This research investigated performance measurement for supply chains in both developing and developed countries. It identified the specific measures that textile and apparel companies use to gauge the performance of their supply chains. The research developed a practical definition of supply chain management used in developing countries. Also, this research evaluated performance improvement efforts of textile and apparel manufacturers in developing countries.
3.2 Research Objectives
The objectives of this research were to:
RO1: Identify the measures used by textile and apparel companies to gauge the performance of their supply chains in:
RO1A: Developing countries; RO1B: Developed countries.
RO2: Develop a practical definition of supply chain management in developing and developed countries.
3.3 Research Design
This research used a two-phase mixed methods approach; both quantitative and qualitative data were collected and analyzed. The first phase of this methodology was exploratory in nature and consisted of field research – plant visits and interviews – on the Sri Lankan textile and apparel industry. This first phase of the research was conducted from May-August 2007.
The second phase of the research was exploratory as well and consisted of an internet survey and phone interviews on a global sample of textile and apparel companies in both developed and developing countries. This phase was conducted from June-September 2008. The second phase of the research used a concurrent triangulation strategy, shown in Figure 3.1, which involves collecting quantitative (QUAN) and qualitative (QUAL) data simultaneously and comparing results from analysis of each type of data. This strategy was selected because it offers the ability to confirm, cross-validate, or corroborate findings within a single study (Creswell, 2003).
Figure 3.1: Concurrent triangulation strategy.
Source: Creswell, J. (2003). Research design: Quantitative, qualitative, and mixed methods approaches. Thousand Oaks, CA: Sage Publications.
3.3.1 Phase I (Field Research – Sri Lanka)
Phase I of the research involved field research in Sri Lanka. The objectives of Phase I were to 1) understand the current state of the Sri Lankan textile and apparel industry and 2) identify the needs of the industry. This phase of the research was critical to understanding the textile and apparel industry in developing countries.
3.3.1.1Phase I (Field Research – Sri Lanka): Sample Selection
The factories visited and respondents interviewed were a convenience sample chosen based on availability of contacts. In total, four factories were visited and twenty-one respondents
QUAN
Data Collection
Quan
Data Analysis
QUAL
Data Collection
Qual
Data Analysis
+
QUAN QUAL
were interviewed. In addition, two textile and apparel industry training institutes were toured and their training programs studied. A government sponsored training institute for textiles and apparel that works closely with industry arranged for the meetings and factory visits.
3.3.1.2Phase I (Field Research – Sri Lanka): Data Collection
Industry institutes and manufacturing facilities were toured, and respondents from government, industry, and academe were interviewed. These interviews and visits aided in assessing the current state of the industry in Sri Lanka, as well as the needs of the Sri Lankan textile and apparel industry. Data collection for interviews was structured, though data collection for factory visits was unstructured.
3.3.2 Phase II (Survey and Interview)
3.3.2.1Phase II (Survey): Sample Selection
The survey sample was chosen from the population of domestic and international textile and apparel companies. International companies for this study were chosen through country-specific textile and apparel trade associations. The companies chosen represent a convenience sample, and companies were identified through the online rosters of textile and apparel trade associations. The following developing countries were targeted for study:
1. Asia: Sri Lanka, Bangladesh, Thailand
2. Latin America: El Salvador, Guatemala, Honduras, Costa Rica, Dominican Republic, and Peru.
Domestic companies for this study were chosen through the alumni roster of a leading domestic textile institution.
Companies identified for this study competed in the sectors of textile and apparel supply chain: 1) fiber/yarn producers, 2) fabric manufacturers, 3) fabric finishers, 4) apparel manufacturers, 5) apparel brand managers and marketers, and 6) retailers. The goal was to study domestic apparel marketers and retailers and to study international apparel manufacturers. Upstream companies such as fiber, yarn, and fabric manufacturers were studied in developing countries as well as in the United States.
lists utilized. It is important to note that the country-specific lists did have duplicates present. When adding addresses to the email lists, a listserv program used to create the lists automatically removed duplicates. In total, 5724 possible respondents were contacted for participation in the study.
Table 3.1: Listserv descriptors
Email List Number of Email Addresses
List 1 4059
Bangladesh 3364
Sri Lanka 460
Thailand 1969
List 2 1302
El Salvador 86
Guatemala 257
Dominican Republic 136
Honduras 225
Costa Rica 30
Peru 643
Alumni Email List 363
3.3.2.2Phase II (Survey): Data Collection
survey (Appendix C). Upon completion of the survey, respondents were directed to a thank you page (Appendix D).
3.3.2.3Phase II (Survey): Research Questions
From the research objectives, specific survey-related research questions were developed. Table 3.2 shows the independent and dependent variables studied and how these variables relate to the research objectives (RO). In addition, Table 3.2 lists the corresponding coded variable, shown in parentheses, for analyzing data in the Statistical Package for the Social Sciences (SPSS), discussed in Section 3.3.2.4.
Table 3.2: Dependent and independent variables for study
Independent Variables Dependent Variables RO
a) Country (V3) b) Country type (V3alt) c) Region (V3alt1) d) Type of company (Q5) e) Products produced (Q7) f) Manufacturing region
(Q8)
g) Size of company, sales (V11alt)
h) Size of company, emps (V12)
i) End market (Q13)
1) Presence of performance measurement system (V14) 2) Basis of performance measurement system (Q15)
3) Components of performance measurement system (Q16 ) 4) Specific performance metrics for suppliers (Q17)
5) Specific performance metrics for customers (Q18) 6) Specific performance metrics for company (Q19) 7) Specific performance metrics for supply chain (Q20)
RO1
8) Presence of performance improvement program (V21alt) 9) Type of performance improvement program (Q21) 10) Focus of performance improvement (Q22) 11) Strategies to improve competitiveness (Q23)
RO3
The specific research questions developed were:
RQ1: How does the presence of a performance measurement system differ?
RQ1b: Does the presence of a performance measurement system differ by country type?
RQ1c: Does the presence of a performance measurement system differ by region? RQ1d: Does the presence of a performance measurement system differ by type of company?
RQ1e: Does the presence of a performance measurement system differ by products produced?
RQ1f: Does the presence of a performance measurement system differ by manufacturing region?
RQ1g: Does the presence of a performance measurement system differ by company size in terms of sales?
RQ1h: Does the presence of a performance measurement system differ by company size in terms of number of employees?
RQ1i: Does the presence of a performance measurement system differ by end market?
RQ2: How does the basis of a performance measurement system differ?
RQ2a: Does the basis of a performance measurement system differ by country? RQ2b: Does the basis of a performance measurement system differ by country type? RQ2c: Does the basis of a performance measurement system differ by region?
RQ2d: Does the basis of a performance measurement system differ by type of company?
RQ2e: Does the basis of a performance measurement system differ by products produced?
RQ2f: Does the basis of a performance measurement system differ by manufacturing region?
RQ2g: Does the basis of a performance measurement system differ by company size, in terms of sales?
RQ2h: Does the basis of a performance measurement system differ by company size, in terms of number of employees?
RQ2i: Does the basis of a performance measurement system differ by end market?
RQ3: How do the components of a performance measurement system differ?
RQ3a: Do the components of a performance measurement system differ by country? RQ3b: Do the components of a performance measurement system differ by country type?