Video-on-demand QoE Evaluation Across Different
Age-Groups and Its Significance for Network Capacity
Mujtaba Roshan
1,*, John A. Schormans
2and Rupert Ogilvie
31 Mujtaba Roshan is with the School of Electronic Engineering and Computer Science, Queen Mary University of London,
London, UK. He would like to acknowledge the award of a UK Government EPSRC CASE studentship with Intergence Systems that supports his research.
2 John A. Schormans is with the School of Electronic Engineering and Computer Science, Queen Mary University of London,
London, UK.
3Rupert Ogilvie is with Intergence Systems, Old Coach House, Brewery Road, Pampisford CB22 3HG
Abstract
Quality of Experience (QoE) drives churn in the broadband networks industry, and good QoE plays a large part in the retention of customers. QoE is known to be affected by the Quality of Service (QoS) factors packet loss probability (PLP), delay and delay jitter caused by the network. Earlier results have shown that the relationship between these QoS factors and QoE is non-linear, and may vary from application to application. We use the network emulator Netem as the basis for experimentation, and evaluate how QoE varies as we change the emulated QoS metrics. Focusing on Video On Demand we discovered that the reported QoE may differ widely for users of different age groups, and that the most demanding age group (the youngest) can require an order of magnitude lower PLP to achieve the same QoE than is required by the most widely studied age group of users. We then used a bottleneck TCP model to evaluate the capacity cost of achieving an order of magnitude decrease in PLP, and found it be (almost always) a 3-fold increase in link capacity that was required.
Keywords: quality of experience, quality of service, packet loss probability, network capacity. Received on 6 October 2017, accepted on 8 January 2017, published on 10 January 2018
Copyright © 2018Mujtaba Roshanet al., licensed to EAI. This is an open access article distributed under the terms of the Creative Commons Attribution licence (http://creativecommons.org/licenses/by/3.0/), which permits unlimited use, distribution and reproduction in any medium so long as the original work is properly cited.
doi: 10.4108/eai.10-1-2018.153557
*Corresponding author. Email:[email protected]
1. Introduction
This is the body text with no indent. In this paper we report research with 2 main aims. The first aim was to use a network emulator Netem [1] to run experiments evaluating the relationships between QoS metrics packet loss probability (PLP) and the user-perceived Quality of Experience (QoE) for video on demand (VoD). The second aim was to include in our experimentation widely different age groups of users, and then to try to evaluate the capacity cost of meeting the QoS parameters demanded by the most critical of these tested users.
Earlier work on QoE across different age groups has been quite limited. Some published work on QoE in schools, [2], has studied QoE across age groups. Otherwise a survey of Global broadband networking by consultants Ovum (2016) concluded that “…Younger people tend to be heavier and more demanding users, meaning that their usage is higher and expectations greater” [3]. Also, a report to the UK Government’s Office of the communications regulator in the UK (OfCom) concluded that “… the scores are comparable across the different age groups, although the oldest participants had a tendency to score higher and the youngest to score lower…”, [4].
Both these (Ovum and OfCom) reports support the basis of our studies examining QoE across age groups, and its effect on the underlying networks. We believe that earlier work in the literature has not focused enough on age varying QoE. For example, a recent (2016) PhD thesis states of its experimental subjects in a study of QoE “In this study, a total of 43 subjects participated in subjective tests. The mean age of participants was 24.5 years, the maximum age was 32 years and minimum age was 21 years.” [5].
We report that the perceived QoE can differ widely for users of different age groups. Inter alia this means that the most demanding age group (the youngest) requires (at the critical Service Level guaranteed PLP of 0.001) an order of magnitude lower packet loss probability to achieve the same QoE. We then go on to apply the results of using a known relationship between PLP and network capacity to provide insight into the potential cost of re-dimensioning a network to probabilistically guarantee the lower of the two PLPs. The lower PLP is the one associated with the higher network capacity required to probabilistically assure the lower PLP.
1.1. Network Experiments
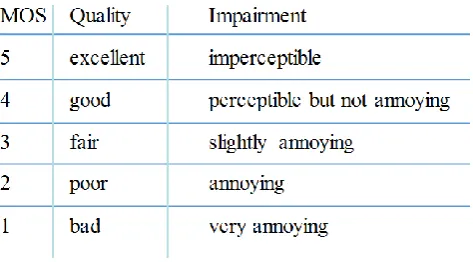
The results of our experiments were recorded as a MOS score, see figure 1. It is well known that these MOS scores vary depending on the protocols, applications and transport layer protocol being used. We used the network emulator Netem to run experiments evaluating the relationships between PLP and the user-perception metric QoE for VoD. We ensured that 1) Netem was configured such that packet ordering is maintained to ensure we emulate the normal operation of a commercial broadband packet network; 2) we included in our studies a full range of age groups – experimentation over different age groups has been largely absent in earlier work mapping QoS metrics to QoE.
The Linux Foundation, [6], states that
"Netem provides Network Emulation functionality for testing protocols by emulating the properties of wide area networks. The current version emulates variable delay, loss, duplication and re-ordering.". Typically, the delay in a network is not uniform, and Netem provides both the Normal and Pareto distribution to describe the distribution of delay, as well as providing the facility to add +/- ‘t’ millisecs added to each packet arrival time model as a simple delay jitter model.
Netem also allows the user to build an arbitrary distribution [7]. In general our experimentation implemented the model outlined in [8], [9].
We equipped our experimental testbed with a host device computer with two Ethernet ports, enabling us to conduct all the experimentation required. This device was connected to a laptop running VLC; the laptop received the video stream, processed and displayed it. The two devices were connected via a CAT 5E Ethernet cable. We used the operating system LINUX Ubuntu, which had
Netem already pre-installed and ready for use. Netem’s scheduler default reorders the packets when jitter is added, which creates a queuing discipline which acts rather like a datagram network. To emulate a more realistic commercial broadband network we changed the Netem default to PFIFO [10]. PFIFO does not re-order packets when delay jitter is added.
Figure 1. The MOS Scale
We recorded MOS scores from participants over different age groups: 10 – 18 years, 19 – 30 years, 31 – 45 years, 46 – 65 years, and over 65 years old. The same video with the same range of added packet loss was shown to all the participants. Having collected the opinion of different people in the same age group, an average was then calculated to form the MOS for that certain age group. In general there was little observed difference in MOS scores over the ranges of participants, except for the youngest group.
The literature, e.g. [11], [12] and [13] suggests the age group 19-30 is much better represented in earlier work mapping QoE/MOS to QoS metrics. This is the age group that contains most PhD students and post-docs, so most published QoE/MOS to QoS mapping the results will have tended to be biased towards this group, and will have necessarily excluded the group of slightly younger users who make up a considerable proportion of heavy users of broadband networks (as noted earlier). These younger users are potentially of considerable interest to network and service providers.
The results of fitting MOS results for two key groups of experimental subjects are summarized in equations (1) and (2). (1) gives the MOS formula for subjects in the age group 19-30, the most commonly studied age group, while (2) gives the MOS formula for the most demanding age group (10 to 18 year olds).
(1)
For (1) the goodness of fit measures were: SSE: 0.00094
(2)
For (2) the goodness of fit measures were: SSE: 0.001797
R-Square: 0.9975 RMSE: 0.1341
The standard, guaranteed PLP value for most commercial broadband networks is PLP = 0.001, e.g. see: ITU Rec. Y.1541, also industry technical standards [14], section 3 of [15], and BTnet Service Level Agreement, [16]. At PLP=0.001 the results for the two age groups as given in (1) and (2) are MOS=4 and MOS=3. Our results showed that to achieve MOS=4 for the more demanding age group requires an order of magnitude improvement in PLP, i.e. from 0.001 (0.1%) to 0.0001 (0.01%).
We now look at the possible consequences of this requirement to lower PLP on the dimensioning of network capacity, an issue of growing importance as the “… explosive growth of Over-the-top (OTT) online video strains capacity of operators' networks, which severely threatens video quality perceived by end users.”, [17]. We choose to focus here on network capacity dimensioning not because it is the only way in which these results are of significance, but because network capacity dimensioning is possibly the fundamental network engineering challenge (and has been since the work of A.K.Erlang).
2. Analysis of Effect of Age Related MOS
Disparity on Capacity Dimensioning
In [18] the formula reproduced below as (3) was derived for multiplexed TCP sources through a bottleneck link. The use of a bottleneck network topology structure is quite traditional in performance evaluation studies in networking, and it still widely used now, e.g. see [19], and we adopt this topological structure here.
(3)
m = factor by which TCP sending rate is reduced on loss (usually ½)
b = number packets acknowledged by an ACK packet, usually 1
RTT = round trip time in seconds Q = buffer length in packets
C = bottleneck capacity in packets per second
(3) relates network bottleneck capacity, C, to the number of TCP sources, N, the round-trip-time, RTT, and the required PLP. We now use (3) to deduce the required increase in capacity that would be needed to reduce the PLP by a single order of magnitude, as required by the most demanding group of network users. We do this for a range of RTT’s and capacity values at the bottleneck link. Define:
= packet loss probability low, i.e. achieved when capacity is the h(i1g)h er value
= packet loss probability high, i.e. achieved when capacity is the lower value
= the higher capacity value, i.e. the capacity that gives the lower packet loss probability
= the original (lower) capacity value, i.e. the capacity that gives the original (higher) packet loss probability
Thus:
(4)
(5)
Dividing (5) by (4) gives:
(6)
We assume the original value of is known, as it will be the capacity value that was dimensioned into the network to ensure the QoE of the majority of users. We now seek to determine the proportional increase in C needed to achieve a one order of magnitude improvement in PLP, as required by the most QoE-demanding users (the youngest group of users).
Rearranging (6) by taking logs yields:
(7)
(8)
(9)
(10)
Then the factor by which the capacity needs to be increased is found as:
(11)
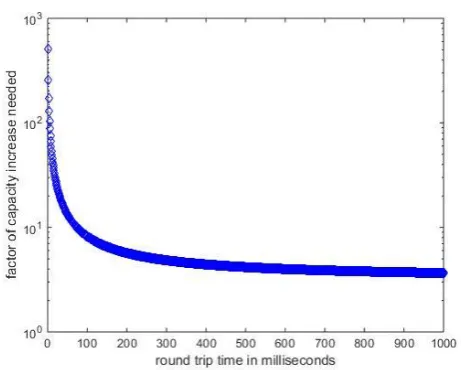
Figure 2 and Figure 3 give results for a very large bottleneck capacity: 1Gbps. Both Figure 2 and 3 shows the ratio of the increased capacity for the lower PLP divided by the original capacity, C (i.e. the “factor of capacity increase needed”) plotted against the RTT for a range of RTT values increasing from 1 millisecond to 10 seconds. We choose to look at such a large range of RTT as the actual existence of such a very wide range of RTT is supported by prior empirical studies in TCP RTTs [20]. Figure 2 is for a bottleneck queue size of 1000 packets, using guidelines in [21]. It is clear that the capacity increase required very quickly converges on a value just in excess of 3.
Figure 1. Capacity increase factor for C = 1GB and Q =
1000
Figure 3 affirms this level of required capacity increase (just in excess of 3) even when the bottleneck buffer capacity is increased 10-fold.
Figure 3. Capacity increase factor for C = 1Gbps and Q=10000
Figure 4. Capacity increase factor for C = 20Mbps and Q=1000
Figure 6. Capacity increase factor for C = 512kbps and Q=10000
Figure 4 shows the capacity increase factor for a 20Mbps bottleneck link, i.e. one that consist of 20 x E1 links [22]. This factor is again just larger than 3 for all RTT values that are not very small (i.e. are larger than 10ms). Figure 5 repeats for a much smaller bottleneck link capacity of 512kbps. We here see that the RTT has a much stronger effect, and the required capacity increase doesn’t reach around a factor of 3 until the RTT has reached around 100 milliseconds.
Figure 6 shows that, at low levels of bottleneck capacity (512kbps), the effect of the buffer size becomes much more significant, with the capacity increase factor not reaching as low at 3 until RTT has reached some
hundreds of milliseconds. For this reason we examine the manufacturer recommendations for queue sizing in the router buffers.
3.1. Default Queue Sizing for Router
Buffers
We now consider the effect of using the default queue sizing recommended for Cisco routers, using Cisco’s own instructions as a guide [23]. Specifically, we now adjust the packet queue depth such as to allocate the (default) of 50 milliseconds worth of buffering at the link capacity (assuming 1500 byte packet sizes), while ensuring, as per these instructions, that this allocated queue depth never falls below 64 packet spaces (again for 1500 byte packet sizes).
For a bottleneck link of 512kbps (the worst case of our earlier evaluations) we now set Q=64 packets. This produced the set of results shown as Figure 7, which should be contrasted with Figure 6.
Figure 7. Capacity increase factor for C = 512kbps and Q=64
In Figure 7 we clearly see that the capacity increase factor very rapidly converged, again, to just in excess of 3 times the original capacity.
4. Conclusion
We studied the effect of age on reported QoE (MOS) scores for VoD in broadband networks, and conclude that the difference between the most demanding age group (10 to 18 years old) and the most frequently studied age group (19 to 30 year old) is such as to require an order of magnitude improvement in the network PLP to achieve the same MOS score. We then investigate the capacity increase needed to reduce the PLP by an order of magnitude through a bottleneck link in which the queueing is caused by multiplexed TCP traffic. Our results show that an order of magnitude improvement in PLP would require very close to a 3 times increase in bottleneck link capacity at all but very low RTTs.
References
[1] http://manpages.ubuntu.com/manpages/zesty/man8/tc-netem.8.html Accessed 2 May 2017
[2] M. Bassi, P. Steca P, A. Fave, G. Caprara, “Academic Self-Efficacy Beliefs and Quality of Experience in Learning”, J. Youth Adolesc. 2007 April, 36(3), pp. 301-12.
[3] http://bes.ovum.com/downloads/Global_Broadband_Exper ience_Scorecards.pdf Accessed 2 May 2017
[4] https://www.ofcom.org.uk/__data/assets/pdf_file/0015/633 12/understanding_satellite.pdf Accessed 2 May 2017 [5] http://www.bth.se/com/jun.nsf/attachments/Junaid_PhDTh
[6] Linux Foundation (2009), Netem, available at: http://www.linuxfoundation.org/collaborate/workgroups/ne tworking/netem retrieved 2 May 2017
[7] http://citeseerx.ist.psu.edu/viewdoc/download?doi=10.1.1. 67.1687&rep=rep1&type=pdf Accessed 2 May 2017 [8] Information technologies and sciences COST 224,
Performance evaluation and design of multiservice networks, report of EU Project COST224, Chapter 7, pp. 159–170.
[9] D. Anick, D. Mitra D and M. Sondhi, “Stochastic Theory of a Data-Handling System with Multiple Sources”. BSTJ
Vol. 61, No.8.
[10] J. Sliwinski, A. Beben, P. Krawiec, “EmPath: Tool to Emulate Packet Transfer Characteristics in IP Network”. International Workshop on Traffic Monitoring and Analysis, TMA 2010: Traffic Monitoring and Analysis pp 46-58.
[11] M. Varela, T. M ̈aki, L. Skorin-Kapov, T. Hoßfeld, “Towards an Understanding of Visual Appeal in Website Design”, Quality of Multimedia Experience (QoMEX), 2013 Fifth International Workshop on, 3-5 July 2013. [12] M. Mushtaq, B. Augustin, A. Mellouk, “QoE: User profile
analysis for multimedia services”, 2014 IEEE International Conference on Communications (ICC), 2014, pp 2289 – 2294.
[13]
http://www.diva-portal.org/smash/get/diva2:830726/FULLTEXT01.pdf Accessed 2 May 2017
[14] http://www.tcf.org.nz/industry/standards-
compliance/infrastructure-connections/ip- interconnection/ip-interconnection-for-voice-technical-standards.pdf, retrieved 2 May 2017
[15] http://www.eu.ntt.com/content/dam/nttcom/eu/pdf/services
/network/ip-network-transit/sla-of-global-ip-network/NTTE_GIN_SLA_250210.pdf Accessed 2 May 2017
[16] https://business.bt.com/content/dam/bt/business/Networkin g/BTnet_leased_line_service_level_agreement.pdf, retrieved 2 May 2017
[17] A. Devlic, P. Kamaraju, P. Lungaro, Z. Segall, and K. Tollmar, “QoE-aware optimization for video delivery and storage”, 2015 IEEE 16th International Symposium on A World of Wireless, Mobile and Multimedia Networks
(WoWMoM), 2015.
[18] I. Bisio and M. Marchese, “Analytical Expression and Performance Evaluation of TCP Packet Loss Probability Over Geostationary Satellite”, IEEE COMMUNICATIONS LETTERS, VOL. 8, NO. 4, APRIL 2004.
[19] N. Cardwell, Y. Cheng, C. S. Gunn, S. H. Yeganeh, and Van Jacobson, “BBR: Congestion-Based Congestion Control”, Communications of the ACM, February 2017, Vol. 60 No. 2, Pages 58-66
[20] https://people.cs.umass.edu/~phillipa/papers/SPECTS.pdf Accessed 2 May 2017
[21] https://www.nanog.org/meetings/nanog32/presentations/ap penzeller.ppt Accessed 2 May 2017
[22] http://www.juniper.net/documentation/en_US/junos12.1x4
6/topics/concept/interface-security-t1-and-e1-understanding.html Accessed 2 May 2017 [23]
![Figure 2 is for a bottleneck queue size of 1000 packets, using guidelines in [21]. It is clear that the capacity increase required very quickly converges on a value just](https://thumb-us.123doks.com/thumbv2/123dok_us/8423671.1695152/4.595.52.282.241.421/figure-bottleneck-packets-guidelines-capacity-increase-required-converges.webp)